Germany30

DAX30/GER30 forcastlooks like ger30 has very strong buy power. I'm not sure ger30 movement right now . I have done forecast on ger30 . Hope ger30 will goes like my way


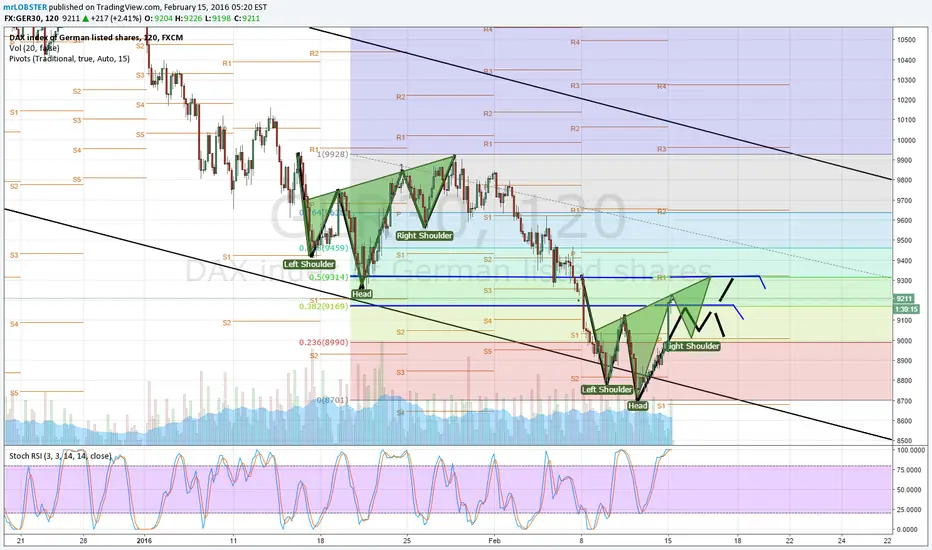
GER30If dax breaks the trend line (9500) suggest a sell all the way down to 9000 and below, however more likely scenario it bouncing up the trend line to 10,000+

An Attempt to Decipher Ger30I do not know what will eventually happen,But until then, staying the OODA Loop I've tried to take pulse of the chart.
The bullish intentions have been made clear. Lets see which setups plays out eventually.
Would have been stronger if this close was above the large red candle on left. (off by some 40pips)
Hence this keeps the options of deep retrace very likely.
Especially for next leg up to Bollinger mid.(34 MA) which may meet price at the 10000 by then.
This down move likely to be to
- Retest of trendline break
- Retest of MA's 10
- 30-50% retrace of last 3 bulls weeks
- Test yellow resistance turned support zone.

One of the few Possibilities for coming years - GER30I just realized i had posted this chart as private 2days ago. Wish they have a convert function. :) Hey ho.. here is the progress since then. Still valid.
-----
We don't fully know which of the fundamentals news would be used to drive this up and then down.
However, IF there happens to be such news events, this could be a set of potential price action movement in near future.
This charts is just for reference and will be interesting to see how the market actually moves in coming months and years.
Price action behavior at 10800-11000 will eventually indicate if this full set of move will occur in this fashion.
Though a possibility,At the moment, it would be too early to project the third push with a degree of certainty.
Update status

DAX longSL 8600
since it is aggressive counter trend, I will quickly take partial profit after 1R is reached and tighten SL to BE

A GENERATIONAL TOP IN THE MAKING In my last chart around 2 years ago entitled "SP500 BEARISH OUTLOOK - CLOSE TO FORMING GENERATIONAL TOP" (see link below), I suggested that a possible top could occur around 2000 - 2030 area which I believe is still within acceptable range for such long term analysis.
It appears to me that the likely topping pattern we are witnessing could be part of a very significant top formation, to qualify as "generational top". Based on the my interpretation of Elliottwave Principle, the cycle that began back in 1929, probably formed a major top of wave 3 in 2000, and all the intervening price action since 2000 till August 2011 low could be contracting triangle wave 4.
If this is correct, then we might have just seen wave 5 top on 19th May 2015 high. The choppy price action could just be an early development of major bearish cycle that could last several years with possible downside target retesting the 2009 low. Should this scenario play out then it could be very devastating and at the sometime offer us opportunities to benefit, if provided we are fully prepared to take advantage.
Summary:
1. Potential Rising wedge (ending diagonal) close to breaking down.
2. Have several Fib confluence,
3. Momentum divergence at several degrees.
4. May 2015 top lines up with time symmetry (see chart below).
5. Several sectors started topping from mid 2014 with the main Index grinding higher due to strength in ever reducing number of strong stock making up the S&P500
Conclusion:
If you wish to learn why I have come this conclusion then and what can assist you in getting fully prepared please register for a free webinar I am hosting on Saturday at the link - www.danv-charting.com
Warning: This is my interpretation of price action using TA approach that I consider helps me the most but could be completely wrong. Therefore as always, do your own analysis for your trade requirement and ignore my views.
For those who appreciates my analysis, select to follow me and the chart for notification of future updates. Indicate you like my analysis by thumbs up, comments and sharing it with others. If you have an alternative idea then please be constructive and share for all to learn from.
Thank you for taking the time to read my analysis.
DanV
danv-charting.com

RED Support vs GREEN resistanceIMO that RED line should hold for another attempt to penetrate the GREEN channel.
Its a minimum requirement for ongoing bullish trend and for penetration.


DAX - impulsive decline, picture looks increasingly bearishIt's been a while since I updated the long term count.
My intermediate bearish view was confirmed in the mean time with DAX putting in a spike above the previously indicated magenta TL from the ATH, however quickly losing momentum and failing also to keep above the 200d MA. The decline from ATH was very choppy, with waves which were difficult to count, so there is a possibility that this big wave is all just a corrective wave 4 in the form of a double 3 (see the blue count - A-B-C, then the red A-B-C up, and now could be just another bigger A-B-C down). The other option is the more bearish one in which we have a nested wave down (a series of 1-2 waves, with the current wave being either a 3 or yet another serie of 1-2).
However, regardless of the bigger term picture, what is more worrying for longs is the fact that the decline off the 30th of November lower high developed into 5 waves and took out the September low, therefore cancelling the more bullish counts which were based on the red C wave being a 5 waver and actually not a C wave but a 1 or a wave part of a bullish move. This means that the next bounce (which could be quite big) will most likely be a corrective wave only, so an A-B-C, which would be a nice short opp, since the following decline will take out the lows at which we will bottom these days (or maybe weeks).
On the more immediate term, it's difficult to say where we will bottom. We have already 5 waves in place, but the 5th could always extend. In any case I would use the next bounce as a short opp, rather than try to buy it.
What is most interesting is that the LT projection from mcm, nailed a very important intermediate top - the high of the red 2 from Dec 30th.
mcm-ct.com
For questions about the analysis feel free to visit the site or contact me via email at alex@mcm-ct.com.
GL to your trades!

