GBPJPY SHORT DAILY FORECAST Q3 D4 W27 Y25GBPJPY SHORT DAILY FORECAST Q3 D4 W27 Y25
Professional Risk Managers👋
Welcome back to another FRGNT chart update📈
Diving into some Forex setups using predominantly higher time frame order blocks alongside confirmation breaks of structure.
Let’s see what price action is telling us today! 👀
💡Here are some trade confluences📝
✅Daily Order block identified
✅4H Order Block identified
✅1H Order Block identified
🔑 Remember, to participate in trading comes always with a degree of risk, therefore as professional risk managers it remains vital that we stick to our risk management plan as well as our trading strategies.
📈The rest, we leave to the balance of probabilities.
💡Fail to plan. Plan to fail.
🏆It has always been that simple.
❤️Good luck with your trading journey, I shall see you at the very top.
🎯Trade consistent, FRGNT X
Gjshort

GBPJPY SHORT DAILY FORECAST Q3 D1 W27 Y25GBPJPY SHORT DAILY FORECAST Q3 D1 W27 Y25
Professional Risk Managers👋
Welcome back to another FRGNT chart update📈
Diving into some Forex setups using predominantly higher time frame order blocks alongside confirmation breaks of structure.
Let’s see what price action is telling us today! 👀
💡Here are some trade confluences📝
✅Daily Order block identified
✅4H Order Block identified
✅1H Order Block identified
🔑 Remember, to participate in trading comes always with a degree of risk, therefore as professional risk managers it remains vital that we stick to our risk management plan as well as our trading strategies.
📈The rest, we leave to the balance of probabilities.
💡Fail to plan. Plan to fail.
🏆It has always been that simple.
❤️Good luck with your trading journey, I shall see you at the very top.
🎯Trade consistent, FRGNT X

GJ sugar high VS reevesThe sugar high will wear off as the risk on geo tension premium evaporates & the fiscal liability hits from Reeves' autumn budget, it's a 1 to 5 reward and I'm betting the farm, or in my case the seedling! happy hunting

GBPJPY SHORT FORECAST Q2 W25 D16 Y25GBPJPY SHORT FORECAST Q2 W25 D16 Y25
Professional Risk Managers👋
Welcome back to another FRGNT chart update📈
Diving into some Forex setups using predominantly higher time frame order blocks alongside confirmation breaks of structure.
Let’s see what price action is telling us today!
💡Here are some trade confluences📝
✅Daily order block
✅15' order block
✅Intraday breaks of structure
✅Daily high rejection
🔑 Remember, to participate in trading comes always with a degree of risk, therefore as professional risk managers it remains vital that we stick to our risk management plan as well as our trading strategies.
📈The rest, we leave to the balance of probabilities.
💡Fail to plan. Plan to fail.
🏆It has always been that simple.
❤️Good luck with your trading journey, I shall see you at the very top.
🎯Trade consistent, FRGNT X

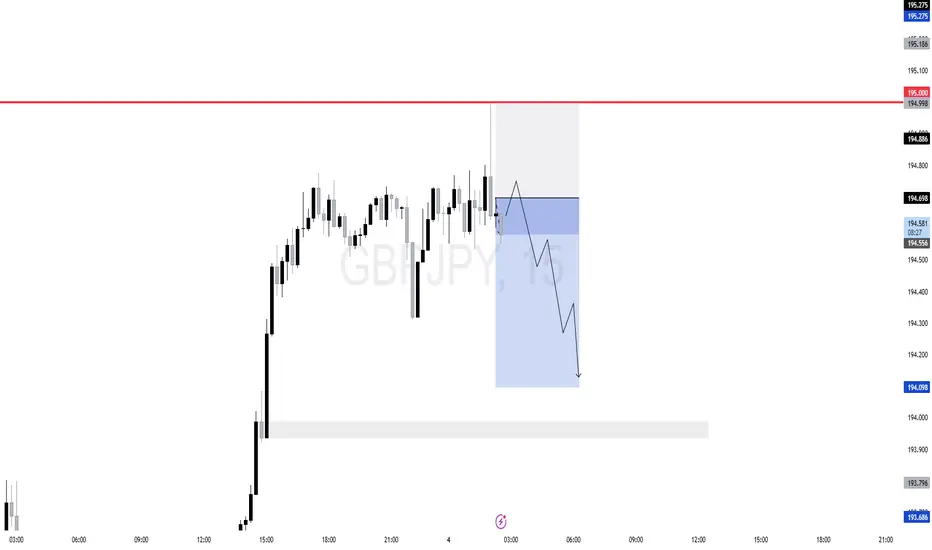
GBPJPY 15-min chart setup✅ What I Like:
Liquidity Sweep at 195.000: Price ran buy-side liquidity above a clear psychological level and showed signs of rejection — classic manipulation.
FVG + Premium Retracement: The short setup aligns with an entry around the 0.618–0.75 retracement zone of the recent leg up, which is also inside a fair value gap.
Timing
🔻 Concerns:
Momentum: The bullish impulse leading to 195.000 was strong. If no displacement confirms the move down, price may consolidate or go higher.
No Strong Break of Structure Yet: To validate full bearish intent, I'd prefer to see a solid break below a recent short-term low (market structure shift).
GBPJPY SELL im looking on selling GBPJPY in a short term price has been trading down for week now in this coming week we should be waiting for this sell to play out...

GBPJPY, possible outcomes?A quick outlook on GBPJPY . Potential opportunities.
GBPJPY is currently trading at around 191.000 . We are looking at two possible outcomes on this pair. We are still in a downtrend on HTF (Higher Time Frames ). However if we start breaking above 191.500 we could see a reverse happening on the pair.
Scenario 1: SELLS at the break of 190.400 .
We broke 190.400. That would confirm sells and we could continue the downtrend and target previous lows sitting at around 188.000 flat.
Scenario 2: BUYS at the break of 191.500 .
We broke above 191.500 confirming the bullish flag we had on H1 and we could start reversing on GBPJPY . We would be targeting higher levels sitting at 192.500 and higher at 193.300 .
Personal opition:
The direction for now is unclear until we break our mentioned key levels. A safe sell trade could be taken at the break of 190.400. On the other hand a safe buy trade could be taken at the break of 191.500. We are more on the buy side at the time of writing this. Be patient and stay tuned for updates on this pair.
KEY NOTES
- GBPJPY is in a downtrend on HTF however it’s showing signs of a possible reverse.
- Breaks above 191.500 would confirm buys.
- Breaks below 190.400 would confirm the trend continuation and further sells.
Happy trading!
FxPocket

GJ Still Looks BearishWe're looking to SELL again after the correction...
- Still creating LLs and HLs
- Broke and closed below daily TL
- Trading below major QP 190
Possible entry around 190.2-190.5 but only if you see some bearish price action at these levels
Conservative entry would be a break below 189.5
Stop Loss above 190.5
TP1 188.75
TP2 187.5
TP3 185
I will update if trade becomes active...

Sell IdeaA probable choice for sell if breaks the limit below with the intention of taking 1:1 and leave runners for more profit.

GJ Sells;Looking at taking sells on GJ pending order set and allowed to play out.
Now, I wait to see the outcome of this setup.
See you, later.

GBPJPY ANALYSIS [W/B 10/06/24]GJ has been interesting to me the last few weeks. It has a dilemma that it is going through.
As seen within the POI, there is plenty of imbalance which could force price downwards, with confluences such as structural breakdown and imbalances left over downwards in the demand area - however price has - within the last significant periods - been trading upwards.
I agree that if the upper zone of this POI is broken - we could well see a very lengthy and strong bullish run - especially as on the weekly chart there was a lot of imbalance left over.
If we see structural breakdown to the downside I am expecting any of the drawn out TP's to be taken.

GBPJPY Analysis (18th April 2024)
Market Analysis PT1/2 (18th April 2024)
GBPJPY Analysis
On the 4 Hour timeframe, price action has created a WCR.
This is a vaild WCR as it meets all 3 criterias of:
- Range on the 1hr/4hr/Daily timeframe
- Range is at least 100-150 Pips wide
- More than 2 taps on Each Support/Resistance.
Looking at the 1 hour timeframe, price action has created a 1 hour Change of Character after failling to break past resistance level. What i am personally looking for is for price to sell reject of either the gold fib level from the swing high to the swing low, or come up alittle higher to retest the 1 Hour Orderblock before looking for sells.
Once one of these 2 areas of interest has been tapped, i will be looking for 5 minute/ 15 minute Change of Character before looking to sell all the way down to the support.

GBPJPY Analysis (16th April 2024)
Market Analysis PT2/2 (16th April 2024)
GBPJPY Analysis
On the 1 hour timeframe, price action created a bearish Change of Character after rejecting off a psychological level at 192.700.
In the process of forming a 1 hour CHOCH, price also created as 15 minute orderblock that hasnt been tested.
I am expecting price to retrace towards the 15 minute unmitigated orderblock before looking for potential sell confirmations during the london session.
Do keep a lookout for this potential set up!

GBPJPY Analysis (11th April 2024)
Market Analysis PT2/2 (11th April 2024)
GBPJPY Analysis
On the 4 hour timeframe, price action rejected off the 4 hour Orderblock and created another bearish Change of character, This shifts my bias from bullish to bearish on the 4 hour.
In the process, a 4 hour Fair Value Gap has been formed and if you drop to the 1 hour timeframe it also overlaps with a 1 hour Fair value gap. This will be a high probability area for me to look for potential SELLS from.
Ideally i want to see price tap into the 4 hour FVG and create a 5/15 minute Change of Character before looking for sell on GJ.

GBP/JPY SellGJ has broke below structure and closed below zone on 4H timeframe. Also formed a Head n Shoulders and closed below the neck line. Zooming on the 1h we can also see structure broken to the downside and closed below zone. Price retraced and shown rejection @ 190.600 zone by forming a Doji.
Having seen price rejecting zone I zoomed into the 30mins and 5 mins where I was looking for a Break of structure to the downside and a retest which happened at 12.30pm Uk time also pre-NY.
Seeing this added confluence of BOS on 5mins I entered sells @ 190.57 with sl@190.900 (Risking 33pips).
TP1. 190.00. TP2: 189.85 TP3:189.700 TP4:189.55
* Where has the market moved since I entered my trade? Slight profits
* If I looked at the market now, would I take the same trade? Yes
* How do I feel about my trade? Optimistic and confident
* What do I like about this trade ? multiple confirmations
* What do I dis-like about this trade now? took bit of time before showing volume
* On a scale of 1 to 10, where would I rate this Trade now? 8/10
* If I were not in a trade now, would I take the opposite trade ?no

GJ stil short RSI divergence W chartGJ might have took out the 30M entry and also on 1D charts looking sketchy but on the W chart the RSI is posting divergence when u look at the 23 Jan 24 equal highs to today
im looking for a reversal of the 1D candle within 2-3 lengths to validate the W short.

GJ major sell possibilityGoing over the current market structure it has rejected the continuation of the uptrend 5 times in my marked up zone.. that being said I think we might be in for a major move down.
I have marked my entry below the lows of the liquidity areas and my stops halfway up the highs to minimize risk but still allowing the market to grab liquidity before moving bearish.
*Other scenario would be if the market passes my marked zone we could be in for a continuation of an uptrend*

GBPJPY : The FREEFALL gbpjpy has been ranging all week the pair is preparing for a major move likely to the down side
the last few daily candles are rejecting the sell zone that i indicated in my previous analysis please check it out below .

GBPJPY POSSIBLE FALL ?hi traders ,
since the summer gbpjpy has been trading inside a channel on the daily tf .
we can see the price approaching the sell area where we have a resistance + bearish trendline it is very likely that we see a bearish move from there id wait for extra confirmation.
right now the only comfirmation we have is the close of friday candle that closed as a bearish spinning top and the rsi that is indicating a bearish divergence and weakening of price.
trade safe homies!

GBP/JPY sell signal analysisHello traders, Last week we saw a nice bullish momentum on GJ which took the price to IRL which is a weekly FVG I'm expecting to dig little bit into the fvg to than sell off from there but I'm only considring the entry after a shift on market structure to take an advantage of the down move targetting 178.353 which is the ERL .

Possible Shorts for GJObserving a bearish trend confirmed with lower highs and lower Lows on the 4H timeframe. GJ is currently respecting my 4H bearish Trendline in confluence with a 1H Lower High area (Keylevel ).
The market has already given us a strong bearish candlestick on the 15-30 minute timeframe. I’m awaiting a break and retest of the 1H key level (support) then I can look for possible entries

GBPJPY WEAKNING OF BUYERS AND POSSIBLE REVERSALHello traders it looks to me that we might see a bearish reversal of GBPJPY it looks to me that the buyers are getting weak as i showed in the rsi but also the bearish retracements are getting stronger and stronger. if we break bellow that yellow zone the bearish reversal is confirmed !

GbpJpy -> Short Squeeze Over?Hello Traders and Investors ,
my name is Philip and today I will provide a free and educational multi-timeframe technical analysis of GbpJpy 💪
After GbpJpy broke out of a major long term monthly triangle formation all the way back in 2021 there has been a major rally of roughly 4000 pips towards the upside on GbpJpy.
However by looking at the weekly timeframe you can see that GbpJpy is a little bit overextended at the moment so I do expect a retracement at least back to the 0.236 or 0.382 fibonacci retracement level.
And it seems like with today's candle GbpJpy is breaking daily structure towards the downside so I am first waiting for another bearish push and if we then get a retest of the previous structure zone and some bearish confirmation I then do expect another daily bearish drop to retest the weekly fibonacci levels.
Keep in mind: Don't get caught up in short term moves and always look at the long term picture; building wealth is a marathon and not a quick sprint 📈
Thank you for watching and I will see you tomorrow!
My previous analysis of this asset:
