XAUUSD - Gold a textbook bullish cup and handleXAUUSD - Gold a textbook bullish cup and handle.
Does not get any more compelling, short of cup handle breakout and successful back test.
Break out target USD $3,000.
GLD

The Gold Odyssey - a different story emergesPreviously, since Donald Trump started the US-China trade war, Gold has been on a clear trend forming a Cup & Handle pattern in the weekly chart. This was covered in earlier posts with decent accuracy, until recently. It appears that the Gold volatility is significantly heightened, to the extent that the the Handle may have been broken.
The weekly Gold chart shows many recent support failures, especially since April 2022. The past week appears to have failed breaking above the weekly 55EMA, and clocked a long bearish marubozu-like bearish candle that closed below the support range. Although the technical indicators are still looking somewhat less bearish, the weeks to come look bad for Gold really.
The daily chart shows similar patterns of breakdown, with a resistance failure, from a lower high that came from a Bearish Engulfing pattern. This followed through for the week where the 55EMA was again broken down. Technical indicators appear bearish too, especially with the MACD crossing under zero.
Gold is not going to do well for a while, so listen to what the charts are saying... very clear bearish message.
Look for 1700.

SHORT GOLD TO 1680 near termRising rates - Cooling CPI - Slowing Economy -- No Runaway Demand.
MACD Crossover and retraced into the moving averages
Near term Target of 1680-1700
I will be using Put Options on the EFT GLD

GORO - GLD UP HOMIEReclaim of trendline = MEGA HOT
Gold Futures = MEGA HOT
Inflation round two inevitable and Biden's "month on month 0 inflation" LOL.
New outlets painting a picture of "maybe inflation really is transitory" MEGALOL
Let's see how that lasts once we get into winter. Side note: Check out the US oil reserves over the past number of years to now... Yiiiiiikes
Break of green on nice volume has me in. Risk to the bottom of the yellow range and build position over pink. Would be nice to see price not go below either pink or purple for max strength but we will see next week. Next area Ill build into is a range clear of yellow range like blue. Break of that = MEGA HOT and risk below pink.
Mega range its been in and if gold keeps pushing its gonna drag with puppy with it it too
Peter Schiff might have been crying for the last 100 years with his hard-on for gold but next year he finally might be able to trick people into thinking he's not a complete moron
No position yet but you know what I'm waiting for.

Watch Crude Oil, IYC, & GOLD. The Markets Entering New PhaseGold, Crude Oil, IYC are about to enter a new phase. Take a look at 2006~2014 as a perfect example of what's next. Got Gold?
This is going to be an epic run if you know what to expect.

Gold & Silver Reaching A Launchpad with Currencies (like 2003)Many traders believe the current setup in Gold/Silver is similar to 2018 or 2015. But the reality is this is more similar to 1999~2003 with a strong US Dollar and weakening global currencies.
As long as Gold/Silver continue to strengthen while the US Dollar stays strong, foreign currencies will weaken and wreak havoc on foreign markets.
Eventually, the risk levels will increase in foreign markets which will send FEAR skyrocketing. That will move capital into Gold/Silver and break the channel/trends that are currently in place.
I believe we are very close (possibly 2 to 4+ months away) from that breaking point.
Watch global Emerging Markets and foreign governments for signs of collapse. These will be the early warning signs that Gold/Silver are "T-minus 10".
Once the US Dollar peaks/turns, we'll be at "T-minus 3".
At that point, everything will be ALL SYSTEMS GO for Gold & Silver.
Pay attention. This is a huge setup for precious metals.

Gold - Choppy moves continueOver the recent months, we reiterated that gold was likely to be dragged down by the declining stock market (mainly due to profit-taking/covering losses elsewhere). We also expressed our expectations about gold declining to the 1700 USD region; this move came recently, and XAUUSD made a new low at 1 690.935 USD.
Despite that, we stuck to our long-term bullish stance, which we continue to hold. Indeed, we think the weakness in gold can be exploited by accumulating gold for the long-term position. In our opinion, the inflation rate in the U.S. is currently peaking (and due to move lower in 2023). In addition to that, we think the FED will eventually reverse its monetary course and loosen economic conditions.
Although, we are very cautious as the FED meeting is approaching; furthermore, if the central bank follows through with another rate hike, then it is likely to be negative for gold in the short term. Additionally, if the stock market reverses its rally, it will likely harm XAUUSD.
Illustration 1.01
The price of gold deviated too far from its short-term and medium-term moving averages. Therefore, we are on the lookout for the price retracement toward its 20-day SMA.
Technical analysis - daily time frame
The RSI is bullish. The Stochastic points to the upside, which is bullish; however, it stays in the lower zone. The MACD strives to reverse. DM+ and DM- are bearish. Overall, the daily time frame starts to show bullish signs. It also hints at the possible peak of short-term bearish conditions.
Illustration 1.02
The chart shows simple support and resistance lines derived from peaks and troughs.
Technical analysis - weekly time frame
RSI, MACD, Stochastic, DM+, and DM- are all bearish. The weekly time frame remains bearish.
Please feel free to express your ideas and thoughts in the comment section.
DISCLAIMER: This analysis is not intended to encourage any buying or selling of any particular securities. Furthermore, it should not be a basis for taking any trade action by an individual investor. Therefore, your own due diligence is highly advised before entering a trade.

Gold bounce from demand level at AVWAPGold bounce from demand level at AVWAP 1700.
Next target 1800.

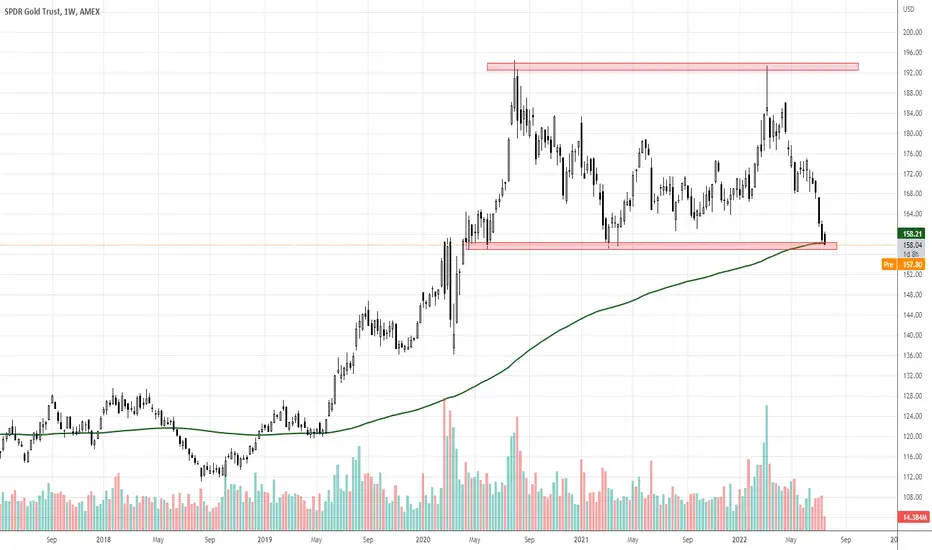
#GLD approached massive horizontal support zoneGLD ETF has reached a significant horizontal support level which has been in play for over 2 years now. Will we get another bounce off this level? Also interesting that this support is intersecting at the weekly 200ema. Not a bad risk reward to try play a reversal off this significant support as your risk can be quite limited
The Gold Odyssey - GGTwo weeks ago, the Gold Odyssey hit a snag, and after two weeks, it really broke pattern. Currently at a support, which should hold for a bit, it appears that Gold is sliding down further eventually over the next weeks, probably after a bounce at the support level.
Heads up!

Silver Threads and Golden NeedlesWe should have support near 1650 area as that has been heavy support since early 2020. Expecting a bounce back up close to 1800. Hi Ho Silver should outperform to the upside. Good luck!

$IAU - Short GoldThis is a really simple trade. Here is a weekly candle chart showing nothing but weakness. Gold failed to breakout on any time frame. Now, it is threatening two plus year support.
If the support breaks, and only if it breaks, take the short side of the ledger. Ticker: $IAU iShares Gold Trust.

Gold weekly chart broke down and headed lower.Gold weekly...The huge bull pennant has been
broken now...it seems it will head down to the
red consolidation box and the RSI should reset
and begin to make the next move up. The MACD
is still not bottoming out either. Price targets
and support lines are still intact.

GLD at 200 Daily MA.Sitting on the 200 MA.
Solid support at 169.
Resistance at 173.5
Resistance at 174.5 over that is a breakout with 176 confirmation.
DYOD
I am long 1 share to watch it. Just a quick chart for that.
See GOLD CFD chart below
www_tradingview_com/x/fuGky4qE/

Gold Miners ETF, GDX bullish potentialThe weekly chart closed the week nice candle that had a long bottom tail, albeit a red candle, but bullish indication here.
The daily chart had GDX gap down on Friday's opening, then rally hard to close a bullish engulfing, spanning across a resistance zone. This can form the higher low point later next week.
Indicators are not yet bullish, but candlesticks are suggesting the end of the massive retracement with bullish signs and patterns.

The Gold Odyssey - time to flyA quick note to say that as previously expected, the deep retrace happened, and had bottomed out. The last week closed with a bullish candle with a 5 week high close, that bounced off support from the weekly 55EMA, and broke out of the trendline resistance. Technical indicators have yet to turn around.
The daily chart shows Friday's surprise surge in Gold prices, closing on the recent weeks high. Thing is that the technicals are not yet very supportive of a rally, although there already are optimistic indications.
Gold is going up!

GOLD XAUUSD - Elliot Wave Monthly - Entry and Exit Points - paxgGOLD XAUUSD - Elliot Wave Monthly
This trending channel can help anybody to take long term entry and exit

Gold Ready for Multi-year Bull MarketGold has been waiting in the wings while equities, commodities, and more speculative assets like crypto aggressively took off following the COVID-19 shakeout. Metals, on the other hand, saw very little growth. However, given the market conditions surrounding inflation and a hyper-inflated equities market, housing market, and commodities market, there is a LOT of capital on the table waiting to rotate. As the dollar surges in strength vs other major world currencies (see ticker $DXY for reference) bloated that saw incredibly large returns over 2019-2021 are now seeing bleeding declines. The strength of the dollar is enticing and I expect to see continued profit taking from equities, crypto, and commodities.
The real trick is understanding where the money will likely flow to once all the profit taking has concluded. One asset class that I believe will do very well over the next 5-10 years is metals -- specifically Gold.
Gold appears to be wrapping up a consolidation pattern known as a "cup and handle" . The projected price target of a Cup and Handle is calculated by measuring the distance from the bot tom of the cup to the top of the cup . Take that measured distance and project it to the breakout level and you'll have your target: . This target doesn't necessarily mean the trend would conclude there, but it would be an initial price target and likely be a point where the market will for some sort of consolidation structure.
When we look at the trend metrics like Bollinger Bands and Ichimoku Cloud analysis, gold displays all of the characteristics we would associate with the beginnings of a bullish continuation of the trend.
Bollinger Bands : If you're new to Bollinger Bands (bbands), you can think of them as a tool that measures and forecasts volatility of a market. The more constricted the bands are, the more the consolidated the market is, and the more spring-loaded the market is. If we have a highly consolidated market, we can think of this as a coiled, compressed spring that is ready to release all of the stored energy . At the moment, Gold is showing a very very consolidated market and is trending very nicely above it's bbands midline: . As an objective metric, markets that are trending above the bbands midline are said to be in a "bullish trend" and markets that are trending below the bbands midline are said to be in a "bearish trend". For Gold, it is decisively a bullish trend.
Ichimoku Cloud : Ichimoku Cloud can look very complicated, but when you know what you're looking at, it can actually be a very simple and useful tool to gage the strength or weakness of a trend. Without going terribly in-depth, my gold standard (pun intended) for a highly bullish trend is seeing:
1. The price is trending above both the fast and slow moving average
2. The price is trending above the cloud
3. The lagging moving average (the yellow squiggle) is above the price
4. The cloud is green
For my trend system, i add additional criteria using the 50 and 200 EMA (exponential moving average):
1. Price should be above both the 50/200 EMA
2. 50 EMA should be trending upwards above an upward trending 200 EMA
Long story short -- Ichimoku Cloud is showing a perfect bullish trend for the most part
TLDR: Gold is a slow moving ship and has fallen off of most peoples radar. I think the next 5 years will be a very very strong market and Gold will see upwards of 80-300% growth. Gold tends to be a hedge against economic uncertainty and all of the fundamentals for a massive flight to gold are here

1 of multiple scenarios for the S&PThe S&P closed right under major resistance on friday. This leaves the door open for 1 of multiple scenarios to play out.
1- the market tanks from here and dips below 3800
2- the market dips, hold a higher low then breaks thru resistance to 4321, then 4400
3- the market melts up to the top of the channel at 4400

The Gold Odyssey - retracement done AS previously described, Gold was in a deep retracement, and it appears that this week, the retracement is done.
Weekly chart shows a reversal candlestick pattern over the past three weeks, finding the week's close at a resistance level. Look for a breakout in the coming weeks, as Gold closed above the weekly 55EMA this past week.
Do note that previous mapping of the handle (Cup & Handle formation) it shifted forward; and 2080 high is expected to be broken around November 2022.
The daily chart show a higher low, and technicals are turning bullish. The retracement was nicely above 1800, and has a potential 20% upside to 2080. Possible for consolidation to near 1800-1820, and would be looking for clarity in the coming weeks.
Meanwhile, would be good for the USD to ease off a little. hehe.
Stay safe and well...

Gold - "No reason to get excited" the thief, he kindly spokeTesting trendline, expecting rejection here. Target around 1600

Gold is about fix the current monetary system IMOThis is speaking from history and of course nobody knows what exactly is going to happen. I like gold and gold miners at these levels as they are the most undervalue assets right now.

XAUUSD - Gold Bullish Cup & handle formation (Target US$3000/Oz)XAUUSD - Gold Bullish Cup & handle formation.
Breakout target is US$3,000/Oz.
