GLD, GDX, USD & YieldsThe sentiment across the forex community is that the weakening US dollar pushes the prices of precious and base metals higher.
From this chart, it can be seen that US 10 year yields are actually the inverse in price action to the Gold Metals ETF/Miners ETF or Gold CFD.
With the US dollar more of a proxy for volatility.
GLD

Inflation is coming... Perfect buying opportunity for GOLDYall should've listened to Burry when you had the chance...it aint too late though!
Markets dumping, Interest rates rising, bond yields climbing... you can only keep printing money for so long
Makes sense why we have been seeing a steady rise in Gold prices the last few months! Luckily, in our favor, Gold bounced cleanly off the long term trend line support, as I charted, it also seems like it has made a massive bull flag on the weekly/daily.
For anyone confused, how I obtain a price target on a bull or bear flag is you would just take the vertical distance between the "flag-pole", then apply this distance starting from the previous high. Your first target is located at the end of this distance.
Coincidently, if we use the Fibs, our target would take us straight to the 2.618 at $2700!
Now is certainly a great time to invest in some gold...keep an eye these next couple months!

Gold Cup & Handle BreakoutAfter an 8-month downtrend, it appears Gold has made a bottom, forming a cup & handle; and today it made a breakout.
Next target is the 200sma which lines up with the downtrend. I would expect some consolidation or a pullback to $1770.

Gold Cup&handle (most likely aggressive bull) Beautiful cup and handle formation on gold today. if 1800 broken, possibly explosive rally to upside

$GLD MASSIVE Weekly Cup and HandleStarting in September of 2011 and the handle starting here on Aug 2020.
selling volume has declined and got a strong bounce off the 158.85 mark and look to be heading up for our third tap or our handle downtrend
When a bullish move occurs the moving averages respond, and the 9MA (white line) on the weekly has curled up nicely with a implied EMA cross over the 50 and 20 EMA (Purple and blue lines)
With metals roaring $GLD has seen some love here in the last few weeks, but as it approaches resistance we have to evaluate volume, and if investors are going to be putting money back in to Gold as market fears increase. More updates coming soon. Video update tomorrow.


GLD - Gold Long term Trade TechnicalsWith Dollar gaining some momentum upside, GLD should follow the uptrend from short term. Find the trading zones defined for trades, each parallel zone has it's upper line as resistance and down line as support. Follow the trend, buy/sell once the resitance/support trend is broken.
Good luck trading!

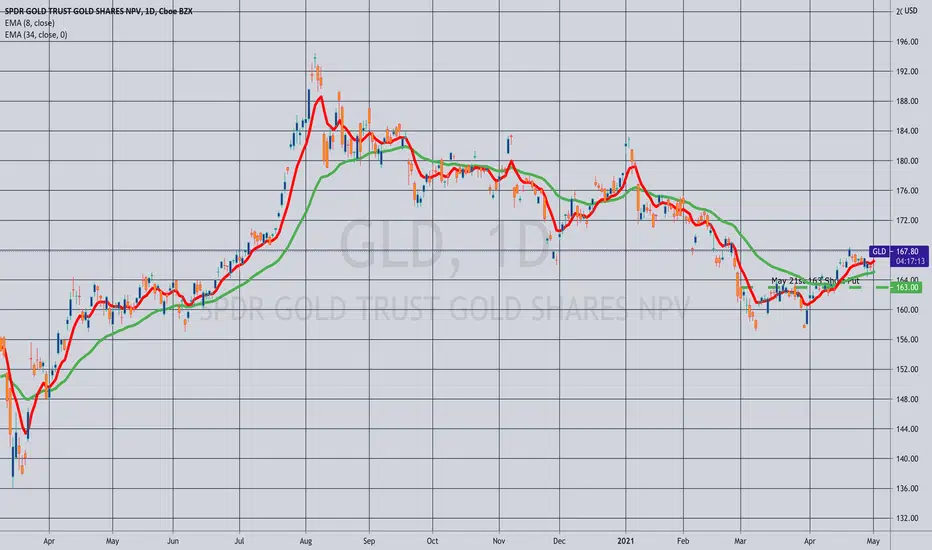
Closing (IRA): GLD May 21st 163 Short Puts... for a .48/contract debit.
Notes: Decided to take profit here on this little up move, rather than hang out in the trade another 18 days, particularly since I collected a total of 3.97 in credits and rolled down and out on strike test. (See Post Below). 3.97 - .48 = 3.49 ($349) profit/contract. Will consider re-upping on a dip back to the 157 level (March 8th, March 30th lows).
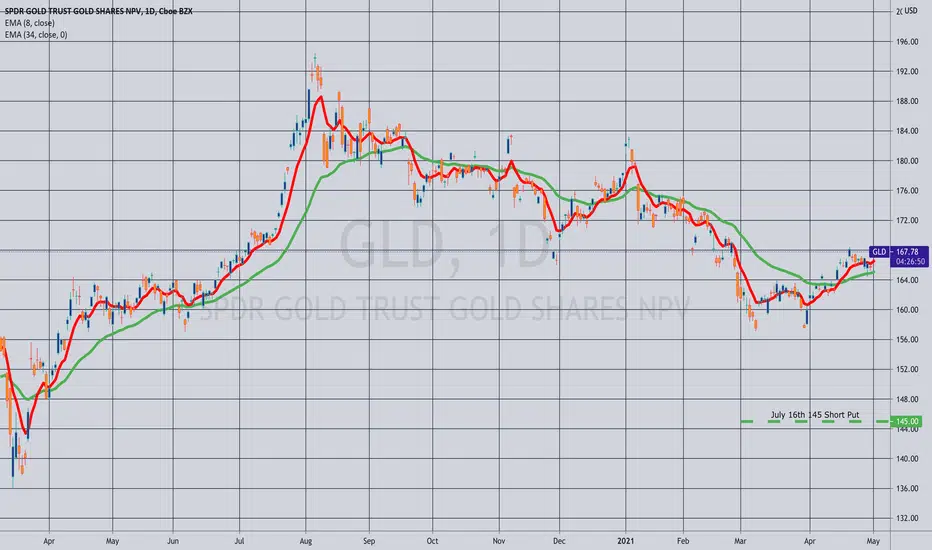
Closing (IRA): GLD July 16th 145 Short Put... for a .26/contract debit.
Notes: In for 1.38/contract (See Post Below); out for .26 here; 1.12 ($112)/contract credit with 74 days to go. No sense in waiting another two months for the remaining $26 to come in.
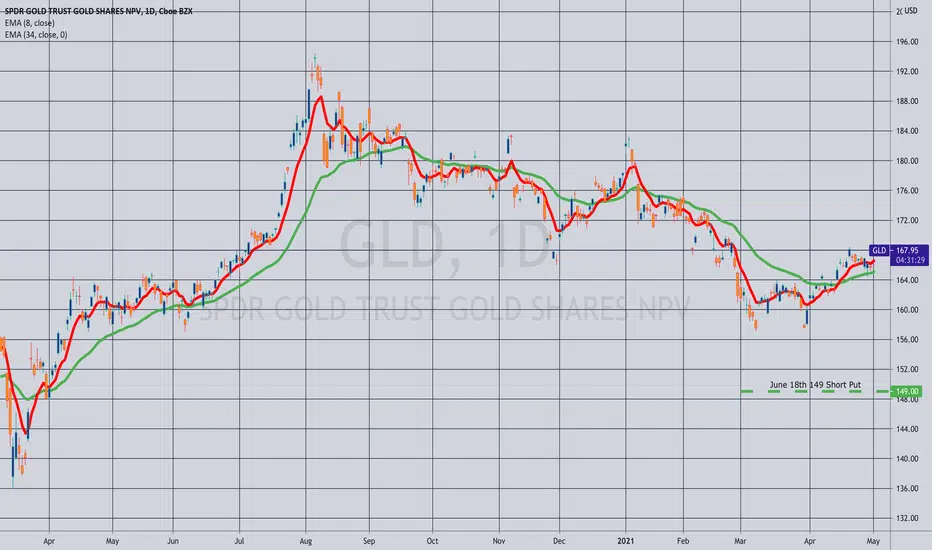
Closing (IRA): GLD June 18th 149 Short Put... for a .20/contract debit.
Notes: In for a 1.88/contract credit (See Post Below), out for .20 here. 1.68 ($168) profit/contract with 49 days to go. No sense in hanging out another 49 days for $20 relative to the BP this is tying up.
Gold Weakly ChartJust an update about Gold... I am kinda mixed about Gold at the moment.
It looked as if there were legs for a good launch, and yet it did not. Stopped short at the channel resistance only to look a bit weak, closing below the weekly 55EMA with the last two candlestick suggesting a retracement off the resistance.
At least the RPM and MACD is a little supportive for a pending breakout.
What is also interesting is that the Largest 8 Traders (bottom panel, yellow line) appear to be buying up Gold in the last couple of weeks.
On another note, the USD recently started running up. Continued bullishness in the USD would put some pressure on this Gold breakout, tipping towards a retracement.
To break out or to break down?
Only time will tell...

Closing (IRA): GLD May 21st 155 Short Put... for a .17/contract debit.
Notes: Pre-vacation profit-taking/cleanup. In for 1.62/contract (See Post Below), out for .17 here; 1.45 ($145) profit/contract. Will re-up if we get weakness back to 155 or below. Still have May 163's, June 149's, and July 145's.

#ANG close to it's last line of defense JPow didn't do Gold any favours last night, and a strengthening ZAR/$ isn't helping. ANG is close to it's last line of defense @R290 ... below R290 there's nothing but air holding ANG up above R267, and in the distance beyond that R230. Could go any way from here - next R30 seems 50/50 either up to R320 or down to R260, but it's looking weak hiding under all JSE:ANG its averages. Which way are you positioned from here? JSE:ANG

EURUSDEURUSD has been on an uptrend for the past week and all we're trying to do here is wait for more confirmation like engulfing candlestick before buying.

The Plan Ahead: GLD Levels/Strategic Acquisition Via Short PutGenerally speaking, I'm a premium seller, taking advantage of high implied volatility to sell options to take a position in an underlying without actually getting into shares of stock. GLD, however, isn't particularly known for its volatility and therefore isn't the greatest standalone premium selling play. As of the writing of this post, 30-day implied is at 15.6%, which isn't exactly something to write home about. Consequently, while I am selling premium in GLD, I consider what I'm doing as more in the nature of a directional shot on weakness as a opposed to a pure "tons of room to be wrong" premium selling play and because of this, actually look at a GLD chart from time to time to consider whether given weakness is weakness I'm looking for and whether selling a put at a given strike "lines up" with given price action and is in an area in which I'd be comfortable with acquiring shares.
Pictured here is my full GLD ladder, with puts sold or rolled at various points in time. As is apparent from price action, I may have gotten a bit too aggressive with the 163, but was a little more thoughtful with the other rungs where I sold on weakness back to ~155, which is apparent support/resistance running back to June of 2020 and even got some longer dated contracts on where the 20 delta was coincident with lower support resistance in the vicinity of 147.
So, in a nutshell, here's the plan ahead:
a) Obviously, I'm going to have to manage the 163's. I don't like the level particularly as an acquisitional price point, since it's now apparent that the market will give me opportunities for cheaper, if not at 155, then even farther below at 147. Consequently, I'll look to roll the 163's down a smidge and out in time in the event that price doesn't stick above that level running into the May 21st expiry. Although my mindset is to generally talk myself into being "fine" with acquiring shares at the price point any given short point represents, I regularly revisit whether I have changed my mind given what has occurred since I got filled, and here, well, I'd rather be in shares at a lower price. As a result, I'm going to stay in the options for the time being, which I can kind of massage and manipulate via roll -- something I can't do if I get into stock, where my cost basis reduction technique is limited to selling call against.
b) On weakness back to 155, sell puts. Where? Well, I generally like room to be wrong, so it's likely to be ~20 delta, 45 days until expiry or greater. Those puts will be clear of the 155 and -- ideally, clear of that lower support/resistance at ~147, but we'll have to see when and if we get there where a 20 delta strike in the next expiry or expiries 45 days or greater line up.
For those without the buying power to go full on naked, consider spreading with the short put leg at the 20. For example, the June 18th 154/159 short put vertical with the short leg at the 20 delta was paying .57 ($57) as of Friday close on buying power of 4.42, a 13.1% ROC at max. Not that I'm going to do that here (again, waiting for 155), but pricing out the spread gives me an idea as to where I'll have to set up my tent in the event I want to get at least 10% out of the spread, and that's with at least a ~20 delta short leg.


GOLD NEXT WEEK #16Forecast:
The bullish counter trend Zig Zag pattern might finalize the C-wave this week and reverse to the downside. If it is only a narrow correction or beginning of a new bearish down trend, I can't say, yet.
The fib, extension levels 1,27, 141 have been taken out. If bulls have the upper hand they might push price action to 1,618 @ ~1805 before price action reverses. I'll keep you updated. Trade safe, be well...
About Gold Next Week #
A weekly 3-10-minute forecast video on Gold's price action on a weekly basis. I'll follow up with charts throughout the week as price action develops patterns and pivot reversals points.
Topics: Market sentiment, Gold Shares / Gold EFT's, $DXY and US10/30yr Bonds and Yields
System: I use a hybrid blend of Wave Principle price action, Fibonacci ratios, RSI indicator and some fundamentals.
Disclaimer: nothing talked about in this video should be regarded or seen as trade advise, a trade call, a recommendation, or a trade signal. Do your own due diligence or seek advice from a licensed professional before entering a trade.
Best Regards
OmarDjurhuus

#GLD $GOLD I TAKE A WALK DOWN MEMORY LANE TO WHEN I WAS YOUNG...MAN. PLAYING WITH #GOLD #MINERS #GDX #NEM #SLW #GG
WE APPEAR TO RENTERING A BULL MARKET FOR YOU LONG SUFFERING GOLD BUGS
PART 1

Long GOLD @ 166 as a trade to hedge the melt UP or correctionsIn a world of billions and billions have been created by digital technology only, without real assets to back it up, Gold seems to be a sensible hedge. Technically it is forming a buyable bottom, with a target of $180.

Who said tha Gold is dead? Possible reversal and uptrendI think $GOLD is bullish and may fit also a narrative, the gold spot value is bullish, hedge against inflation, plus bitcoin, plus hedge against correction in the equity market or volatily.
Price target is difficult since Gold is a slow mover. Let's say 24$.

GOLD RALLY EXPECTEDBrand new inverse head and shoulders pattern forming. We could see a potential breakout to the upside from here.

GOLD sliding in sideways, breakout is coming!Looking at gold chart, you can see the clear accumulation before leg up. Target levels marked on chart. Good luck

Gold looks ripe to launch in April style - yet again!After MONTHS of waiting, consolidating and fake outs, Gold GC1! appears to have what it takes to launch a cenet breakout rally and continue its long term trend UPwards.
Given this at a time when USD 1.9T was dished out, and the next round of trillions in infrastructure spending, it forms the fundamental basis of the technical outlook.
On the Gold weekly chart, we see that price itself maintained well from the 1600 target I set out last year (or earlier)... a bullish indication, which is accentuated by the last 8 weeks of candlestick price action. a higher low and nice long tails encourage a recent higher high to test the 55EMA this coming week.
Then the RPM and MACD appear favourable for that 55EMA test.
Underlying these, we can also see that the Largest 8 Traders (lowest panel) have been increasing their holdings, almost halving the net short positions as prices dip below 1800.
The Daily Gold chart (right) shows the recent higher low action, and the technicals are also aligned for a rally good rally attempt with the MACD is just crossing over into bullish territory as prices break out of an immediate down trend line.
Look out for Gold from this week!
(Co-incidentally, it was two weeks two years ago at the end of April 2019 that I called for a bullish stance on Gold. Seems like it may be seasonal)
