Today gameplan for GC: Bearish pennant, looking to retest demandHi guys, i sharing my gameplan for today trading session on COMEX:GC1!
As you see in my chart COMEX:GC1! formed bearish pennant which was pierced at friday session. Its pulled back at esterday and today overnight session to retest lower line of pennant and today its ready to retest fridays low.
You can trade it for example by inverse ETF: AMEX:DUST
Happy trading!
GLD


GDX continues its original path - DOWN to 30GDX... one of my favouorites, but now is in a major retracement.
Again, three out of four factors are not favourable:
1. USD rising
2. Gold bearish
3. Equities Bearish (or soon to be)
Only Low Interest Rates are favourable.
The weekly chart has a GAP DOWN (ignore the BRB Buy signal for now), and it closed below the weekly 55EMA, which is a significant development.
MACD is crossing down soon in bear territory, and the RPM is pushing down again!
Shifted downside target to 30, mid Feb 2021.

Gold got Double Crossed!Gold continues its slide down, albeit with less momentum.
Technically, we got a double cross down, both in the MACD, and the RP (Relative Price Momentum), both in bearish territory.
Still see more downside.
Retesting 1800, and perhaps finding 1600...
Then maybe I can claim my side bet steak I have with a friend. Ouch.

Has GOLD Caught My Attention? Breakout on the HorizonGold Weekly uptrend is in a current consolidation cycle, hence the up and down movement on the Daily chart with no clear direction as of yet. As we zoom in intraday for multiple time frame analysis, you will see the 2 hour chart(left side) has found support at $1836 and the bands are constricting around the price action. Now with every great consolidation cycle, comes great volatility as we know one thing is true "Volatility is cyclical". So with a bottom in and intraday charts aligning, this intraday breakout IF strong enough, could set the Daily chart up for a strong enough break out, to pour over into the weekly charts to continue the uptrend and breakout of the Weekly chart consolidation Cycle. Gold is on watch, has the potential to move like bitcoin, once the market takes it last breath, this would be a good bottom to establish one self IF it holds. $1900 is the key level to break and hold...All aboard? TVC:GOLD

Gold will continue to be under pressureAfter a 10-year yield breakout higher Gold has set a new lower high only to re-instate its bearish trend since August 2020. Gold has a perfect correlation with TLT, and this relationship rarely fades out. With the breakdown in TLT (150 level), Gold will probably establish a new lower low in the short-term.

Gold (AUD) daily - Hopefully we have hit a bottom.Gold (AUD) daily - Hopefully we have hit a bottom.
Bullish divergent RSIs.

Gold snooked many... Previously mentioned that Gold was in a downtrend... and despite a December rally that started a lot of Gold-to-the-sky talk, I had doubts and hence, no update post as I was patiently observing. Friday proved my suspicion correct as Gold dropped well below the 1900 level after breaking above 1950 for a day. The Friday Gold drop wiped out the month of December's gains in a day. Big hint here.
Nonetheless, one of the major reasons for being suspicious about the rally was that the Top 8 traders were obviously selling Gold, not buying.
The bottom most panel (yellow line indicator chart) is the Top 8 Net positions.
From May to June 2020, the Top 8 traders were accumulating already. And when the non-commercials started joining in the accumulation party, Gold prices took off.
December 2020, the Gold rally was supported by retail and clearly, non-commercials (until Christmas). However, it is clearly observable that the Top 8 Traders were distributing instead.
Over and above that, technicals show that Gold has a trend change, and needed to consolidate first. MACD was in bearish territory, and price just bounced off 1800 support and channel support despite that there was a large harami type candlestick pattern indicating a couple weeks of Gold rally in December. Well, that has ended... promptly.
This week, we saw a break out of channel resistance, and then failure of that break out. Bad news... this typically suggest a breakout on the other side to follow.
This can be targeted to be around Feb, at about 1650, if it were to plummet over the next few weeks. Probable at this point as the massive bearish engulfing (after channel breakout failure) is strongly suggesting... I expect to see some small bounce, followed by more of a dive in Gold over the next two to three weeks. Breaking down and out of the channel support represents good opportunities to look for a trend change (back to bull trend).
Oh wait... there is a BRB system buy signal, which I intend to discretionarily ignore for now. Perhaps take into consideration IF there is a bounce off the 55EMA in about two weeks.
Anyways... Do see my following post about the USD (and the GDX too). It spiked, and contributed to Gold dropping fast on Friday.

Gold Futuresthe base of the channel is 6% or 7% bellow from now
the market will still medium term bullish if we don't break the low of the channel
When he broked 1850 level, market gone to 1828 zone area and this area was rejected, he don't consolidated there. This means that this selloff was impulsive, and not to change the direction off Gold.
If breaks 1800 we can go to 1774, but we still Medium term Bullish.
On Last 4h candle I see maybe a reverse of the fall, maybe 1828 was impulsive and we can go now above 1870 and maybe 1896. If we can cross 1894 we have confirmation for an uptrend again.
For me now, the best zones to buy will be 1800-1830 if 1800 didn't break or above 1870.
Sell if breaks 1800. But 1774 can hold the drop.
But I think that on lowterm perspective we have already signs for up. But on 1h and 4h we still bearish, we need confirmation above 1870 to change this scenario.

Gold still in downtrend channel. Targets $1700..Gold had a nice rally in recent weeks but has faced major resistance and selling pressure at $1950-60 range again along with a downside break of the recent trendline.
Along with a breakout in US interest rate yields and an unstoppable rally in equities, the dog days for gold seem to be coming around again now.

Long Gold..Taking a long COMEX Gold (GC) position here as seasonal strength coupled with a nice bounce from oversold conditions along with long term EMAs still showing bull market is alive and well. Gold looks good for a 2-4 month swing trade here and will plan to sell once it gets back to overbought conditions again (90+ Stochastic). Stop is just under last week's swing low..

Gold on 🔑 Support: Expecting bounce back above 1900 shartplyHi guys,
sharing my chart how i will play gold today. Happy trading!

Swing Trade: Barrick Gold Corp.(GOLD) breakout setup 📈Hi fellows, just one of my today swingtrades:
Nice setup for breakout .
------------------------Trade setup ---------------------------
Entry: 24,80
Stop Loss: 23,83
Profit target: 27.73
Time stop: 5 days
------------------------------------------------------------------
If you like the idea, do not forget to support with a 👍 like and follow.
Leave a comment that is helpful or encouraging. Let's master the markets together.

SILVER TRAINThis could be an important moment in silver. I prefer that the metal stay cheap but I fear we are about to run out of time before this train leaves the station.
What do you think will happen to SILVER over the next year or two?


Gold is shining ☀️: Breakout of falling channel, Big Bull FlagGold had very strong move yesterday and broke up the falling channel which is very huge bull flag. Right now price approaching supply zone.
There is two posible scanarios:
As you see drawed in chart, 1st scenario is pull back to retest higher edge of the falling channel and fibo level 0.236 (@1914.2) and then continuation in direction of bull trend.
2nd scanario more likely to happen, in my opinion will be a breakout the supply zone and then pull back to retest it.
My target is 0.5 fibo level @2082.1
If you like the idea, do not forget to support with a 👍 like and follow.
Leave a comment that is helpful or encouraging. Let's master the markets together.

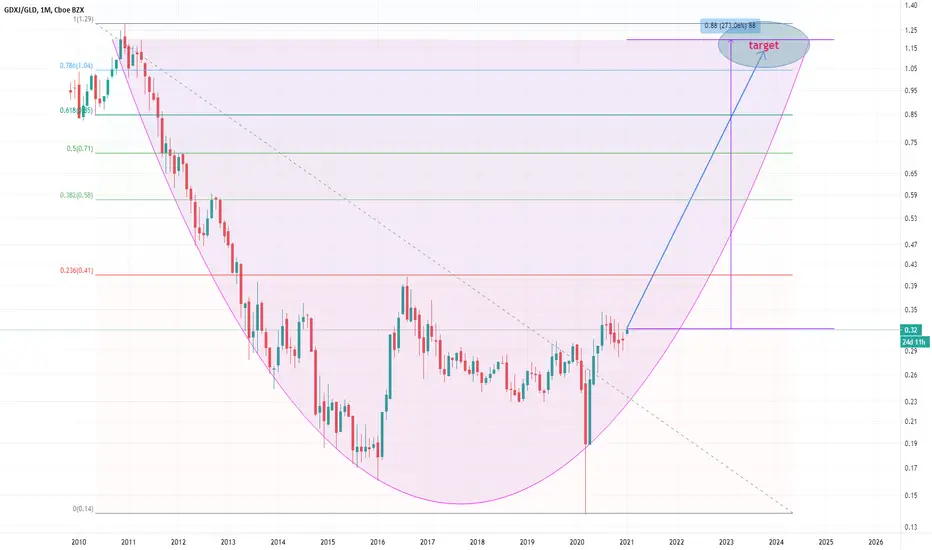
A Perfect Arc in the GDXJ/GLD Ratio suggests a mining bullrunGDXJ/GLD Ratio shows that miners are in for a treat. A perfect arc can be found to support that thesis on the log monthly.
𝗕𝗶𝘁𝗰𝗼𝗶𝗻 𝗨𝗽𝗱𝗮𝘁𝗲: $BTC Weekly. Huge move! Huge mover over the holidays and now that the $100K+ targets are coming out a pullback likely close. Bullish chart though given the breakout and new ATHs
$ETH $LTC $DXY $GLD $TLT $TNX $PYPL $SQ #Trading #Crypto #CryptoCurrencies #Bitcoin

1/4 WATCHLIST + MARKET OUTLOOK** THIS IS PURELY OUR OPINION AND WE ARE NOT LIABLE FOR YOUR TRADING DECISIONS **
Happy New Year! Looking forward to the first trading session of 2021. Let's get to it!
If you've been following our analyses on TradingView, you'll know that we have been very bullish in the short-term, and that we believe we are about to experience (or in the midst of experiencing) the last phase of any bull cycle - a blow-off top . You can see in the image above that we've had this strong support line (red) since the coronavirus low. On Thursday, we closed above the major resistance (green trendline - which has actually now turned into support). This is a very bullish signal. As long as the red support line holds, we will maintain a bullish bias.
However, the market doesn't care about our opinion and will do what it wants. So we will trade the price action we see!
WATCHLIST
Note that these levels are for intraday options/equity trades. These are not swing levels.
MU calls over 75.70
TIGR calls over 8.5
SHOP puts under 1128
SQ puts under 214.25
COST calls over 377.45
PYPL calls over 235
ROKU puts under 330.75
TSLA calls over 720
WKHS puts under 19.7
ZM puts under 336
Lastly, we opened a position in GLD on Thursday - we will likely add to the position tomorrow with a break of 179.
Have a great week of trading!

GLD swing entryGLD is a gold etf, it has been consolidating in a bull flag for quite some time and i believe we see a large move upward in the next couple weeks as it just broke a major trend line. There has been plenty of governement spending recently and with Biden getting elected, we should see an increase in spending and stimulous. Any increase of supply in the USD will result in inflation and in turn, cause asset and commodity prices to rise. This is an excellent point to enter into a long term position in gold, whether in a gold ETF, mining companies, or futures; however, the entry im shoing in this video is to take advantage of a trend break and i believe that short term we should see a large rise in GLD.

