GLD Gold TrustTarget ~194 for this move. Expecting a correction in micro soon and continue upwards. under ~178 more bearish
GLD

GLD Decending Traingle? Swing and a MissBought on 9/16, broke the wrong way the very next day. Looked like a decent descending triangle. Looked like it was just starting to break above the top trend line.
Can someone hlep me with what I missed?
Seemed like the market was moving into Gold to offset some risk.
Had recently had a decent pullback.
It didn't turn out to be a good time to buy. Market went up, GLD went down. Market went down, GLD went down. SELL

Will the miners offer one more dip?I am wildly bullish on the miners and precious metals over the longer term but I suspect another corrective leg down. GDX has been forming a giant ascending wedge from 2013-2020 and just broke out of that pattern this year. The drop in March was just a small piece of that puzzle that flushed a lot of new & experienced traders out of the trade. I pointed out several times that it was potentially an extremely good buying opportunity. That turned out to be true and the miners have been one of my best trades this year. I'm not an expert on Elliott Wave Theory but I'm seeing what looks like 5 waves up that completed in August. Perhaps now price is still stuck in some type of correction before a much larger move takes place. Take note of the red flag on my lower indicator. There's clearly a trend there and price has not dropped enough to complete another touch. There's no rule that says it must but it's just something to watch. Be patient. Be smart. Do YOUR OWN homework. Follow price. Ignore emotion... and get ready!

GOLD - 4 Hour - My ThoughtsHello friend, Andrew here, Here is my out look on Gold. Yes, how about Gold coins...lol.
I didn't give a detailed breakdown of why I feel Gold will take these routes, because I do not Chart Gold for the public. But, I do give routes and a possible direction... Hope this helps, make your own stops as required. If you follow me for any length of time, you'll know I ALWAYS say, set your stops and take profits.
Please let me know what you guys think and if you feel i should include Gold in our chart list...
I am not an investment adviser, I Chart.
Thank you and again , please comment, like and follow.
US500

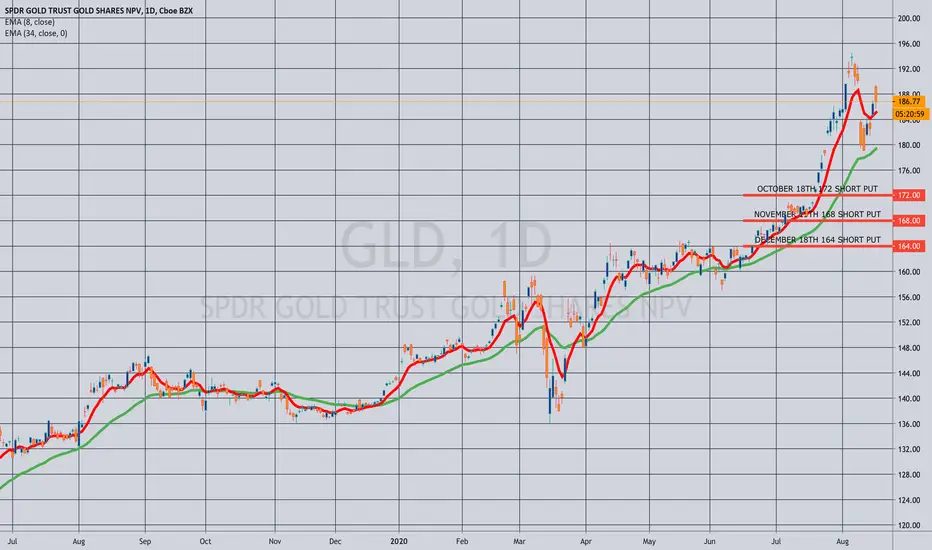
OPENING (IRA): GLD OCT/NOV/DEC 164/168/172 SHORT PUT LADDER... for a 5.69 credit total.
Notes: Amazingly (or not), I have no gold in my retirement account.
Although I feel I'm somewhat late to the game, taking up a position here in an instrument with excellent options liquidity. For smaller accounts, consider SLV, which also has the added benefit of having higher background implied (SLV: 69.4% versus GLD: 26.4%) or one of the miners (GDX, GDXJ).
As with my other acquisitional setups, run to expiry/approaching worthless and if assigned shares, proceed to sell call against.

GLD Gold trust bullishGLD still looking good. Expecting slight more correction here. ~177 looking like good possibility. Bullish over 180. Bearish if breaks though 177 like a 3rd wave move

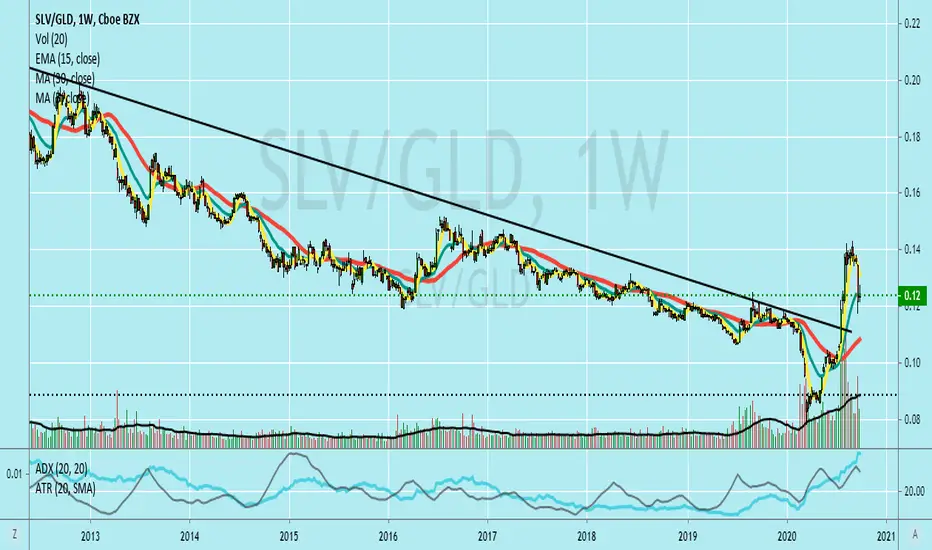
$SLV vs $GLD weekly chartratio suggests possibly some more weakness for silver ahead relative to gold with.
$GLD vs $QQQ Monthlymuch different situation here than GLD vs SPY in the previous chart. None the less seems to be at a relative bottom. GLD needs to have a positive month, otherwise might signal nasdaq break out based on this chart.

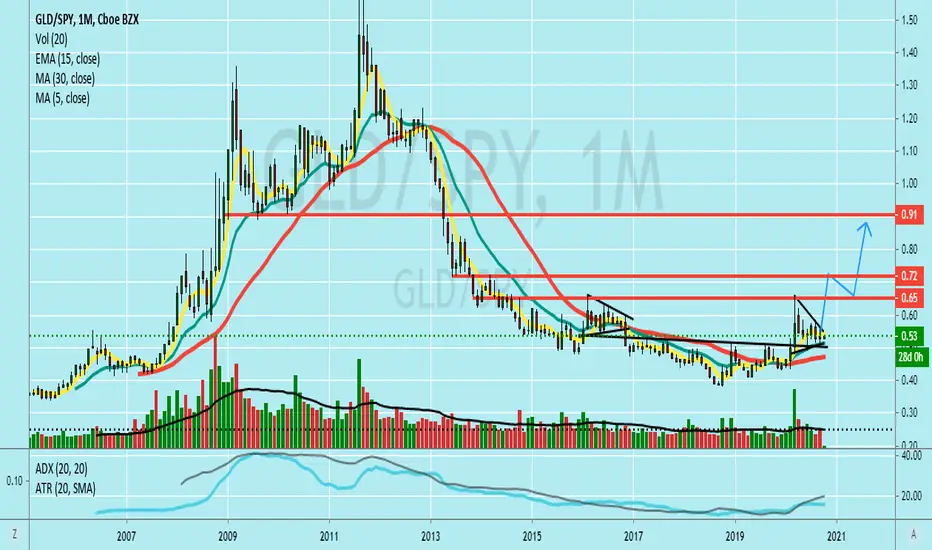
GLD vs. SPY Monthly chartSimilar wedge to 2016, we may have more strength behind the bullish thesis now especially with that volume spike $GDX $GLD $SPY $QQQ
Long Options Trading: GLD Buy Call $181.5 Exp: 10/09Understanding The trade:
As an options trader my goal is to identify trend change and utilize a breakout strategy to leverage profit off of major trend changes with minimal risk. Even though this contract does not expire till 10/09 I will be looking to take profit by October 6th as the rate of decay factor starts to come into play as the contract approaches expiry. This should correlate nicely with the downward sloping trend that has been resistance since August 17th. If you have any questions, please feel free to comment below and follow. Thank you and trade safe.
Reasons For Trade:
• Following upward trending channel
• Weakness in the USD Dollar after Trump announces he and his wife have COVID-19
• RSI validation on rejection of a break lower
Trade Parameters:
• Broker: Robinhood
• Cost For Entry: Free
• Contracts: 1
• Entry Price: .69
• Risk: $69
• Reward: $138
• ROI: 100%
• Risk/Reward Ratio: 1:1


The Metals are looking HEAVY - Getting Long GLD Again2H chart in GLD fires off an Extreme Turn Buy at 175. Targeting visible range POC 183 area.
GLD OCT 177/183 Bull Call 1.70db
As always, we keep the management of directional options simple:
Risk = 50% of premium paid
Target = 2x Risk

Long FCX ( $GLD $FCX #GOLD $GC1! $GC_F $Spy $GOLD $XME)see full chart at www.tradingview.com
FCX
Entry $15
Target 1 $17
Target 2 $20
stoploss $13
Why?
Why it is a buy?
Stimulus bill #2 will eventually come out by 2021, Along with FOMC mentioning that they will allow inflation to run wild. what that means is that, the fundamental value of GOLD and other minerals will increase in price. While everyone is focus on gold, and silver, they are missing out on Copper. so I think it is defiantly an laggard and we could catch a nice buying opportunity still.
Who are they?
Freeport-McMoRan, Inc. engages in the mining of copper, gold, and molybdenum. It operates through the following segments: North America Copper Mines; South America Mining; Indonesia Mining; Molybdenum Mines; Rod and Refining; Atlantic Copper Smelting and Refining; and Corporate, Other, and Eliminations. The North America Copper Mines segment operates open-pit copper mines in Morenci, Bagdad, Safford, Sierrita and Miami in Arizona; and Chino and Tyrone in New Mexico. The South America Mining segment includes Cerro Verde in Peru and El Abra in Chile. The Indonesia Mining segment handles the operations of Grasberg minerals district that produces copper concentrate that contains significant quantities of gold and silver. The Molybdenum Mines segment includes the Henderson underground mine and Climax open-pit mine, both in Colorado. The Rod and Refining segment consists of copper conversion facilities located in North America, and includes a refinery, rod mills, and a specialty copper products facility. The Atlantic Copper Smelting and Refining segment smelts and refines copper concentrate and markets refined copper and precious metals in slimes. The Corporate, Other, and Eliminations segment consists of other mining and eliminations, oil and gas operations, and other corporate and elimination items. The company was founded by James R. Moffett on November 10, 1987 and is headquartered in Phoenix, AZ.

Gold ready to rally???Gold hanging in there. Looks possible that gold may have finished a zig zag with a Wave C = 0.786*Wave A. Note that the RSI is just about in the oversold just like it did several months back. That level of oversold is just about right for a bull market. It could also run a bit more sideways to make a more convention descending wedge pattern. I also think the S&P is going to make a small drop this week before a medium rally corrective Wave B. If that is true, that would give a nice up, down, then break out for gold, just like a standard falling wedge.
If gold and the dollar like to be inverse of each other, then my DXY chart looks like the dollar maybe peaking and read for a big move down.
Gold since 2011

Gold $2150 - $2250 Near TermProposed Wave 5 will take price to 2150 to 2250 above previous highs into the end of 2020

Microanalysis of Gold (hourly)To bounce to 1910-1920...
Bullish MACD divergence on hourly chart, and downside extended. So need to test, and perhaps fail the resistance.


Good Old Gold- The Fibonacci Extension from the previous bull run should continue to be the frame for Gold's price action moving forward.
- OBV (On Balance Volume) on the macro level is trending upward indicating that the buying pressure outweighs selling pressure.
- OBV on the 4hr chart shows the recent sell off has corrected back down to a level where buying pressure should start to pick up.
- Between the 0.618 and 0.5 fib levels is a great place to accumulate a long position.
Long MGC +1 @ $1,880.70

Gold - Ruh roh it is that a bearish descending triangle?Starting to lose support and looking like a descending triangle. I really thought it was going to stay up there, but not looking good.

GOLD SUPPORT?Thanks for viewing,
Short-term short view (not shorting), then long again.
I can't see a very good reason for a gold correction other than;
- Everything needs to correct - it's never a straight-line move,
- It is possible that big banks (possibly even the Custodians for major gold ETFs) are being forced to sell-off reserve assets to cover losses or to put aside as contingencies for what look like to be a future MAJOR banking investigation and likely hefty fines,
- The drop will get deeper due to short-term traders using excessive leverage (massive inflow in 2020 of inexperienced traders won't help).
But, its not like US government debt, the US Federal Reserve balance sheet, massive money printing, global move away from the USD, or 10 year treasury yields (0.68%) suddenly got any better - so I see no reason for me or anyone else to sell physical gold. This is just a gift to people with the ability to add to their positions really. Yes big institutions and traders will do their thing buying and selling paper gold, but you and me can buy and hold - which negates many of the advantages that major trading houses and hedge funds have over the "small guy."
But, even the small players want to know where the price drops are likely to end, so that they can add to their positions. BTFD and all that. So this is where I am targeting for my next buy, like always I don't know if I am right. So I got out my magic number 8 ball and gave it a shake.
My TA is just about looking for areas that "line up", areas that people using various methods of determining support and resistance will target. The more that line up the better.
So I looked at the 200MA (and extended it with great artistic skill and flair,
RSI - which on the daily time-frame is right on the 30 level,
support from previous recent price peaks,
Fibonacci extensions - assuming a 1:1 extension of wave C,
Fibonacci retracement, and I ended up with the blue box.
The smaller sliver blue box between 1800 - 1807 is what I am thinking as both the 1;1 extension and a 1.618 extension of what may be the start of wave C down. I will buy here and buy again if it goes lower. Now that the gold/silver ratio is above 80 again, I will also be adding to silver positions in the expectation that silver will again out-perform gold when / if the bull market continues.
If the $1800 doesn't hold then watch the 200MA / 0.5 Fib retracement and the recent price peaks to form the next area of strong support in the mid to high $1700s.
I see USD2200 as a low estimate for gold by the end of 2020. If you hold positions in bullion ETFs, seriously consider moving to using non-bank bullion vaults (like Bullionstar in Singapore www.bullionstar.com) with secure allocated, low cost, storage. ETFs take what is essentially a riskless asset and add in layers of counter-party risk (Trustees, Custodians, and many Sub-Custodians (that the Custodian does not have the right to audit)). Expect more news of issues with the paper markets and also with the Custodian for the SPDR Gold Trust GLD in 2020.

GLD LongGlD has started forming handle for a cup and handle pattern. Guys remember this is the last time GLD will be seen at that price. Bottom of the handle is what everyone needs to keep an eye on. When confirmed it is time to load and hedge against USD. Because as previously posted, today VIX has bounced heading up, USD is heading north and GLD and stocks are going down. Bonds slightly up too. Market is telling us something. Election debate will cause volatility but it is our only chance to let USD go and buy something else. Warren Buffett bought Barrick gold as a hedge against dollar. Because he believes in businesses and Barrick gold provides some dividends and price growth as gold rises so does the margin for miner. This is my opinion and not a financial advise. Please do not buy or sell any financial asset or any other asset reading this posts. These posts are for educational purposes.
