Ascending triangle, needs to close above 1957Major support at 1900. There has been October/November options flow purchased last week for gold stocks; WPM, GOLD and GLD. FOMC decision is on wednesday and expect more dovishness from JPowell. Longer lower rates, until a vaccine is approved. Trump wants a lower dollar as well, so its all working out for his election needs.
GLD

GLD PT $194 or $170MASSIVE bull flag. Cup and handle forming at top of flag that might break. High target from flag pole is roughly $205. CH price target is roughly $188. Price target from the flag is about $194 (ATH). Failed flag should fill all gaps below and bring us to $170

Gold finished corrective 5 waves? looks like it is entering into a new phase of trading. If the count of ABCDE corrective wave is valid then the next wave COULD be an impulsive wave.

GLD shows investors aren't selling yet!If you're ever wondering whether or not the market is looking rocky, a good way is to look at Gold -- money will flow out of stocks and into commodities as a hedge, and in this case, GLD is holding within this symmetrical triangle. However, if GLD looks like it's consolidating here with the oscillators indicating strength. This *could* be a sign that investors are preparing to hedge their portfolio and are expecting a market selloff sometime soon. Watch these levels, especially towards the end of the month!


Gold in a corrective triangle structure and lean towards Northcheck out the MFI downtrend breakout. It might serve as an early buy signal..


Microanalysis of Gold - Hourly chartsAfter being in consolidation for a decent amount of time, a support trend line has been broken.
Technicals are suggestive of more downside as a result of this break down.
Look out for <1900... it would be rather obvious

Time for tea? Yes gold is going UP! But time to drink up to half of your cup of tea first. We need the handle on our cup. :)
Disclaimer: The above is not an investment advice. It is merely an opinion and I share it for your entertainment only. Do your own due diligence and above all, trade safely and stay safe!

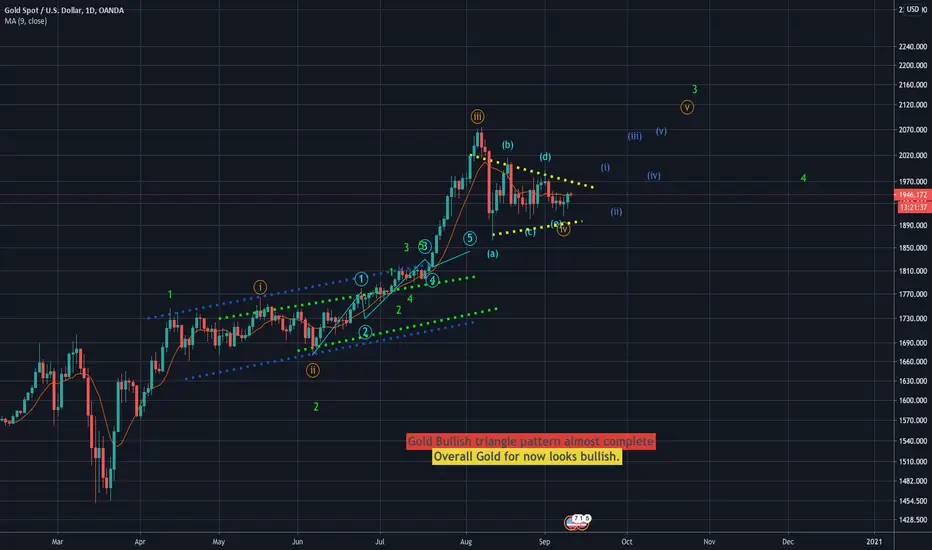
GLD wave (5) rally GLD consolidation pattern almost complete is likely targeting a pending wave (v) rally targeting the 2070 level. Working on Medium term consolidation. TSLA is also reaching equality of wave (v) vs. wave (i).


GOLD Monthly chart’s “Rally & Tell”Just to recap again...
1. In early 2013, a “friend” brought me to a gathering, where the charismatic speaker claimed he was told that Gold would be tracking higher than the last high, etc. There was a following who dumped everything and loaded up on Gold then. I never went back because I saw the opposite. Clearly, from the chart, I was not wrong, although I was apparently the only one at that time to be bearish on Gold. Chided and ran over I was... I left Gold alone for a long time. Clearly, this “friend” never came back to speak to me for very obvious reasons.
2. In August 2018, I started tracking Gold closely (having left it aside since the last high in 2013), and this was due to an Enquiries for my opinion by a long time friend who suddenly was keen to accumulate Gold. Since then, I saw a multi-year opportunity and wrote about it in my Gold Odyssey blog chapter until I migrated over to TradingView. The patterns observed since then are drawn here. Namely, a multi-year Cup & Handle. Previous idea posts depict the last two years worth of experience in technicals and in real trades.
3. The projection to Gold at USD2000 was observed since last year, particularly after Trump declared a trade war by imposition of trade tariffs.
4. Gold exceeded the target by almost 5%, particularly in 2020. So where to now?
From the monthly chart, few things catch my eye...
Firstly, the candlestick pattern of August. With a 5%ish long shadow above the candle, practitioners would read for a following down candle in September. While early into September, price retraced enough to find the first support of 1930(-1950). This area is significant historically as it was the 2011 rejected high. Probabilities stack up against staying above this level, although most of the analysis by others yelp about the support to bounce. Clearly, I am a lot more bearish in this view (similar to 2013) and perhaps I am one of the few seeing this as a possible move towards 1500, possibly to 1400 at the lowest point. Unthinkable.
Secondly, the MACD is burnig out in the rate of acceleration, and with a huge range of volatility, it looks to be able to pull back to 1800 with little effort and time, and even to 1500 (white support line).
Thirdly, 1800 is a good support for a very bullish case. But the C&H pattern might need a deeper retracement to 1600 or below.
Fourth, around the toppish area, the net interest of non-commercials (orange line, lower panel) and Top 8 Traders (yellow line, lower panel), all point to lowered interest, encouraging more downside.
Fifth, outside of this chart, the USD is setting up a strong bullish bounce back, having almost waterfalled over the past months. This would definitely put pressure on Gold prices, as well as any USD denominated commodities.
Fifth, it appears to be a time of moderation as all other asset classes are reacting, including cryptocurrencies.
Lastly, the seasonal cycle is aligned for Gold to rotate lower from now till end of year, possibly extending into February next year. As projected by the handle of the cup.
Whichever way Gold is going, there is definitely robust (up) trend, and being aware of the bigger picture helps going forward... as it clearly did over the past two years.
IF the Cup & Handle pattern plays out... just imagine the multi year target price upon breakout. 😳😉

GLD Ascending TriangleI realize multiple people have identified the ascending triangle of GLD and stating it's bearish trend. Since the initial trend was bullish, why wouldn't it break to the upside? Congress is 99% going to pass another stimulus package which would be a positive catalyst for gold and silver. Any thoughts would be appreciated.

Bitcoin as the new digital gold?Quick note... BTC Bitcoin appears to have aligned with Gold in 2020.
See the buy signals and one sell signal almost co-aligning in the overlaid charts.

Gold-ing down...Not something to short, but finally an opportunity to get ready for a second bite of the cherry, if not the last stop to boar the train is coming up... this expected pullback (mentioned before that it can pull back as deep at 1400-1600 technically, despite all rational reasoning) mane deeper than expected. Regardless, it allows an opportunity to look for entry points.
Technically, there has been a series of lower highs, albeit a lack of lower lows for now. It is resting at a horizontal support as well as the triangle support. Later next week, with a risk to break out of the triangle, and breakdown below 1910 (also meeting the 55EMA orange line support), it would be clear as daylight that Gold is retracing and not consolidating.
Other technicals suggest more downside to follow, for example, the MACD has crossed down in the bear territory. Other correlations include a strong bullish divergence of the USD to put downside pressure on USD denominated commodities like gold and oil (Crude oil gave way first).
1800 is the immediate target over the next two weeks. Watch for it.
By the way, the white arrows indicate my last trade entry and exit points. I walk my talk.

GLD Gold Trust UpdateBullish scenario hasn't been invalidated yet, but higher chance in my opinion of the ~167 to 160 move down . Expecting some more follow through to ~179.5 based on micro structure and corrective move up.

Gold Once Again Facing An Important Cross RoadGold bounced out of the last descending triangle, probably psyching a few people out, and we are in the red triangle! What do you see happening? Buffet just bought gold, so over all I am pretty bullish. If we break up I would expect $2015 as a short term target. If we break down $1830 minimum. Please give your short term opinion. This is not trading advice.


Gold is hard to follow?GLD is still working in a price channel and a trend to the BULLISH side.
Bouncing off the bottom support while consolidating. Positive S&P or DOW moves tend to see down days or sideways selling.
Any bad news may see upticks within the Fib or BB ranges UP!
Watch for Thursday's with Futures closings, Friday Option expiration's and "Witching" days, these are also big Gold/Silver sell signals as margin calls
or weekend bag holders drop positions for cash.
Renko's track just the price moves with trends, use these and Henkin Ashi for patterns, then Candles for action!

Gold may have probably topped outGold prices had been on a year to 2000+, and this was expected over a year ago (may not have been posted here previously). Nonetheless, it had stretched to reach and exceed its target, and is now contemplating what to do. As it does that, the Gold futures GC1! has made a series of lower highs(marked by the white resistance lines). The thing is that it is not followed through by lower lows as well. So, not yet likely a end of trend. But it is clear that a break and close below 1900, it is in a decent downtrend. 1900 must hold. Closing below of 1920 is already enough for me as a qualifier for a decent retracement in Gold.
In other correlationships, the USD Index and USD futures are forming bullish divergences and when these play out, we may see Gold breaking down below 1900.
Possible target 1600, with 1800 as a pause point.

GLD Inside Ascending Triangle. Upside Breakout Due..After a nice $200+ correction from the fresh all-time highs, Gold appears to be making a new triangle which could breakout to the upside by the end of this month/early-September. While spot gold did go lower which is not reflected in the GLD ETF, spot prices did not stay below $1900 for more then 4 hours which shows there is very STRONG demand under that price. Looking to go LONG again upon a confirmed upside breakout..

GLD 9 year breakout chart/Bull Flag GLD fundamentals and technicals both supporting a breakout of a 9 year rounded base. Currently flagging with support at 180. Breakout of wedge is 187.50 trigger long, targets 190/195/200.
