Gold / XAUUSD ~ Nov-Dec Snapshot (2H Intraday)TVC:GOLD chart mapping/analysis for last week of November.
TBC further details/write-up via ideas section.
GLD

$GDX Bull Flag Poised to Break OutThe AMEX:GDX , a notable gold miners ETF, is currently displaying a Bull Flag formation, indicating a potential breakout on the horizon. My perspective remains that we are on the cusp of a significant breakout, one that could not only impact the gold market substantially but also trigger an even larger movement in mining stocks. Admittedly, I've held this view for some time, akin to the old saying that "a watched pot never boils," suggesting that sometimes anticipation can make the wait feel longer. By mentioning this, I might be tempting fate with the market, yet I believe that this breakout could occur unexpectedly, perhaps when it's least anticipated by most investors.

$GLD Cup & Handle Monthly Chart### Technical Analysis Update: AMEX:GLD Cup and Handle Formation on Monthly Chart
The SPDR Gold Trust ETF ( AMEX:GLD ), which tracks the price of gold, is exhibiting a notable pattern on its monthly chart known as a 'Cup and Handle' formation. This pattern is of keen interest to technical analysts and investors, as it often signals a bullish continuation trend.
#### Understanding the Cup and Handle Formation
The Cup and Handle is a bullish chart pattern that resembles the shape of a tea cup. This formation typically occurs in an uptrend and is indicative of a consolidation period followed by a breakout.
1. **The Cup**: This is formed when the price first experiences a gradual decline, followed by a stabilization and a rise back to the original starting point. The price movement during this phase should be rounded and shallow rather than a sharp V shape, and it usually spans several months to a year. For AMEX:GLD , the cup formation suggests a period of consolidation after an initial sell-off, followed by a gradual and steady recovery to the previous highs.
2. **The Handle**: Following the cup, a small downward drift in the price forms the handle. This is typically a retracement that does not go below the half-way point of the cup. The handle represents a final consolidation or a shakeout of less committed traders before a potential breakout. It's often seen as a bullish flag or pennant.
#### Implications for AMEX:GLD
For AMEX:GLD , the appearance of a Cup and Handle pattern on the monthly chart is significant. It indicates that after enduring a period of correction and consolidation, the ETF is potentially gearing up for a continuation of its prior uptrend.
#### Key Points to Watch
- **Breakout Point**: The critical level to watch is the resistance line formed at the top of the cup. A convincing breakout above this level on increased volume could signal the continuation of the bullish trend.
- **Handle Formation**: The depth and duration of the handle are crucial. It should not drop significantly into the cup and should show signs of stabilizing or minor retracement.
- **Volume**: A genuine breakout is often accompanied by higher-than-average trading volume, adding confirmation to the pattern.
#### Trading Considerations
Investors and traders considering positions in AMEX:GLD should closely monitor the completion of the handle and the subsequent price action. A breakout above the cup’s rim could offer a potential entry point, while a failure to break above or a drop below the handle might necessitate a reassessment of the bullish hypothesis.
As with any technical pattern, it's advisable to consider the Cup and Handle formation in conjunction with other fundamental and market factors. This comprehensive approach helps in making more informed investment decisions.

Gold - Fade a The Short Squeeze RallyThe marketing team behind gold and silver are always telling dumb and dead money that they should "hedge" against a "collapsing US Petrodollar" during times of global instability by being long on metals.
The trade rarely works out. Gold and silver not only routinely follow the equities markets straight to Hell, but tend to get dumped during the start of new index impulse swings.
This rally while the SPX gave up its 5% rally is actually a significant anomaly.
But if the propaganda never, ever worked out, the propaganda would stop working and the marketing team would be out of a job.
And that more or less sums up a 10% monthly rally on gold that's killed short sellers who wanted to comfortably ride a trend down.
You can see on the monthly that this price action is just more ranging, more wick plays, and there's a notable unbalanced gap under $1,800.
It's really important to keep a cool head as a goldbug, especially under the condition where the establishment media is reporting that Xi Jinping and the Chinese Communist Party is long several hundred tonnes worth of gold.
The CCP is collapsing and everything that is going on in the world has to do with the various members of the CCP around the world, who are not of the Chinese race, scrambling to bury their skeletons while also trying to ensure they can take control of the country when the regime falls.
And because of that, there's no reason to believe that a CCP that is desperately selling US Treasuries (see: Santiago Capital) for USD is going to be allowed to go plussy plus greeny green on its deeply deep goldy gold position.
What hangs over the head of everyone on this planet is the Party's 24-year persecution of Falun Dafa's 100 million students and Disciples, a sin committed by former Chairman Jiang Zemin on July 20, 1999, that has even had the audacity to commit the unprecedented crime of live organ harvesting.
Keep your distance from and wash your hands from anything related to the CCP, including the western factions that have become a particle of the Party swearing Marxist vows in Shanghai.
So, here's the trade.
Doesn't matter if gold takes $2,015. It's not the right overall timing for a new rally to $2,200.
Instead, either go short, or wait for gold to trade under $1,800 again.
There's no reason to believe gold is a new bull market until longs have been ruthlessly violated. There's no reason to believe metals are going to rally as a hedge during an international war or a major equity sell off, or a major equity rally lol.

Gold Futures ~ November TA Outlook (4H Intraday)COMEX:GC1! chart mapping/analysis.
Note: TradingView chart B-ADJ adjusted for contract changes
Gold Futures holding bullish consolidation after epic rally since early October due to Middle East tensions triggering a "Flight to Safety" trade + institutional short covering.
Wait & see approach whether Gold will continue to climb higher within ascending parallel channel (green), or capitulate to refill the breakout gap, TBC.

Gold poised to make all-time monthly closing price highThe price of Gold has never surpassed $2,000 on a monthly closing price basis. Tuesday is Oct 31. Be on the watch. Gold is in a major bull trend. My target is 2,500, then 3,600.

bitcoin following in golds footsteps, "wen etf?"
Pretty cool how gold goes through the tech bubble crash followed by a spot ETF shortly after.
bitcoin went through the crypto bubble crash following the same macro falling wedge pattern, if history repeats this move is going to catch majority of bears and bulls off guard here like what happen with gold.
could be something to consider what if this time the bull market happens into the halving date peaking when the halving happens in 2024?, this would mean the bull market that people expect to happen after the halving could happen prior this time.
Two things the market is not considering -
1. bitcoin bull market begins now and ends sooner than expected mid 2024
2. Ethereum and altcoins to be completely regulated out of existence in the first world. (most of the capital will rush back into Bitcoin)
Bitcoin is what happens when you take Gold and plug it into the digital world and increase the scarcity while incentivizing decentralized energy. .
the reason Bitcoin looks like its moving 7 years for every 1 year on Gold is because it should be its superior.

The Gold Odyssey - Breaking out of top consolidation finallyIF you had been following the series of The Gold Odyssey, you would know how well the probabilities are in the analyses.
To the point, Gold is ready to break its almost three year consolidation (huge) range.
1. You can see the powerful reversal off the mid-range support;
2. The candles show and project good momentum to follow through;
3. A trend line breakout already just happened with the week not closed yet; and
4. MACD and VolDiv are only starting to align for a good bullish breakout.
Incoming!!!!

$GDX Trend Line Break AMEX:GDX Trend Line Break, echnical breakout in the chart of AMEX:GDX , which is an ETF that tracks the performance of companies involved in the gold mining industry.
A "Down Trend Line Break" to the upside is typically seen as a bullish signal in technical analysis. It indicates that the security in question, in this case AMEX:GDX , has broken through a declining trend line, suggesting a potential reversal or change in the prevailing downtrend.

Gold futures eyes $2,577 in acceleration of upside impulseA pullback in yellow wave (2) almost hit 61.8% of yellow wave (1).
Now we see the strong minor impulse to the upside.
It can be a part of large yellow wave (3).
The target is projected at the distance of 1.618x of wave (1) with aim at $2,577.
Watch how price breaks above the top of wave (1) beyond $2,086
Risk/reward is 1:2.5, one could get it better if goes on a lower time frame and buys on
minor pullback following minor wave 1 of (3).
Do you see gold futures touching $2,577?

$GLD Gold Has a Double BottomIn technical analysis, a "Double Bottom" pattern is a bullish reversal pattern that typically signifies a potential change in trend from downward to upward. In the context of AMEX:GLD (Gold), spotting a Double Bottom pattern suggests that the asset has tested a support level twice and rebounded, indicating strong buying interest at that price level. This can be interpreted as a sign that the downward momentum is waning, and a bullish reversal is likely on the horizon.
Investors observing a Double Bottom in AMEX:GLD would be watching closely for a breakout above the resistance level that tops the pattern, often accompanied by increased volume, as a confirmation that the asset could be entering a new bullish phase. However, as always, it's crucial to use other forms of analysis and indicators to validate any trading decisions.

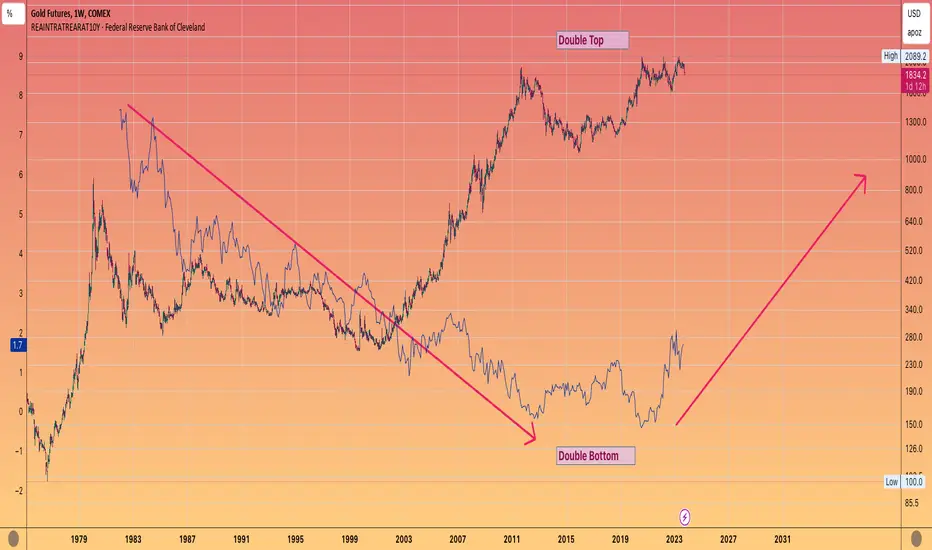
GOLD - Positive real rates is negative for GoldThe attractiveness of Gold is tarnished
When cash instruments yield a positive rate of return
More and more people are getting on board of higher interest rates
(Dimon, Santelli)
But u can see the Gold price has been inversely correlating with the rate of return for decades.
It's bull run in the 2000's along with the commodity bull , coincided with real rates trending to less than zero. Gold Topped a few months prior to that negative reading in 2012!
The current triple top that has been in place for he past 3 years , seems to be in danger of breaking down if rates continue up the next few years.
The key level to watch is last year's lows in October around $1611
Which I believe is a distinct reality if rates head up to 7%
Gold likely going lower until rate cuts in 2024#GOLD sell we posted (trading portion) was SPOT ON (tee hee)
Barring something out of ordinary AMEX:GLD is most likely not going bull, at least, until 2024. There's also possibility it could also consolidate for few years but that's a story for another day.
The precious metal is likely headed towards 1800 area.
The last chart shows all major support levels by the dashed green line.
We will wait for reversals @ support levels.

Gold/XAUUSD ~ 4H Swing Chart (Oct 2023)TVC:GOLD chart mapping/analysis for short-term swing trade strategies.

Gold/XAUUSD ~ Daily Swing Chart (Oct 2023)TVC:GOLD chart mapping/analysis for med-long term swing trade strategies.

Gold found its bottom next target ATH!Gold seems to have found its bottom around a pivotal point where it has played as a support and resistance for a long time. Also, it corresponds cleanly with 0.382 fib ratio, and from here the path to creating a new ATH is clear.

Expired GLD Weekly outlook. 3rd WK SEP 2023Expired GLD Weekly outlook. 3rd WK SEP 2023
> NEUTRAL 📊 CORRECT
Closed Price: 178.34
Target Price: 178.42 | Strike Price: 179.38 SEP18
Upper Range: 183.84
Lower Range: 172.99

Expired GLD Weekly outlook. 2nd WK SEP 2023Expired GLD Weekly outlook. 2nd WK SEP 2023
> NEUTRAL 📊 CORRECT
Closed Price: 178.08
Target Price: 178.48 | Strike Price: 178.59 SEP11
Upper Range: 183.91
Lower Range: 173.05

Daily [SLV] Report for Mon, 9/11/23Just thought I'd try posting a daily report. This is the first of hopefully many more. Let's see ow long I can do this. At some point, (hopefully soon), I will be placing a swing trade. That is lasting a week or two.

SLV Explosive Move coming, 66% probability - BullishA move similar to magnitude of Spring 2020 is lining up, with bullish tilt.
ready, set, GO!
The information and publications are not meant to be, and do not constitute, financial, investment, trading, or other types of advice or recommendations.

Expired GLD Weekly outlook. 1st WK SEP 2023Expired GLD Weekly outlook. 1st WK SEP 2023
> NEUTRAL 📊 CORRECT
Closed Price: 180.11
Target Price: 179.67 | Strike Price:178.64 SEP5
Upper Range: 185.15
Lower Range: 174.19

$GLD Bearish To bullish Reversal AMEX:GLD Bearish To bullish Reversal The technical analysis of the bearish-to-bullish reversal in the context of the GLD (SPDR Gold Trust ETF) involves the observation of key price actions, trend lines, and moving averages. This analysis suggests a potential shift in sentiment from bearish to bullish.
**Bearish to Bullish Reversal:**
The first notable point is the transition from a bearish trend to a potential bullish reversal. A bearish trend is characterized by a series of lower lows and lower highs, indicating a prevailing downward movement. A reversal, on the other hand, suggests a shift in sentiment and price direction.
**Down Sloping Trend Line Break:**
The breakout of a down-sloping trend line is a significant technical event. Trend lines are drawn by connecting a series of highs or lows, and a down-sloping trend line connects declining highs. The breakout above this trend line indicates that the price has overcome the resistance posed by the trend, suggesting increased buying interest and potential bullish momentum.
**Testing the 150-Day Moving Average:**
The 150-day moving average is a crucial technical indicator that smooths out price fluctuations over a relatively longer period. It serves as a dynamic support or resistance level. When the price tests the moving average from below, it signifies a potential reversal point. In this case, the test of the 150-day moving average after the trend line breakout further supports the idea of a potential bullish reversal.
**Confirmation and Further Analysis:**
For this potential reversal scenario to gain more credibility, it's important to look for confirming factors:
1. **Volume Analysis:** An increase in trading volume during the breakout and subsequent price movement lends strength to the reversal. Higher volume indicates increased market participation and conviction.
2. **Follow-Through:** After breaking the down-sloping trend line and testing the 150-day moving average, the price ideally should continue to rise. The sustained upward movement after the initial breakout adds more confidence to the bullish reversal thesis.
3. **Relative Strength and Momentum Indicators:** Analyzing indicators like the Relative Strength Index (RSI) and Moving Average Convergence Divergence (MACD) can provide insight into the strength of the reversal and whether it's in line with other technical signals.
4. **Support Levels:** Identify nearby support levels, such as previous swing highs or the recently broken down-sloping trend line. These levels can act as potential support in case of a pullback.
It's important to note that technical analysis provides probabilities rather than certainties. While a bullish reversal scenario seems plausible based on the trend line breakout and testing of the moving average, it's essential to consider the broader market context, news, and fundamental factors that might impact the price of GLD. Successful trading decisions often involve a holistic approach that incorporates both technical and fundamental analysis.

Silver - 33 Moons [And An Options Opportunity](Using 3-Day candles for visibility only. Consult weekly/daily yourself)
I have an open call on Gold in that I believe a new high will be set, but it won't actually be bullish, because metals are going to dump pretty hard in the future and try to make retail sell their bullion.
Gold - When A New ATH Prints, Will You Get Trapped?
I hadn't paid a lot of attention to Silver and was on the sidelines until it dumped 10 percent this week, and now I believe there is a crazy good opportunity.
The problem with Gold is that the Chinese Communist Party bought a lot of it and they're going to get margin called or are the ones actually short selling.
The problem with silver is that there's not a lot of it left and it's really needed for technology.
When smart money wants to buy they accumulate at low prices and distribute at high prices. Often times what precedes the biggest moves are smaller moves that serve the purpose of wiping out and shaking out early short sellers and trapping retail traders who just love to buy high and sell low.
There's a lot of geopolitical risk in the world right now, as you can tell from the weekend "Prigozhin Coup," which I cover the implications of for the US Dollar here.
DXY - The US Petrdollar And The "Prigozhin Coup" In Russia
But the biggest geopolitical risk is what happens if Xi Jinping gets up one morning and dumps the CCP. Nobody believes this can happen and nobody is prepared for it.
But when it happens, it will implicate the whole world for both Xi and China to survive, they will have to weaponize the persecution of the 100 million practitioners of Falun Gong committed by the Jiang Zemin faction starting in 1999.
Since much of the world's financial sector and governments have dirtied themselves with Jiang in the persecution, when that day comes, it will mean that everything, everywhere is limit down. The liquidity will be gone, the algos will be off. Markets will no longer be made.
It is what it is.
In the meantime, nothing about what's going on with silver is bearish. Prices are low and it makes you want to sell, but it's actually a situation where you want to go long.
I believe that $21.20~ or $20.80 is what it's aiming for, and afterwards, the target will be at least $29.
So, what about options? One of the ways you can trade this move is calls on the SLV BlackRock ETF.
Getting in at $19~ and seeing a $10 move would push the ETF to at least $30.
There are two things that are significant about this:
1. Jan '24 at the money calls (based on the price right now) are $2.21
2. Average Implied volatility is only 24% and the 52W week low is 23.6% and the 52W high is 36%.
What this means is that calls are cheap and if iVol were to expand on a bull run from say 26% to 40% you'd pick up an extra ~$1 per contract on top of the strike gains.
The AGQ 2x Bull ETF has even more potential upside but it's a lot more risk and the swings are a lot more dramatic, for really obvious reasons.
All of this also means you can speculate in mining ETFs and individual miners. You need to use the underlying commodities as your metronome, though.
But this also means you'd have to be able to hold a winning position for 3 or 6 months.
You'd want to take profits at $27 and $29.
But if you get ahead of yourself and buy the $30+ high thinking that $50 and $100 and $500 are coming, you're likely to get seriously hurt.
Something is going to happen in this world between now and Q1 2024 and it's not going to be good news for the people lost in delusion wanting to have happy days and be a big baller.
Be careful, and happy trading.
