XAUUSD Spot Gold ReversalOna 4H Chart XAUUSD has been trending down for 2 weeks from a double top at $2052 where
the Stochastic RSI put in a top at 100%. Price crossed above the upper Bollinger band before
its pivot high. As it trended down, it did retrace back up to the upper Bollinger band and then
resumed the downtrend heading outside the lower band and reaching a pivot low of $1954 on
Thursday, May 18th along with RS approaching zero. Price then reversed and put in an engulfing
bullish candle before closing out the trading week with a Doji. Price crossed through the black
trendline drawn onto the chart. The RSI indicator curled upward and is progressing to crossover
20. The volume profile shows the majority of the trading between $1992 and $2040 with the
mean at $2018. This would be the area of highest liquidity and volatility.
The Echo indicator (AI predictive tool of Luxalgo ) suggests a near-term rise in price and a
consolidation area of $ 1993 before another leg up into the high-volume area. Overall, I will
look to take a long position to begin the forex trading week upcoming as well as a gold ETF
such as GLD or even JNUG on the equities market.
GLD

GLD is HIGH - just FYIA lot of people are buying gld here.
I'm not.
No real Risk : reward. SLV is buyable at $20. But gold is too high and at a VERY obvious resistance for me to be aggressively buying it. If anything, collars , bear debit spreads or ? maybe a bear call spread
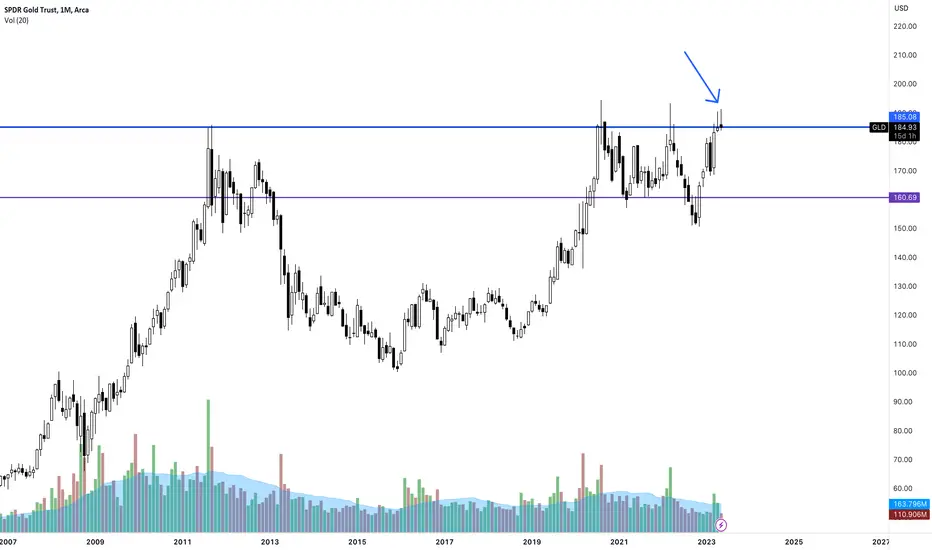
Gold Bugs Squished?I've been talking about Gold COMEX:GC1! hitting a major high for my last two Livestreams (catch them Friday at 4pm Eastern after the market close). The current price action warrants a standalone post.
Each Livestream for many months has had at least one person ask what I thought about Gold. It was very simple: Gold was trending UP to test the major Monthly highs. In many of my social market chats about two weeks ago my gold bug friends began getting very excited. I urged caution. Price MUST break the high and confirm the breakout before getting long at this major Resistance Level. Now it looks as of gold price is respecting this monthly high from the last few years.
To be contrarian I had to short Gold (using AMEX:GLD ) based upon a Spike setup from Friday May 5th's high. Last week price pulled back and "should have gone" to retest and break the high. It did not and returned back inside the range. This sets up a short. I also know from taking market sentiment that a lot of traders may have gotten a bit overly optimistic. This could setup for a good pullback to at least the 1850 Level.

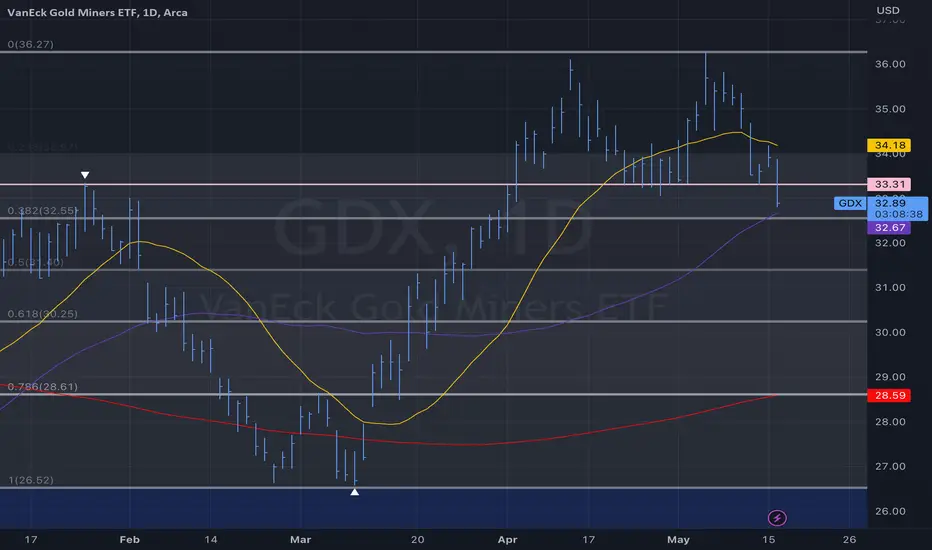
$GDX short term support & major supportAMEX:GDX short term support at the 50 day moving average next major support will be around $30
$GLD Weekly Chart Update if AMEX:GLD consolidates into a bullish pattern it will break the resistance level at 194.45 but if TVC:GOLD breaks the trend line AMEX:GLD will probably go back to the double bottom

$GLD Gold support levelGold has support at the 20 day moving average if that breaks first support will be around 181.73

Gold Futures (GC) Weekly is Bull Flagging, But.....Gold is currently in a flag similar to that experienced last March and April. Last year's flag broke down, very unusual for this formation (normally it is a continuation pattern). Most likely the breakdown can be explained by the strong ramp up in the dollar index last year. Also, gold seasonality is usually weakest starting in April - June.
This flag is very tight, and being very near the all time high of 2089.20 at the flag peak of 2085.4 -- so I am biased in thinking that this flag may not reverse, even should DXY show strength. Of course, there are numerous geopolitical and other macro events which can have a positive effect on gold, if they create uncertainty.
Key areas to watch. A break below 1985.60 and hold and it will signal another flag breakdown. A break above and hold of 2085.40 (flag peak) and it signifies a bull flag continuation. These are simple areas to watch and are significant.

Gold Order Flow - One Script To Rule Them AllHello traders,
Once again, the OFA script demonstrates its prowess...
Through the synthesis of fractals-based order flow data, we can deduce potential future trends in a market that has experienced unprecedented volatility in recent times.
Following the decisive breakout of 162.00 last Nov 2022 which left behind a double bottom, Gold was propelled towards 191.00 through a series of HH and HL patterns via the OFA script.
With the latest two cycles printed consisting of greater amplitude and velocity by the bulls, which was met by tepid sell-side pressure as the OFA indicates,
The path of least resistance continues to be higher.
We will never claim to have foresight or certainty about upcoming developments.
Instead, we will be attentive spectators of price fluctuations, allowing the OFA script to shoulder the burden of executing the next trade.
Bear in mind the two essential aspects of the OFA indicator:
Amplitude: A crucial hint in evaluating a trend's vitality is the extent of progress made by the dominant party controlling the trend.
We must ask: Are the new stages in the active buy-sell side campaign, as recognized by the script, increasing or diminishing in amplitude?
Momentum: When considering the range of price movements, amplitude accounts for only half of the equation. The remaining half involves the momentum or pace of the move.
We must ask: Was the new stage established following a rapid, impulsive shift? Alternatively, did the price achieve a new low or high with the movement being lethargic, constrictive, and time-consuming to develop?
A useful guideline is to count the number of candles it took to reach a new stage.
VISIT MY PROFILE FOR MORE INFORMATION ON THE OFA SCRIPT.

GLD Gold ETF Pullback for EntryGLD has been trending up and the chart shows that volume is increased in April / May as
compared with March and is about relatively 2X. GLD is now priced at its all time high.
On the trendline drawn, GLD is rising at a rate of approximately 5% monthly. Gold prices are
reacting to economic uncertainties and the dollar value having its challenges.
Today, price is down 1-2 % dropping towards the bottom of the Bollinger Bands providing
a good long trade entry. Stop loss is one dollar below the bottom band while targets are
at + 5% + 15% and +30% as a long duration swing trade expecting rising gold prices for at least
six months. See also my idea on XAUSUD / Cup and Handle

XAGUSD Spot Gold Cup and Handle Bull Trend ResumptionXAUUSD on the daily chart has a long-term cup and handle now in its final formation.
Spot gold price has risen above the lip of the cup and is in position to ascend from there
the height /depth of the cup for about another $100 on the current price based on
the pattern to occur over the width of the cup or about 6-8 months. Any gold related
instruments including miners, junior miners, ETFs like GLD, JNUG , NUGT and
gold itself on the forex markets should be in an overall uptrend. Any further degradation
in the AMEX:USD will further support Spot Gold rising.
Using the Bollinger Band oscillator or Luxalgo I will try to buy when XAUUSD is at the bottom
of the Bollinger Bands ( Red Histogram is high / Green Histogram is low ) and sell in
an opposite fashion with positions on and off to profit from the uptrend ongoing.

Trade Idea: GLD August 18th 210/June 9th 185 Long Put DiagonalWith GLD at or near all time highs, looking to buy the back month -90 delta put and sell the front expiry +30 delta to synthetically emulate a covered put with -60 delta or so. Will look to take profit at 110% of my cost basis (i.e., a 21.57 credit, resulting in a 1.96/$196 profit).
Metrics:
Max Loss: 19.61 debit
Break Even: 190.39 relative to 189.64 spot (pre-market)
Max Profit: The width of the spread (25.00) minus the debit paid (19.61) or 5.39 ($539)
Will adjust price at open if necessary to get a fill.

#HEXUSD priced in #SilverCan you preserve your capital and earn #yield
The #crypto market still offers opportunities to do so.
Both #gold and Silver are undervalued on a historical basis, and provide places to hide capital during times of #economic uncertainty ... a neutral asset.
But #bitcoin the versus #gold debate will rage for the next decade ... owning both is a good hedge.
Which leads us to #Altcoins for your high risk capital allocation much like junior mining stocks.

$Gold is the new $VIX LONG $GLDGold was sparkling today gold market looks very bullish TVC:GOLD AMEX:GLD which is the new TVC:VIX ultimate fear trade

The Gold Odyssey - the third lower highHeads up previously, had already mentioned previously, there was bullishness in Gold, but not enough and it was way too stretched to be at the top of the (constipation) range. The weeks went by and few things are very clear here:
1. There is a third lower high (not bullish)
2. Gold is breaking back into the range (really not bullish)
3. The MACD is weakening, the VolDiv has crossed down with a lower low (very not bullish)
4. The TD Sequential Setups are showing that the primary trend is still bearish, from the Buy Setup in early 2021. This was never reversed, although price closed above the TDST (green dotted line at 1962.50). So now the deal is like this... EITHER the current Setup completes over the next two weeks with Gold popping up definitively, OR it breaks down this week cancelling the current Setup, keeping the bearish primary trend, and closes below 1962.50. I suspect the latter will pan out... appears more probable to me.
Downside target 1820-1840, else if closes below 1800, can expect below 1700.
Wait and watch...

Gold $5,000 vs bitcoin $500,000 who gets there first?
First US banks have been closed by the FDIC for insolvency, let the panic begin and let the rush to hard assets start to unfold, who gets the capital first? Gold or Bitcoin? my money is on Bitcoin.

Gold Vs MoneySupply: a chart Peter Schiff Doesn't want u to seegold has upside.. expecting it to push toward its real valuation all time high..
over time gold has performed poorly at preserving capital. but academically recognized inflationary environments could be what was missing.

Imminent breakout setup in GDXSo many indicators and time frames are bullish GDX right now with bull divergences and montly MacD cross. Classic cup n handle formation with a backtest of cup in progress. Im no EW guru but it looks like we are at the beginning of wave 3. Good RR here with a stop at $31. Let me know what you think of analysis. Cheers.

Gold resistance - testing back below 2klast week was the first weekly close below 2k in GC since the recent breakout. Weekly chart highlights the multi-year range, big question is whether sellers have enough to re-take control of near-term trends this week. I don't doubt that Gold can prod a lasting move above 2k, I just don't think that'll happen until the Fed pivots and I'm not expecting that while Core CPI > 5%.
Am tracking a series of resistance levels overhead, 2008 near-term, 2023 above that. 2037, 2049 above that
supports 1980, 1954 and then 1944
next week is FOMC and ECB

XAU trouble for gold n silver is here The chart posted is now setup with a Negative Divergence see RSI I am buying puts in slv and gld this week

Walmart vs eurodollarNow, if the fed pivots may 2nd.. i'd expect walmart to fly sky high to new highs.. but theres a recession coming. Aint nobody going to buy walmart into new highs in the face of a recession. me thinks ****s about to hit the fan.

Gold In a Longterm Wave 5 Uptrend DXY weakness translates into strong gold and now with fears of dollar losing reserve status and Russia buying record amount of Gold, there is a confluence of indicators suggesting now is a good time to be long gold over the next year or two

Gold Headed For New Highs A pullback to 1950 would provide a good entry zone for then next wave up toward 2100

Topside Exhaustion in GoldThe Gold rally faltered today into uptrend resistance on building momentum divergence, just ahead of the 2022 high-day close at 2050.
Initial support with the March channel (red) with the broader outlook constructive while above the median-line (currently ~1920s)
Ultimately a close above the record high at 2075 is needed to unleash the next major leg higher in gold with initial objectives eyed at 2150.
Michael Boutros , Sr Technical Strategist with FOREX.com
Follow Michael on MBForex
@MBForex
