Glenmark Pharma >> Ready to Swing>>> Long & short Trade Glenmark Pharma >> Ready to Swing>>> Long & short Trade
GLENMARK

GlenmarkHello and welcome to this analysis
Glenmark after consolidating near its monthly support attempted a fresh upmove from 350 to 400, Post that it has made a sideways corrective forming a Bullish Harmonic ABCD.
The current reversal from 375 could be a higher low of the new uptrend in it and it could rally till 410-425-450 as long as it does not breach 374. Confirmation if it sustains above 390.
Good risk reward set up scenario of a higher low formation which could lead to a higher high thereon till its falling trendline

Glenmark possible up moveGlenmark possible up move broke up and retested the upper line of down trend

GLENMARK LONG TERM 1. Its forming a inverted head and shoulder , chances of stock moving up is higher
Invest as per levels
==============
LIKE IF YOU AGREE
==============

Glenmark Long Term Analysis1. At crucial support Zone
2. Current price less than intrinsic value
3. Volumetric profile average is 485 and trading near that level
4. Dividend yield of 5%

Buy Glenmark PharmaceuticalsGlenmark Pharmaceuticals is looking very bullish prior to its earnings.
Daily RSI has formed a huge inverted H&S with a breakout.
Down trendline broken
Price has crossed above 20 and 40 SMA on the daily chart
Three inside up candle pattern formation on the weekly chart

GlenmarkGlenmark breaking out of very strong resistance of 516 & trying to sustain above it.
Buy @ cmp 516.75 with sloss of 505 & tgt of 550


Glenmark Divergence Near SupportGlenmark is hovering near previous support level and RSIDIV-I showing clear divergence.
CMP- 523
SL-517
Target- 535

Glenmark Short Term ReversalThe stock has reached the lower trend line and might take support and undergo a reversal rally. Trade is supported by brokerage calls, 200 EMA and Supports Nearby.
Risk Reward Ratio - 2:1
SL is placed near below support zone, 200 EMA & the lower trendline. The target is placed based on fundamentals.

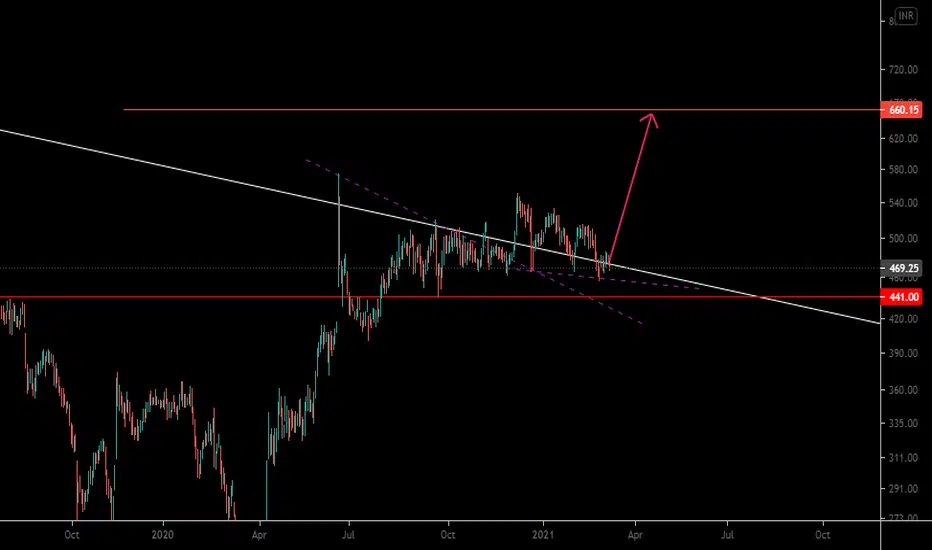
Glenmark Pharma... Crucial levelsGlenmark Pharma is weak structure on higher time frames..
659-660 levels very crucial to conquer for any bull run further...
Levels plotted..... Enjoy..
Please do Like... Share and Follow....


glenmark near very important price levelglenmark heading for monthly trend change above 700-720 zones

GLENMARK LONG INTRADAY 19 APR, 2021Dear trader,
If u look at the chart of GLENMARK (analysis based intraday only) the GLENMARK Buy at 583 and Target at 595
Best Buy at 578.
Our Best Buy is based on high quality research and when the instrument reaches this level , it’s a jackpot trade.
Best Buy level might be executed or might not be executed.
The chart clearly indicates Bullish Trend you can also see the candle stick patters for more indepth analysis.
In Intraday most important thing is to enter and exit points.
Our signals are based on analytics, algorithms, mathematical derivatives.
Always be a responsible trader, kindly trade only when you have maximum opportunity in the market with minimum risk and with keynotes like data, analysis and proper strategies.
Kindly message us for strategies and analysis.

GLENMARK LONG INTRADAY 16 APR,2021Dear trader,
If u look at the chart of GLENMARK (analysis based intraday only) the GLENMARK Buy at 536 and Target at 546
Best Buy at 532.
Our Best Buy is based on high quality research and when the instrument reaches this level , it’s a jackpot trade.
Best Buy level might be executed or might not be executed.
The chart clearly indicates Bullish Trend you can also see the candle stick patters for more indepth analysis.
In Intraday most important thing is to enter and exit points.
Our signals are based on analytics, algorithms, mathematical derivatives.
Always be a responsible trader, kindly trade only when you have maximum opportunity in the market with minimum risk and with keynotes like data, analysis and proper strategies.
Kindly message us for strategies and analysis.

GLENMARK - Breakout ?GLENMARK - bouncing back from lower levels
Above 516-517 --- we will see next target of 575 - beyond this can test 645-650 levels.
Add to watch list - trade carefully.

Glenmark ready for another 30% up?Glenmark broke its 4 downward trend in August 2020 and since then it is consolidating around the same levels.
Any thrust upside could be really quick and furious.
Form march lows, it has also taken 32% Fibonacci retracement level, which usually acts as strong support.
We can go long with a target of 680-700 with recent lows as a SL.

glenmark H&S patternGlenmark broke out a good ascending triangle pattern 2 days back
and now forming a nice head and shoulders pattern which kinda signifies it wants to come back and restest the levels again so that it can continue to move in the long way
for intraday, you can stay bearish tomorrow but on a long term I think this is going up

GLENMARKIm not an expert im just sharing my views on GLENMARK for tomorrow
Im not responsible for any profit or loss this is not a recommendation

R-0227 Short Term Cash Buy GLENMARK @505.00-507 SL 487 TGT 545Short Term Cash Buy GLENMARK @505.00-507 SL 487 TGT 545
TK cross over at 493 + Ichimoku cloud break out 497 + Above VWAP 500 + Resume uptrend post consolidation + Pivot 480 and next resistance 520/543/634

Glenmark at SupportGlenmark at Crucial Support of 459, if breaks, then can test 418, if consolidates at 459-465 then can give move up to 540 by 20th September 2020. Wait and watch if 459-456 levels are respected.

