$BTC Leading Macro Indicator Chart Predicted the Nuke to The DayYet again this chart predicted the nuke to the day 💣
I know I shouldn't be surprised at this point, but I'm still fascinated by how accurate technical analysis can be 🤓
Globalm2

$BTC 12-Week Lead Correlation w/ Global Liquidity, M2, GOLD, DXYHere’s a look at Bitcoin's price action against Global Liquidity, Global M2, GOLD and DXY - all with a 12-Week Lead.
Notice GOLD has a bit more of a deviation from the BTC price than the others.
This is because GOLD is used as a store of value asset, whereas the others are predicated on Central Banks expanding and contracting their money supply and balance sheets.
The key here is to smooth out the signal and ignore the noise.
Notice the convergence between these metrics the past couple months.

$DXY Up, M2 Money Supply DownWhen the DXY goes UP,
M2 Money Supply goes DOWN.
Remember the 12-Week Lead correlation with CRYPTOCAP:BTC

$BTC Tracks $GOLD Very Closely With 12-Week LeadCould it really be this simple?
Maybe we can just throw Global M2 out the window and track TVC:GOLD with a 12-Week Lead.
Someone pointed this out to me yesterday when I posted Gold's near 1/1 tracking with Global M2.
*Note the deviation in CRYPTOCAP:BTC PA from the ETF hype.

$GOLD Continues to Move in Lockstep With Global M2It's amazing how accurate TVC:GOLD follows Global M2 with NO LEAD.
Near instant liquidity injection into the asset as the money supply rises 🪙
I do not see the price of Gold falling until Global M2 does.

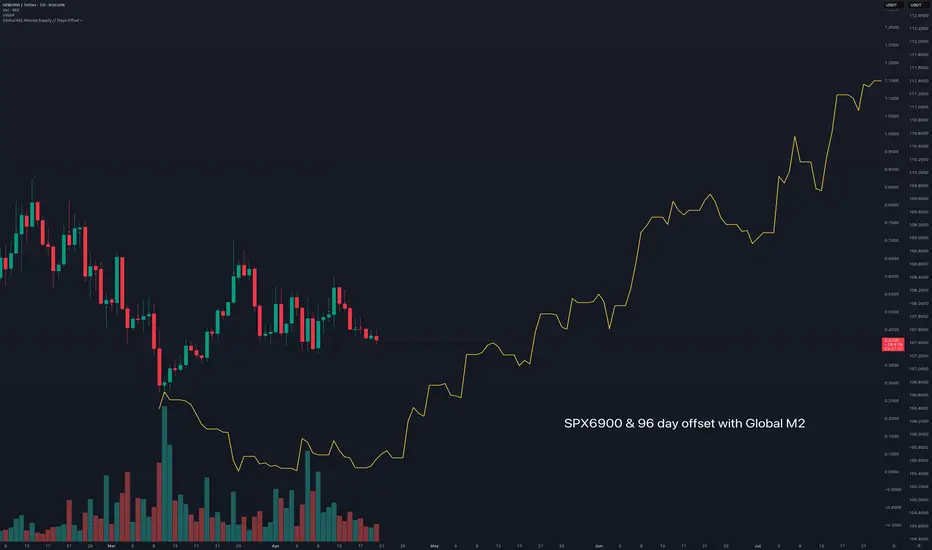
$SPX6900 following Global M2 money supplyFollowing Colin Talks Crypto's BTC & Global M2 money supply.
I'm using his script to generate global M2, in his version there is a 108 day - 86 day offset.
Here with SPX I adjusted to between that range at 96 days.
This sets up a strong outlook for SPX6900 going into the new few months.
Global M2 MONEY SUPPLY VS GLOBAL LIQUIDITYWhich is the best to track ₿itcoin price action?
Lots of macro gurus have been arguing over the two.
For comparison, I have indexes for both metrics on a 12-Week Lead, tracking the 4 largest central banks:
The Federal Reserve (including TGA & RRP), People’s Bank of China, European Central Bank and Bank of Japan.
Let’s start by defining each.
Global M2 Money Supply covers physical cash in circulation and cash equivalents such as checking and savings deposits, as well as money market securities.
Global Liquidity covers a broader measure of liquid assets driven by central bank balance sheets, private sector financial activity (e.g., lending, corporate cash), and cross-border capital flows.
Historically, both move closely in lock-step and act as a great leading indicator for ₿itcoin, however we can see that Global Liquidity can have more drastic fluctuations.
We saw a large divergence in CRYPTOCAP:BTC PA with both metrics when the Blackrock iShares ₿itcoin ETF appeared on the DTCC list, a procedural step signaling progress toward potential approval.
When you look at the charts of all three, you can see there are points where either metric might follow CRYPTOCAP:BTC PA a bit closer, so in the end I would say it’s best to track both to find confluence in the signal.

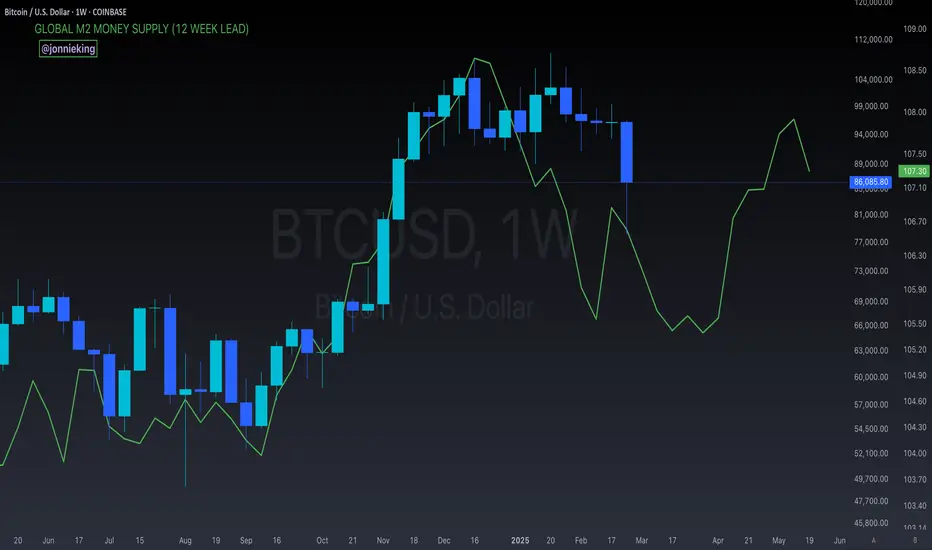
$BTC with Global M2 Money Supply (12-Week Lead)Shows a big liquidity injection coming in early April.
Might be a bit bumpy until then 🎢
THE LIQUIDITY PARADOX: Charting the Macro Environment for 2025WEN QE !?
TL;DR there will be NO Quantitative Easing this cycle.
YES the markets will still go to Valhalla.
LIQUIDITY DRIVES MARKETS HIGHER. FULL STOP.
Global M2 has a highly correlated inverse relationship with the US Dollar and 10Y Yield.
Hence why we have been seeing the DXY and 10YY go up while Global M2 goes down.
THE SETUP
We are in a similar setup to 2017 when Trump took office.
M2 found a bottom and ramped up, which toppled the DXY.
Inflation nearly got cut in half until July 2017, where it then slowly started to creep back up as M2 and markets exploded.
To much surprise, all this occurred while the Fed continued to RAISE INTEREST RATES.
This was in part due to policy normalization with a growing economy coming out of the financial crisis and having near 0% interest rates for so long.
In Q4 2014, the Fed paused QT, keeping its balance sheet near neutral for the next 3 years.
As inflation started rising, QT was once again enacted, but very strategically with a slow roll-off in Q4 2017. This allowed markets to push further into 2018.
THE PLAYBOOK
M2 Global Money Supply: Higher
Dollar: Lower
Fed Funds Rates: Lower
10YY: Lower
Fed Balance Sheet: Neutral
Inflation: Neutral
TOOLS
Tariffs
Deregulation
Tax Cuts
Tax Reform
T-Bills
HOW COULD WE POSSIBLY WEAKEN THE DOLLAR?
Trump has been screaming from the mountain tops; TARIFFS.
Tariffs will slow imports and focus more on exports to weaken the dollar.
The strong jobs data that has been spooking markets and strengthening the DXY will be revised to show it’s much worse than numbers are showing.
The Fed will pause QT, saying it has ample reserves, but not enable QE.
At the same time, they could pause interest rate cuts to keep a leash on markets and not kickstart inflation.
Then once all the jobs data is revised and markets get spooked at a softened economy (Q2), they will continue cutting.
WHY DOES THE FED KEEP CUTTING RATES EVEN WITH A STRONG ECONOMY?
In short, the Fed has to cut interest rates for the US to manage its debt.
THE US government is GETTEX:36T in debt.
In 2025, interest projections are well above $1T.
That would put the debt on par with the highest line items in the national budget such as social security, healthcare and national defense.
The Treasury manages its debt by issuing securities with various maturities. When rates are low, they can refinance or issue new debt.
As rates rise, the cost of servicing debt increases, and vice versa.
It’s one of the underlying reasons why the Fed cut (but no one will say it out loud)…
hence why everyone is so confused and screaming that they cut too early and the bond vigilantes have been revolting.
HOW DOES THE MONEY SUPPLY GO UP IF NO QUANTITATIVE EASING?
We’ve seen this before.
President Trump and Treasury Secretary Scott Bessent have been telling you their playbook.
In 2017, deregulation and tax cuts led to an increase in disposable income from individuals and corporations.
Banks created more money in the markets through lending based on increased economic activity.
Global liquidity increased in other major central banks like the ECB, BOJ, and PCOB who were still engaged in QE, and / or maintained very low interest rates, which created more liquidity in the US money supply.
We’re seeing the same thing now with Central Banks around the world.
The tax reform allowed for the repatriation of overseas profits at a lower tax rate, which brought a significant amount of cash back to the US.
Like 2017, the US Treasury will increase short-term bill issuance (T-Bills), providing an alternative to the Reverse Repo (RRP), which reduces RRP usage. This provides liquidity to the markets because once the T-bills mature, funds can use the proceeds to invest in other assets, including stocks.
Banks will buy T-bills and sell in the secondary market or hold til maturity, where they can then lend the cash or invest in equities.
Another strategy to inject cash into the banking system would be standard Repo Operations. Here the Fed buys securities from banks with an agreement to sell them back later. This would increase lending and liquidity.
Hopefully now you can see why markets DON’T NEED QUANTITATIVE EASING !
That would for sure lead to rampant inflation (see 2021), and blow up the system all over again.

BTC Long - Comparing to Global M2GLOBAL MONEY SUPPLY vs CRYPTO Relation
Global Money Supply Breaking Upwards
has historically led to
All of Crypto Breaking Upwards CRYPTOCAP:BTC CRYPTOCAP:SOL CRYPTOCAP:ETH etc
Right now, Global Money Supply (Global M2) is breaking upwards to new all-time highs.
Publishing to follow, as I am relatively 'newer' at using macro tools such as Global Money Supply (Global M2) in relation to projecting crypto greater cycles
Cheers
-@CryptoCurb
