Gold - We're in the end game nowWill they dump the rock for the block ? (#Crypto)
With current Global news
and economic sanctions,
inflations,
energy waste to create value (Gold mining cost / vs Crypto Mining cost).
Hate to keep repeating the question we are all asking. Who will win.
I bet that our grandchildren
will laugh when they learn history
that we once used rocks ( Gold )
to determine what had value once ( Food, Homes, Transport, Wealth)
who ever has the most rocks is the richest....
Uhmm kayy ?
Why couldn't they just be coins
on an app
on your phone
to save space, transport cost ?
And now, the less fortunate get to buy more gold @ cheaper prices ( Their wants in life ? ) as an oppose to gifting your loved one uhmm... ??? A SILVER BRACLET ??? Sorry for raging @ the end
I mean, what wrong with being rich? Forever ?
I see money flowing out of everything. And I also see IMMENSE buying pressure in Crypto in recent days
I'm betting on the future.
And Letting the past go.
Globalmarket

BTC bounced from resistanceBTC managed to reach $39.2k but wasnt able to break and dropped, Meta (Facebook parent company) stock dropped 25% today (last 24hrs), due to a poor Q1 report from them, which is the reason for todays weakness.
Global market is also showing weakness.
According to chart, BTC is still stuck in the downtrend (falling wedge), this pattern needs to be broken and will make BTC very bullish if it is. $39-41k is the major resistance and $33-35.5k is current support levels, with $30k being a major support. Entries are possible in either a breakout or when BTC touches the support.
Trade between the lines, trade safely

Total Crypto Market Capitalization The Gift that keeps on Giving... Inflation from the Good'Ol USA... This is the current sentiment at this particular time/space. LFG..LFG...

Crypto Total Market Capilization This is the current sentiment in this current time/space. Momentum will be the key. This will be provided by the gift that keeps on giving ...Inflation...

Global Markets Falling Off A CliffChina, Europe, Asia, Africa could see a -10% to -22% collapse over the next 60+ days if consumers shift assets away from risks associated with the current COVID & debt/credit issues plaguing foreign markets. China, in particular, could be on the cusp of a "Great Recession". This could drive other foreign markets deeper into trouble in early 2022.
My opinion is the US markets may see some extended downside price volatility, but may quickly recover and trend higher if these global crisis events are somewhat isolated and contained. Certainly, traders need to be prepared for extreme volatility over the next 90+ days.
I believe China is in far worse shape than many people currently believe. These debt/credit issues are entrenched in finance/banking in China/Asia. I believe the more mature Asian economies could be headed for complete debt collapse over the next 2+ years.
Pay attention. Follow my research.

Total Market Crypto Capitalization Things are setting up properly. Steady she goes... Momentum will be the key. Moving through the MA

Crypto Total Market CapThis is the current sentiment in this current time/space. The Momentum is Building....

Support team group beyondSupport all bank customers. Because of the epidemic, many people are unable to pay interest. Then we support the bank’s December interest to reduce the burden on the people.

Ablibaba Stock Long-term analysisBasically, Hong Kong indexes have more down to go. But in the long run, they have huge upside potential in the 4-5 years6

Dow jonesWith major trend lines already broken in dow jones breaking of a daily candle low can cause significant downfall in dow jones
It can also enter the scenario of sell at rise after it breaks the daily low
Stay cautious with the longs

The global market crash of 2020 and the invisible recessionThe global market crash of 2020 and the invisible recession:
Laying over a select number of my tweets from 2019 and 2020 with calls for the a 40% correction, the start of the recession, and tentative dates for the global market crash.
I was off by a few days, but it's hard to predict the future. Obviously, right?
Also, I had my confirming signal exactly two years ago in July 2019 which is why I am sharing this now.
2 years since from confirmation.
I used various dark patterns, analyses, and techniques which gave me then the confidence that there was a black swan underway.

SP500 SHORT MEGAPHONE PATTERN AGAIN! DAILY CHART!SP500 gets again to the MegaPhone pattern top trendline, big fall can come from here

SP500 SHORT POSITIONSSP500 after a nice up move from Daily MA400
Now at the up trend line of the pattern, looks like its gonna be a false break since the monthly chart at the big Fibo E level resistance

Top Global Markets Behaviour To Gauge SentimentsI tried to explain how global markets change trends and move parallel.
It might help you to understand how all the stock markets are interconnected.

Bitcoin For Intraday Trading 5-8-13 EMA5-8-13 EMA FOR INTRADAY
TIME FRAME SUGGESTED: 15 MIN
Buy Trading Plan:
1. Buy when the yellow line crosses up with the blue line
2. Best to buy when all the line pink, blue & yellow meet and crosses up
Sell Trading Plan:
1. Sell when the yellow line crosses below the blue line
Notes:
Pink Line ( EMA 13): Long term
Blue Line ( EMA 8): Midterm
Yellow Line (EMA 5): Short term
When the arrangement of the lines in a sequence of bottom pink, middle blue & top is yellow hence the stock consider as in the uptrend
When the arrangement of the lines in a sequence of top pink, middle blue & bottom is yellow hence the stock consider as in the downtrend
Hold the stocks when the lines in this sequences;
Top = Yellow
Middle = Blue
Bottom = Pink
*Just ride the trend until it bends

Volatility Index Peaking Above 12 again. Watch Out BelowThis Custom Index helps to gauge market peaks (above 12~13 usually) and bottoms (below 7~8 usually). When this Custom Index hovers above 10~11, the market tends to trend higher with volatility event ranging from 7% to 11% in price breakdowns. The fact that this indicator has broken a historic standard deviation channel because of COVID and quickly regained price activity within this channel again suggests that the markets have become extremely overvalued (hyper-inflated). A reversion event is likely to draw this indicator back below 8~9 which would suggest a downside price event is likely to setup over the Summer months in global markets.
Given the amount of Central Bank and US Fed intervention recently, I'm expecting a deleveraging event (possibly related to a credit/asset crisis) that may shock the markets over the next 24 months. My broader cycles research suggests we have entered a Depreciation phase that may last well past 2027. Therefore, it is very likely that extreme volatility events are likely.
Stay properly hedged. This is not a friendly market any longer (simple upside trends). This market has turned very dangerous for unskilled traders.
My advice, prepare for chaos and protect your assets ahead of a risks/crisis event. The next 5+ years are not going to be normal market trends. We may see crisis events throughout many areas of the world related to over leveraging, deleveraging, credit market crisis and/or continued COVID/economic crisis events.
In short, this market is setup for a massive deleveraging event within the next 24 months.

Is the overall market due for a bigger selloff?Price has reached the previous order block where the last directional initiation was created to the downside.
I am expecting the price to start going to the downside from here.
We are also in a debt bubble/crisis that is ready to burst at any moment.
The markets are artificially lifted up by government funding. This is not sustainable as the actual economy has been hit really hard by the pandemic.
We are approaching the end of an 80-year cycle and anything at this point could trigger a massive collapse like in 1929.
The technical analysis is from the Wyckoff method theory which has been good to me in the past.
I just think we are due for a big blood bath and a redistribution of wealth, and more substantial than the 2008 financial crisis!


10-yr market cycle for FX, commodities, value, & global stocks?The US dollar tends to trade in a ten-year cycle relative to global currencies. It outperforms for ten years, then underperforms for ten years, then outperforms, and so on. This year we seem to have ended a cycle of outperformance when the US dollar broke its ten-year trend line (orange line on the chart).
The dollar is inversely correlated to all sorts of other things, including alternative currencies (including Bitcoin), commodities (including metals), global equities (developed, emerging, and frontier markets), and perhaps the value/growth ratio (mostly because value companies like energy majors and miners benefit from strong commodities prices). That means that the ten-year dollar cycle also tends to create ten-year cycles in these other markets.
The downward dollar breakout has already led to an upward breakout in the ratios of global and emerging markets equities to US equities (purple and green lines on the chart). A recent survey of investment managers showed that they believe emerging markets will be the best performer over the next ten years. Commodities also rank highly in those investment manager surveys, and we are nearing a trend line break for commodities (red line on the chart). The value/growth ratio (black line on the chart) has been showing a little life as well, and it's possible that we will also head toward a trend line break in that ratio.

BTC ATH Breakout!There is an urgent news - the Bitcoin price broke up the 2017 global ATH of $19798. At this moment the new maximum price is $19863. We will follow it to make a forecast for the future BTC price movement.

A Trader's ThanksgivingThanksgiving is a distinctly American holiday, where our nation takes pause to reflect on all the things we have to be thankful for due to the actions of a courageous band of dedicated men and women who crossed a dangerous ocean to an unknown continent for the simple hope... of freedom. As traders, I am glad that we all, regardless of our national origin, our political bent, our religious affiliation, (or most importantly, a preference of Star Wars over Star Trek), we indeed have so much to be thankful for.
In my early days of trading classes a common statement from my classmates to our instructors was "I wish I started trading 20 years ago like you did!" And inexorably the instructor would say, "No you don't... *today* it's so much better to learn how to trade... The entry level is so low... you don't have to go to an exchange every day... you have immediate access to a global market with a simple app download or a click of a browser," and the list went on...
As a trader, I am thankful that we can make money regardless of economic ups and downs, that every day can be a "green day" in our account even when the S&P, Crude Oil, or whatever it was that had a red-candle day because we have the ability to go short as well as long!
As a trader, I am thankful that we have access to a world of free information like BarChart or CMEGroup that can tell us things like what is the current contract, when are economic reports coming out, and technical analysis.
As a trader, I'm thankful to all the free tools available, like the free version of TradingView, Google Docs and Spreadsheets, YouTube, and so on.
As a trader, I'm thankful for the overall giving nature of our community, that traders generally and genuinely like helping fellow traders. Unlike Corporate America where it is dog-eat dog, or owning a business in a niche market where there is great competition to attract a limited number of customers, the opportunity for all traders are for all intents and purposes, *infinite*, and we all share in the collective success of the entire group!
As a trader, I'm thankful that I have no one to ask permission to take time for a family emergency, a medical emergency, a vacation, or anything that would normally interrupt or cripple a business owner's income or an employee's job security, and when I'm ready to get back to trading, the market will be right there waiting for me.
As a trader, I'm thankful that we have access to markets nearly 24x7 so we can work as much or as little as we like or need, and opportunity isn't governed by asking someone for the privilege to work for *them*.
Dear Reader, fellow Trader, what are YOU thankful for? Share your thoughts with our awesome community below!
Happy Thanksgiving, wherever you are!
-Anthony

Dollar Index Resembles This Moment in Time Some traders may remember the historic selloff in the U.S. dollar that began in late 2002. Current conditions appear similar.
Notice on this chart how the U.S. dollar index pushed to a new 52-week low and then consolidated. Notice how the 50-day simple moving average (SMA) tried to turn higher but failed. Notice how DXY also tested the 100-day SMA and failed.
Now look at this chart from 2001-2002, showing similar events. Also consider that both 2002 and 2020 followed periods of dollar strength and troubles overseas. The late 1990s had the global debt crises, while the last 5-8 years had ongoing weakness in Europe.
Speaking of Europe, everyone’s waiting for a deal between Westminster and Brussels to avert a “hard Brexit” on December 31. An agreement ending the uncertainty would probably spur confidence in the euro and drag the dollar index lower.
Finally, consider that the dollar’s breakdown in late 2002 was followed by several years of global stocks outperforming. Something similar could occur now, especially given the ongoing strength in Chinese stocks and relative “cheapness” of European stocks (based on P/E ratios).
TradeStation is a pioneer in the trading industry, providing access to stocks, options, futures and cryptocurrencies. See our Overview for more.

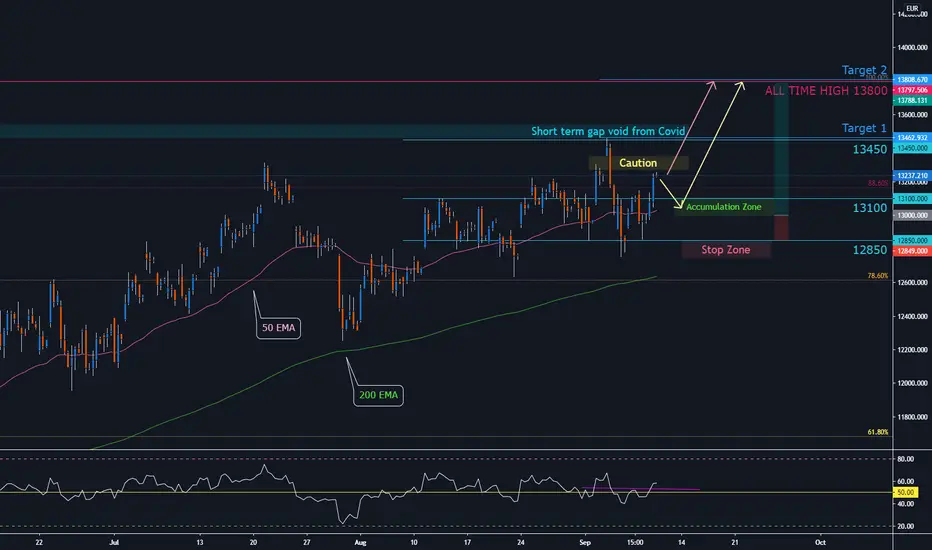
DAX Sights All Time High 13800Hello Fellow Traders!
Indices experienced slight recovery last night with SPX (US500) up 2%, Nasdaq up 2.94%, UK100 up 1.39% and DAX 2.07%
The SPX (US500) has broken pre Covid highs aided by the US tech sector, while the broader market has struggled to test related levels.
The DAX has positioned itself for an advance to reclaim historical levels.
Caution: This zone will act as resistance. Also, this trade is suggesting the global markets will bounce in the short term.
Key Points:
- Price holding above the 200 EMA
- Price holding above the 50 EMA
- Above all Fibonacci levels from the Covid range drop. Next resistance is the All Time High.
- Covid Gap from initial drop has yet to be filled.
- RSI positioned for upside
Key Levels:
Support – 13100, 50 EMA, 12850, 200 EMA
Resistance – Caution Zone, 13450, Above Covid Gap, 13800
Entry Zone:
Optimal entry provides the greatest reward to risk ratio while supporting entry is a zone for reversal signals.
Optimal Entry – 13000
Supporting Entry – 13100
Candle Reversals for entry
- Bullish Hammer
- Bullish Engulfing
- Bullish Piercing
The Risk:
As traders, it is your job to mitigate the risk and only trade structures that provide high probability and great reward to risk ratios.
If you are not comfortable with defined exit levels, experiment with Moving Averages to help set solid exit rules to protect your capital.
IF: Price breaks above 12850 level and/or violates 50 EMA – this would suggest the structure is not in our favour and would be wise to reduce exposure or close the trade until a solid signal gives us reasons to re-enter.
Reward / Reward Targets:
Optimal Entry 13000 – Target 1 13450 = 3x Reward to Risk
Optimal Entry 13000 – Target 2 13800 = 5x Reward to Risk
Supporting Entry 13100 – Target 1 13450 = 1.5x Reward to Risk
Supporting Entry 13100 – Target 2 13800 = 2.7x Reward to Risk