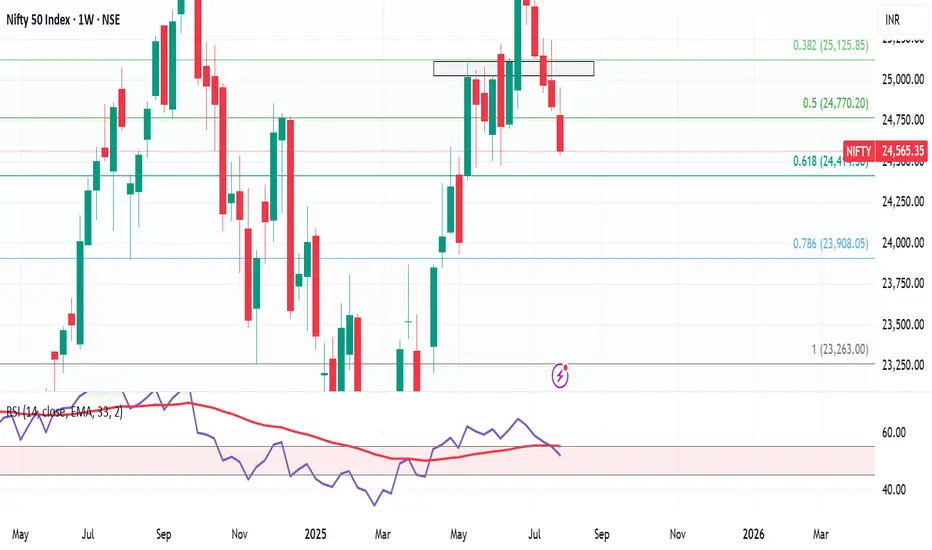
Weekly Market Wrap – Nifty Slides, Global Sentiment WeakensNifty ended the week on a bearish note, closing at 24,565, down 270 points or nearly 1.1% from last week's close. It touched a high of 24,956 and a low of 24,535, perfectly respecting the range I shared last week: 25,300–24,400.
As I highlighted earlier, the inverted hammer formation gave the bears an upper hand—and the index corrected 1.74% from the recent highs. My view continues to favor caution, with the expected trading range for the upcoming week at 25,000–24,100.
Key Levels to Watch:
Support Zone: 24,400 (key bounce area), followed by 24,100 / 23,900 in case of further breakdown.
Resistance Zone: Upside capped near 25,000.
If the market holds 24,400 around 6th–7th August, expect a short-term bounce. However, if this level is breached, expect dips to 24,100 or 23,900, which could offer short-covering opportunities.
Global Cues:
The S&P 500 also had a rough week, closing at 6,238, down 2.5% week-on-week. This decline sparked a wave of selling across global markets. The 6,200 level is crucial—if it holds, we might see a rebound globally, including in Indian equities. Below that, 6,100 remains the breakout retest zone, which I believe should provide some cushion.
💡 Strategy Going Forward:
Focus on stocks showing relative strength in this falling market—they’ll likely lead the rally once sentiment turns.
Avoid chasing rallies, and watch for signs of bottoming out near key support zones.
Keep an eye on global indices like the S&P 500 and Dow Jones, as their stability will dictate near-term direction for Indian markets.
Stay sharp, stay prepared. Let the bears have their moment, but be ready to pounce when the tide turns.
Globalmarkets
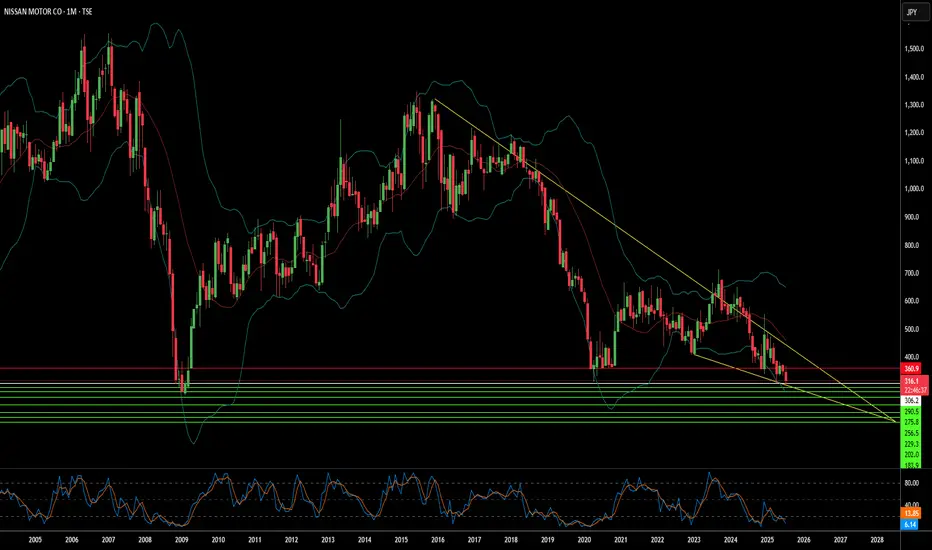
Is Nissan's Future Fading or Forging Ahead?Nissan Motor Company, once a titan of the global automotive industry, navigates a complex landscape. Recent events highlight the immediate vulnerabilities. A powerful 8.8-magnitude earthquake off Russia's Kamchatka Peninsula on July 30, 2025, triggered Pacific-wide tsunami alerts. This seismic event prompted Nissan to **suspend operations at certain domestic factories in Japan**, prioritizing employee safety. While a necessary precaution, such disruptions underscore the fragility of global supply chains and manufacturing, potentially impacting production targets and delivery schedules. This immediate response follows a period of significant operational adjustments as Nissan grapples with broader economic, geopolitical, and technological headwinds.
Beyond natural disasters, Nissan faces substantial financial and market share challenges. Although Fiscal Year 2023 saw operating profit and net income increases, global sales volume remained largely stagnant at 3.44 million units, signaling intensified market competition. Projections for Fiscal Year 2024 indicate a **forecasted revenue decline**, and recent U.S. sales figures show an 8% year-on-year drop in Q1 2025. Macroeconomic pressures, including inflation, volatile currency fluctuations, and a significant hit from **billions of dollars in lease losses** due to plummeting used car values, have directly impacted profitability. Geopolitical tensions, particularly the threat of a 24% U.S. tariff on Japanese auto exports, further threaten Nissan's crucial North American market.
Nissan's struggles extend into the technological arena and its innovation strategy. Despite holding a **remarkable patent portfolio** with over 10,000 active families, the company faces criticism for **lagging in electric vehicle (EV) adoption** and perceived technological stagnation. The slow rollout and underwhelming market impact of new EV models, coupled with a notable absence in the booming hybrid market, have allowed competitors to gain significant ground. Moreover, the brand has contended with **multiple cybersecurity breaches**, compromising customer and employee data, which damages trust and incurs remediation costs. Internal factors, including the lingering effects of the **Carlos Ghosn scandal**, management instability, and costly product recalls—like the recent July 2025 recall of over 480,000 vehicles due to engine defects—have further eroded investor confidence and brand reputation. Nissan's journey ahead remains uncertain as it strives to regain its competitive edge amidst these multifaceted pressures.
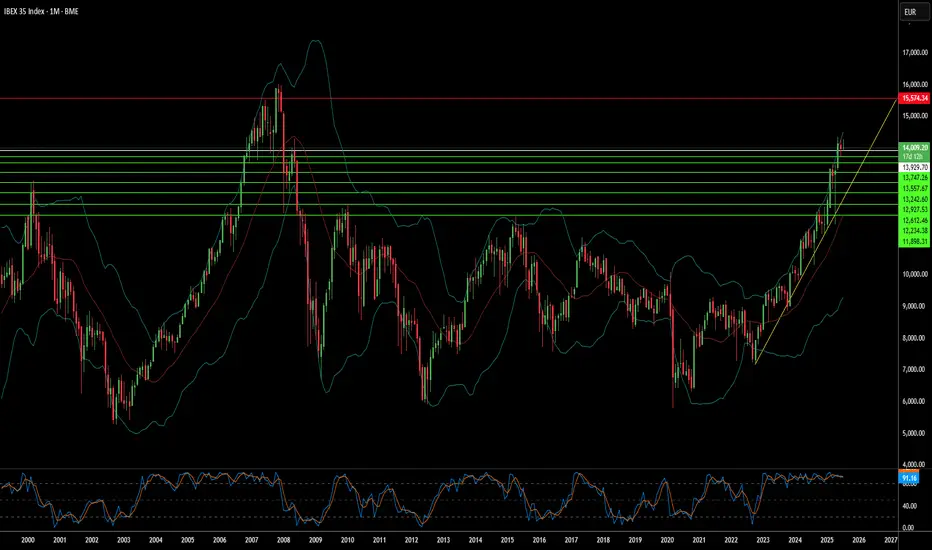
Why Spain's Market Faces a Challenging Horizon?The IBEX 35, Spain's benchmark equity index, navigates a complex landscape. Despite encouraging macroeconomic indicators, including robust GDP growth and declining unemployment, underlying vulnerabilities persist. Political instability forms a significant headwind. A fragmented parliament, ongoing corruption scandals, and the specter of early elections create an environment of legislative gridlock. This uncertainty directly impacts investor confidence and hinders the effective implementation of crucial reforms and budget approvals, contributing to the IBEX 35's underperformance compared to its European counterparts in 2025.
Social tensions further exacerbate the country's domestic challenges. Recent anti-migrant protests, such as those in Torre Pacheco, underscore a societal fragmentation that can deter foreign investment and impact labor dynamics. While immigration is vital for Spain's economic growth, rising anti-immigrant sentiment, potentially exploited by far-right political factions, introduces unpredictability into social cohesion and future policy directions. This confluence of political and social unease creates an unstable backdrop for businesses and investors.
Beyond internal dynamics, global factors add to the pressure. Lingering uncertainties surrounding international trade, including potential US tariffs, pose risks for Spain's export-oriented sectors and its globally exposed corporations. Furthermore, while Spain champions renewable energy, persistently high electricity prices due to domestic policies continue to challenge industrial competitiveness. The historical context of ineffective deployment of significant EU NextGenerationEU funds, hampered by political hurdles, also raises concerns about Spain's long-term growth trajectory and its ability to capitalize on recovery initiatives.
These combined elements suggest a difficult period ahead for the IBEX 35. Sectors sensitive to domestic policy, such as construction, banking, and real estate, face direct exposure to political uncertainty. Moreover, Spain's traditional reliance on tourism and agriculture makes it susceptible to external shocks, including global travel disruptions and climate change impacts like severe droughts. Investors must carefully assess these multifaceted risks, as they are likely to shape the IBEX 35's performance in the near to medium term.
Why Your Orange Juice Costs More?The price of orange juice is surging, impacting consumers and the broader economy. This increase stems from a complex interplay of geopolitical tensions, macroeconomic pressures, and severe environmental challenges. Understanding these multifaceted drivers reveals a volatile global commodity market. Investors and consumers must recognize the interconnected factors that now influence everyday staples, such as orange juice.
Geopolitical shifts significantly contribute to the rising prices of orange juice. The United States recently announced a 50% tariff on all Brazilian imports, effective August 1, 2025. This politically charged move targets Brazil's stance on former President Jair Bolsonaro's prosecution and its growing alignment with BRICS nations. Brazil dominates the global orange juice supply, providing over 80% of the world's trade share and 81% of U.S. orange juice imports between October 2023 and January 2024. The new tariff directly increases import costs, squeezing margins for U.S. importers and creating potential supply shortages.
Beyond tariffs, a convergence of macroeconomic forces and adverse weather conditions amplify price pressures. Higher import costs fuel inflation, potentially compelling central banks to maintain tighter monetary policies. This broader inflationary environment impacts consumer purchasing power. Simultaneously, orange production faces severe threats. Citrus greening disease has devastated groves in both Florida and Brazil. Extreme weather events, including hurricanes and droughts, further reduce global orange yields. These environmental setbacks, coupled with geopolitical tariffs, create a robust bullish outlook for orange juice futures, suggesting continued price appreciation in the near term.

Can Geopolitics Redefine Market Risk?The Cboe Volatility Index (VIX), which analysts widely dub the "fear gauge," currently commands significant attention in global financial markets. Its recent surge reflects profound uncertainty, particularly from escalating geopolitical tensions in the Middle East. While the VIX quantifies market expectations for future volatility, its current elevation signals more than mere sentiment. It represents a sophisticated repricing of systemic risk, capturing the implied probability of significant market dislocations. Investors find it an indispensable tool for navigating turbulent periods.
The dramatic escalation of the Iran-Israel proxy conflict into a confrontation, involving the United States, directly fuels this heightened volatility. Israeli airstrikes on Iranian military and nuclear facilities on June 13, 2025, prompted swift Iranian retaliation. Subsequently, on June 22, the U.S. launched "Operation Midnight Hammer," conducting precision strikes on key Iranian nuclear sites. Iran's Foreign Minister immediately declared diplomacy over, holding the U.S. responsible for "dangerous consequences" and vowing further "punishment operations," including a potential closure of the Strait of Hormuz.
This direct U.S. military intervention, particularly targeting nuclear facilities with specialized munitions, fundamentally alters the conflict's risk profile. It moves beyond proxy warfare into a confrontation with potentially existential implications for Iran. The explicit threat to close the Strait of Hormuz, a critical global chokepoint for oil supplies, creates immense uncertainty for energy markets and the broader global economy. While historical VIX spikes from geopolitical events often prove transient, the current situation's unique characteristics introduce a higher degree of systemic risk and unpredictability. The Cboe VVIX Index, measuring the VIX's expected volatility, has also risen to the higher end of its range, signaling deep market uncertainty about the future trajectory of risk itself.
The current environment necessitates a shift from static portfolio management to a dynamic, adaptive approach. Investors must re-evaluate portfolio construction, considering long exposure to volatility through VIX instruments as a hedging mechanism, and increasing allocations to traditional safe havens like U.S. Treasuries and gold. The elevated VVIX implies that even the predictability of market volatility is compromised, demanding a multi-layered risk management strategy. This specific confluence of events might signify a departure from historical patterns of short-lived geopolitical market impacts, suggesting geopolitical risk could become a more ingrained and persistent factor in asset pricing. Vigilance and agile strategies are paramount for navigating this unpredictable landscape.

Understanding Gold Panic Selling Reactions BetterThis video is designed to help you better understand how Gold works as a hedge instrument and how to attempt to measure Panic Selling phases in Precious Metals.
Metals offer an incredible opportunity when Panic Selling hits. But it can also present some very real risks because of price volatility.
Panic selling in the markets is usually an event-driven sell-off in almost all markets (including metals).
This type of selling is usually related to traders pulling assets (CASH) away from all market sectors because of some crisis or geopolitical event. It is a way for traders to react to the fear of the event while sometimes ignoring how metals will react to the future revaluation event.
Yet, who wants to hold Gold when it may fall 8.5% to 15% throughout this panic selling process?
If you learn how to spot the base/bottom efficiently (using my Excess Phase Peak patterns), you'll be able to pinpoint some incredible opportunities in metals.
I hope this video helps you to understand exactly how these Panic Selling events unfold - and lear to spot/trade them more efficiently.
The reality of the current market environment is that the Trump win is the event (call it a crisis or not - I don't care). This event is causing markets to revalue current asset classes (notice the strength of the US Dollar since Election Day).
I believe this revaluation event is nearly over and prices will begin to adjust into what I'm calling my "Anomaly Event" - where price levels settle back into a reversion (normal) type of contraction event before moving into a late-stage Santa Rally.
If I'm right, we'll see a base/bottom in metals happen after November 15-19, 2024.
Get some.
#trading #research #investing #tradingalgos #tradingsignals #cycles #fibonacci #elliotwave #modelingsystems #stocks #bitcoin #btcusd #cryptos #spy #es #nq #gold

Gold & Silver Ripping Higher. Should You Be Cautious Of A CrashThis video highlights the recent rally in Gold and Silver and covers some basic information related to the risk of a US/Global market crash event.
Take a minute to try to understand why Gold & Silver are rallying away from the Breakaway phase and into the Expansion phase.
This is a huge opportunity for traders if they understand why Gold and Silver are rallying like they are.
This is not a move of Panic and global market contagion. This move is related to metals being extremely undervalued compared to global market risk factors. Metals must appreciate in order to properly reflect the risks related to the global markets.
Gold may rally well above $5500 and Silver may rally well above $65 before the end of 2026. Are you ready for that move?
Pay attention & Get Some.
#trading #research #investing #tradingalgos #tradingsignals #cycles #fibonacci #elliotwave #modelingsystems #stocks #bitcoin #btcusd #cryptos #spy #es #nq #gold

What Hidden Forces Are Reshaping the Soybean Market’s Future?The soybean market stands at a crossroads, where familiar patterns of supply and demand are being challenged by a web of global forces. U.S. crops, though abundant, face domestic difficulties as adverse weather threatens yield projections. South America, poised to increase production, is battling its climate concerns, leaving traders and analysts questioning what the true state of global supply will be. Despite the current pessimistic outlook, is there more to this story than meets the eye?
On the demand side, the rising global appetite for vegetable oils, fueled by population growth and the biofuel industry, adds another layer of complexity. Yet, regulatory changes like the EU’s deforestation rules and China’s ongoing economic struggles continue to shape the trade landscape. How will these evolving dynamics impact global soybean trade flows, and what are the risks and opportunities hidden within?
As technological advancements in biotechnology and precision agriculture push the boundaries of efficiency and productivity, the soybean market finds itself on the cusp of transformation. Investors and traders must decipher this intricate puzzle, where geopolitical shifts, weather risks, and innovation collide. Will those who grasp the nuances of these forces be the ones to seize the emerging opportunities?

Nifty RSI Super-Heated to 83% - Crash Coming ????On the Quarterly chart - the RSI indicator on Nifty is showing a value of 83% or more indicating it's in Over Bought Zone
Back in Jan 2008, the RSI went to a high of 87% and Nifty subsequently crashed -52% from the Highs. After 16 years, the RSI on Nifty is climbing up beyond the 83% mark which indicates "Danger of a Correction" according to many Expert Analysts from Media Channels, Twitter and Telegram
Please forward the below analysis to All those Pessimistic Technical Super-Zeroes
--------------------------------------------------------------------------------------------------------------------
I say - What a "Ridiculous" Comparison of 2008 vs 2024??? The entire Technology world looks toward India as a Hub of Technical Brains, but those brains are just filled with Age-old Folklores and Pessimism.
Technical Analysis is NOT a Geometry class to connect 2 dots from 20-30 years ago and say we had the similar situation back then and there was a Crash and the same thing will Repeat now. The entire market Dynamics has changed a lot.
1. First of all what's an Indicator?
An Indicator is nothing but a Human written Algorithm (A Script) which consumes Buyers & Sellers Activity and volume of trades historically and does some simple "math". How does this Dumb Number Crunching algorithm understand external factors?
2. What Really Caused the fall in 2008?
Think again closely - The 2008 crash was a Global Catastrophe caused by the Massive Conspiracy and Bankruptcy of Lehman "Buggers" (Brothers) in US which had a world wide impact. For those Technical Pundits who believe 2008 fall was due to RSI - read the Analysis below fully
In this image - there is a comparison of Nasdaq Vs Nifty 50 between 2000 to 2008 and the RSI line is that of Nasdaq (not Nifty)
In 2000, the market fell so badly in US and the RSI was around 98%. But in 2008, look at the RSI - it was hovering around the Healthy 60% mark which is treated as the Golden Levels of "Fresh Entry" by most technical analysts
But US & the entire world crashed in 2008 due to Lehman Brothers issue - As the subprime mortgages underlying these securities began to default at alarming rates, investor confidence plummeted leading to a loss in trust in Lehman Brothers. Unable to fully recover all of their losses, Lehman Brothers were forced to file for bankruptcy
Nifty was trading at RSI 90% back then, but US was trading at 60% RSI. So the fall here is NOT because of Indian RSI - but due to a Global event.
RSI is like a Speedometer - it just indicates that you are driving at 80 / 100 and in every vehicle speedometer - there will be a RED zone which indicates Dangerous driving conditions. Does not mean, the Engine will fail. It just says that driving so fast is not safe.
We should learn to do a Full Analysis - not just a Half-baked one connecting some dots with something else claiming Technical superiority
Nothing is going to happen to US especially NOTHING will every happen to Indian Market until Apr 2028 where Nifty will face a 34 year long Parallel Channel Resistance as indicated in the main chart
Disclaimer:
Stocks-n-Trends is NOT registered with SEBI. We do not provide Buy / Sell recommendations - rather we provide detailed analysis of how to review a chart, explain multi-timeframe views purely for Educational Purposes. We strongly suggest our followers to "Learn to Ride the Tide" and consult your Financial Advisors before taking any positions.
If you like our detailed analysis, please do rate us with your Likes, Boost and share your comments
-Team Stocks-n-Trends

Plan Your Trades - SPY Research For 6/17 & BeyondI put together this video to help traders plan and prepare for the next 30-60+ days - as we move into Q2:2024 earnings and pre-election consolidation.
Every week, I spent hours going over my Custom Indexes, proprietary price modeling systems, sector analysis, and more. My goal is to help as many traders as possible prepare for the greatest opportunities of their life (the next 5 to 10+ years).
I see so many traders getting trapped into following free or paid internet advice and blowing up their accounts. In my opinion, stick to the basics. Price is the ultimate indicator.
Then, determine the true bias of price trend and identify strong candidates to profit within that trend.
If you are a daytrader - you probably won't like my research/comments. I don't really daytrade much. I'm more of a swing trader - looking for 8% to 25% swings that take 3 to 20+ weeks to mature.
Either way, this video will help you understand what to expect over the next 30-60+ days in the US/global markets. Prepare for a big move in late June or early July.

Dr Copper ~ Snapshot TA / Contraction x Expansion = InflectionIt ain't easy being DR CAPITALCOM:COPPER
Peaked in March 2022, only to crash -38% & bottomed-out in July 2022.
Since then it has fluctuated between Contraction (will Global Economy collapse?) versus Expansion (will Global Economy recover?), while also contending with outlook of China's Economy, yeesh lol.
Copper's price action has also been compressing, as descending trend-line squeezes current Trading Range against ascending Parallel Channel.
This suggests momentum will eventually need to "pop" in either direction...but it could also continue trading sideways a little longer while more data is disseminated by Market Makers to make a confident decision, TBC.
Tick tock, time is running out for the Doctor..
Boost/Follow appreciated, cheers :)
AMEX:COPX AMEX:CPER COMEX:HG1! COMEX:HG2!

Global Markets Are Setting Up A MAJOR BOTTOM For 2023+US/Global markets are actively seeking a bottom at this point.
We've witnessed the largest unwinding of global excesses since the DOT COM bubble and, before that, the 1929 market peak.
Use this symbol to experiment with market trends/setups: (TSLA + ARKK + ARKW + ARKQ + GME ) / 5
In my opinion, the deep selling is nearly over. This chart shows the custom symbol is very close to the center level on the historical Pitchfork and very close to a 1.0 (100%) Fibonacci extension from 2016 to 2019. I suspect the unwinding of the global markets is very close to a BOTTOM right now.
2023 could be very explosive, considering the extreme downside pressure we've seen over the past 15+ months.
Think about this for a few minutes...
_This chart shows price is currently AT or BELOW 2016~2018 center Std Dev levels. It may move a bit lower before actually finding a bottom.
_This price level represents a pre-2019 earnings/revenue expectation (ignoring the past four years of progress).
_The US Fed has already disrupted inflation trends and will likely shift towards more moderate policies in H1:2023.
_This was not an excess bubble as much as it was a speculative bubble during the COVID supply disruption.
Now, we shift back to more normal Revenue/Growth expectations. The US/Global markets are actively seeking a bottom RIGHT NOW. The reversion/reflation trade (bullish) could be very powerful.
---- ------------------------------------------------
Precious Metals will continue to appreciate - just like what happened in 2002~2005+. We are in the early stages of a reflation cycle (post COVID speculative bubble).
The bubble has burst. Prices have deflated. A reflation rally is very likely unless some global crisis event disrupts the global economy. Gold and Silver will likely rally 35% to 55% higher over the next 2+ years (possibly higher).
This is just like 2002~2005 all over again.
-----------------------------------------------------------------------------------------------------------------
I believe it is time to start initiating "TOKEN" positions in deeply undervalued Technology, Energy, Consumer Staples, Healthcare, and other "relation" sectors.
Follow my research.

This is what's breaking the markets right now...The US Current Account value is at the lowest level since 2005-06 (after Greenspan raised interest rates). This indicated we are deeply negative in regard to debt spending and the current Interest rate levels.
No matter how you slice it, this deep US Current Account level indicates "something's gotta change" and the only thing that can change given the Fed's trajectory is Asset Value levels (just like the GFC).
If my analysis is correct, we are probably only 60+ days from another, this time GLOBAL, financial crisis that may wipe out valuation levels to 2013~2015 levels.
You have been warned. This it NOT going to be pretty.
Follow my research.

are we ready for a blockbuster expiry..?as we witness a very tight range in bank nifty today. are we gonna have a blockbuster expiry on 07/04/22.as u know traders we should not work on assumptions. I say this cuz I have seen the option data, market sentiments& price action which is indicating a correction in indies tomorrow. BIAS will remain short for tommorw. will not be interested in taking any longs.
best of luck traders.

US FED's Hawkish posture has world markets shivering with fear. Aggressive posture by Fed has traders booking profit across the globe. Global markets have tanked. Current support zone of 17661 below this level the support is near 17680. Bank Nifty is trying to form a Doji and stage recovery.

Total Crypto Market Capitalization This is the current sentiment at this juncture in time/space. looking forward to to recent highs

Total Crypto Market Capitalization Things just need to breathe sometime. This is the current metrics at play in the current time/space

Is your money worth reading "maybe´s"Hello Trenders,
Been thinking a lot to or to not publish this signal. Many of you expect a deep on global level, therefore I here show you some mathematic forecast.
This may not be the end of the world, yet it is far worse than the most downbeat forecasts. The evidence to support this outlook is in plain
sight. Some sixth-grade math is a good place to begin the analysis. Make 2019 economic output 100 (the actual figure is $22 trillion; “100” is
100 percent of that number; a convenient way to measure ups and downs). Assume output drops 20 percent over the second and third
quarters of 2020 (many estimates project larger drops; 20 percent is a plausible if conservative estimate). A 20 percent drop for six months
equals a 10 percent drop for the full year, assuming the first and fourth quarters are flat on net. A 10 percent drop from 100 = 90 (or $2.2
trillion of lost output).
Since 1948, U.S. annual real growth in GDP has never exceeded 10 percent. Since 1984, real growth has never exceeded 5 percent. The
highest-growth years since the end of World War II were 8.7 percent in 1950, 8 percent in 1951, and 7.2 percent in 1984. An assumption
that real growth will occur in 2021 at a 6 percent annual rate is a generous if unrealistic assumption. Such growth would qualify as a Vshaped recovery.
If our new base is 90 (compared with 100 in 2019) and we increase output by 6 percent in 2021, this brings total output to 95.4. If we
enter 2022 with the new base of 95.4 and increase that base by 4 percent (so, 95.4 × 1.04), we come to 99.2 in total output by the end of
2022. Here’s the problem. Using 100 as a baseline for 2019 output, and assuming 6 percent real growth in 2021 and 4 percent in 2022 (rates
of growth that have not happened on an annual basis since 1984), the economy does not get back to 2019 output levels. The hard truth is
that 99.2 < 100.
Source : The new great depression (2021).
What about if we really have a second wave harder then the first with mutatied covid?
I want to add, is not my intention to spread panic or "maybe´s" but the study got my attention.
Even the legends will have trouble surviving if this happen.
So how can a trader survive in this case condition by trading as only source of income???
Perhaps agricultural commodities will always perform....

SPX: Yes, we have opportunities around!Hello traders and investors! Let’s see how the SPX is doing today!
To the untrained eye, the 1h chart seems erratic and unreadable, but if we look carefully, we’ll see that the movements were all extremely technical.
First, the index dropped to fill the gap (yellow square at 4,198.77), and it found support over there. Now it did an impressive Tweezers Bottom pattern , indicating a possible bottom formation.
The 21 ema is the next resistance it must defeat, and we’ll see if it’ll do it or not in the next few days.
In the daily chart, we have what seems to be a top, but it is not confirmed yet. So far, all we can assume is that the index just did a pullback to the 21 ema, filled a gap in the 1h chart, and now it is just about to resume the bull trend.
The scenario is complex, but I still see a few opportunities around. I already told you guys about some stocks we’ve been trading in the past few months, and I can assure you, every single one of the Brazilian stocks traded in the US that we bought recently is making a huge gain!
I recommended 9 Brazilian stocks to my followers, and 5 of them are giving more than 40% returns so far, and I’ll reveal which ones: PBR, CIG, ABEV, BRFS and ITUB. The worst gave us about 13% gains.
The green circles are the moment when I gave the buy recommendations. When the market looks complex and undefined, we can always find opportunities elsewhere. Now, the BR ADRS look expensive, so the search continues! Yes, we do have some incredible opportunities in the US market, but you must know where to look.
Be careful, and let’s continue the search for more opportunities!
Remember to follow me to keep in touch with my free analyses!
Thank you very much!

MSCI Country Performance in 2020Here’s a chart of how some foreign equity markets around the world have performed relative to each other throughout 2020. Its based on iShares MSCI ETF performance.
This year’s correction and recovery have been unique from prior corrections in that the catalyst was a pandemic that impacted every country in the world, but at different times. Observing the chart, you can find where some countries underperform or outperform others as they go into and out of lockdowns and other measures that impacted the local markets.
There was an upturn in markets around October 28 (a bottom for US markets on 10/30). Around the same time several regions went back into lock downs early, with the United States refraining from further lock downs until some states pivoted heading into late November and asked for business to shut doors. It’s clear that the countries that locked down early have markets that are accelerating as investors see those economies likely to emerge from slowdowns faster.
Similarly, you can look at a comparison of currencies and see similar trends. Below is a currency comparison since the beginning of 2020.
Finally, below is world currencies since October 28.
It’s a curiosity, if not a pointer to what foreign countries to build some portfolio exposure. Most likely, the US market will emerge in relative strength once we clear the current pandemic wave and have a vaccine in place.

