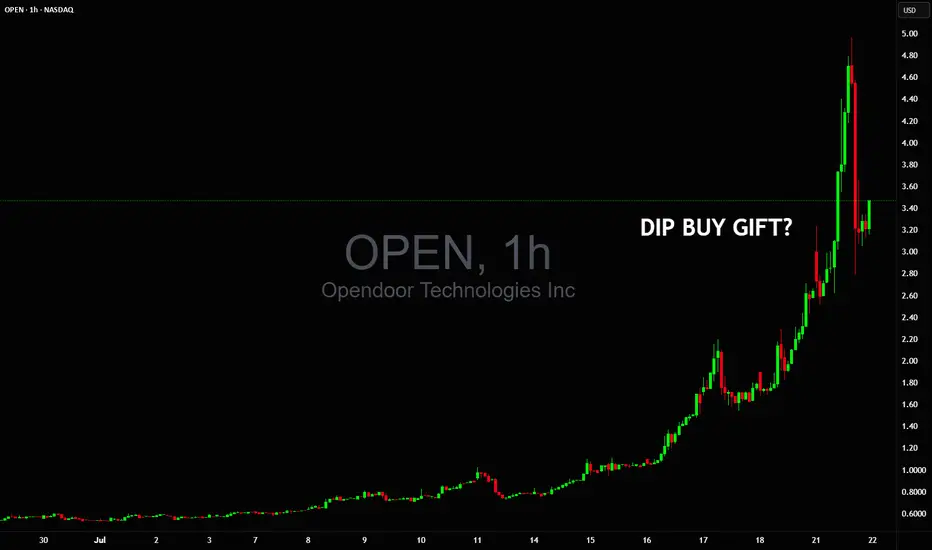
Could this dip $5 to $3 be a buy gift before double digits?Could this dip $5🔻$3 be a buy gift before NASDAQ:OPEN goes into double digits on NYSE:GME style vertical squeeze? 🤔
We haven't seen such 1 day volume in years so nobody really knows what's next 👀
GME
Golden Cross on GME WeeklyGME Chart Breakdown, Déjà Vu or Destiny? Something big just lit up the weekly chart, the 50 MA has pierced through the 200 MA, forming that golden cross traders dream about. On the weekly timeframe. Not a drill.
Now, let’s rewind. The last time this pattern appeared? January 2021. The infamous squeeze. Back then, GME didn’t just nudge upward, it catapulted nearly 4000%, going from a $3 floor to $120 in a blink.
Fast forward to today, new golden cross, new setup, and a $23 floor. If history rhymes even remotely, we’re staring down a hypothetical $1000 per share move. Yes, one thousand.
Is lightning about to strike twice? Stay tuned to find out!

Sklz 7.55-8.09 new floor ?!Big volume, i think july 18 calls are micely valued for 7$
Based on chart purely, i think the set up is there for the move north.
Big volume spike on 4hr looking like a nice green week. SKLZ ANS PARADISE TO THE MOON. 10$ by december
Not financial advice but i think its a nice price.

GME GameStop - A Crypto Proxy with Surprise UpsideIf you haven`t bought GME before the previous rally:
Why GME Could Rally by Year-End 2025:
1. Hidden Bitcoin Exposure
GameStop recently revealed it holds a significant amount of Bitcoin on its balance sheet — quietly positioning itself as a crypto proxy in the equity markets.
While not a traditional miner or crypto company, GME gives exposure to BTC upside without being a pure-play crypto stock.
With Bitcoin aiming for new highs in 2025, any company with BTC on its books becomes more valuable — just as we saw with Tesla and MicroStrategy in prior cycles.
2. Retail Speculation and Meme Momentum
GME has always been a retail-fueled stock, and retail interest is surging again in crypto and meme trades.
As crypto enters a new speculative phase, GME could benefit from a reflexive feedback loop: BTC goes up → GME gains attention → more retail FOMO → GME rises.
Recent reappearance of figures like Roaring Kitty has reignited interest — and if crypto sentiment stays hot, GME could ride that wave.
3. Lean Balance Sheet and Optionality
After multiple share offerings, GameStop is flush with cash and minimal debt — giving it financial flexibility.
Holding BTC enhances its treasury strategy during inflationary or weak-dollar cycles.
This also gives it optionality to enter Web3, NFTs (again), or even blockchain gaming — areas where its brand could carry weight.
Technical Setup
GME is consolidating above key support in the $20–23 zone, forming a potential bull flag or base for another breakout.
Any breakout in Bitcoin or renewed meme-stock energy could push GME to test $35–40, or even $50+ if momentum returns.
Final Thoughts
GME may not be a traditional crypto stock, but it’s now quietly tied to Bitcoin performance. With crypto heating up and retail risk appetite returning, GameStop becomes a speculative bet on BTC, memes, and volatility — all in one ticker.
Disclosure: I am part of Trade Nation's Influencer program and receive a monthly fee for using their TradingView charts in my analysis.

$Entire Market - MASSIVE MOVE COMING SOONSo to keep things short, i've just seen the most massive move in my data i've ever seen in the history of my data. Moves like this indicate an extreme event in the world being priced in.
NEVER in the history of my data have i seen this kind of move in ANY stock and it's being shown in almost ALL stocks.
I think that at some point in the next 14 days we're going to have a massive 4-6 Sigma event either being rate cuts or war stuff. I don't know what it can be myself but i see the state of the world + the absolutely mind boggling move in the data and can put 1+1 together.
This combined with my AI having sold all stocks on Friday... yeah. Something is being priced in.
I had in fact thought this was like a GME thing cause i first saw it in GME's data but it's in fact a move in data for ALL stocks and happened on Friday. My dumbass bought GME on Friday thinking we were gonna see a move next week.
To keep things short the TLDR is:
-MASSIVE MOVE SOON (Next week - Maybe the week after)
-Likely direction is BIG DOWNS OR BIG UPs. Only huge outsized moves coming.
-How to play it: Straddle for safety. Puts for big risk big return.
I think we're dropping like -$100 bucks on SPY within a month based on this alone. Won't bet on it until my AI says to do so however. Right now it's just sold all stocks, hasn't bought puts yet or bought calls. Also something like -15 bucks on TQQQ and GME to $11. That or the exact opposite with some absolutely batshit insane ripper due to announcing to replace Jpow and doing rate cuts as soon as next week. It's either this or actual war, but anyway something's being priced in HARD and across the ENTIRE market. This kind of move is going to happen soon and quick, with this kind of insane liquidity, something is going to break...
Not gonna share future updates on the data for this event as to keep some secret and for myself to make money without affecting this trade by informing half the internet. Might eventually make it into a subscription thing on my website for those really interested but for now nah.
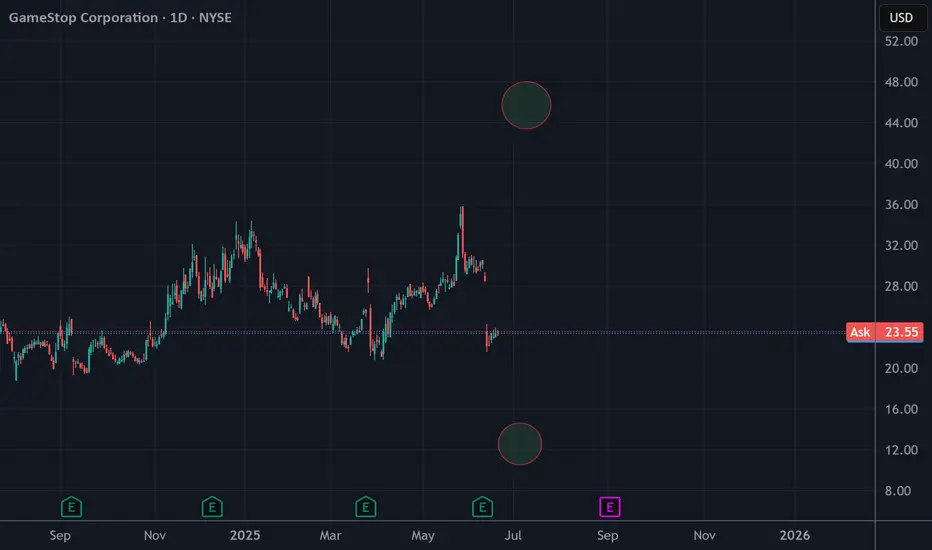
GME TRENDS AND PRICE TARGETSGME has a neat trend setup where it is sitting around support, with huge downside, but also huge upside. We just saw price gap down and the return sets us up to climb potentially as high as $66.
Good luck GME people.
Contact me for custom charts.
Overall bullish but be careful on this trend break, it is a risky buy.

GAME CRACK!GAME is one of the easiest stocks to short.
Just wait for the bearish signal and take the trade. Over and over and over again.
Anyone who wishes to learn what Bull Traps are should study GME chart.

GME COLLAPSE - NET SELLOFF - MARKET ANALYSISGameStop (GME) is dropping in after-hours trading following its $1.3 billion convertible senior notes offering, which investors see as potential dilution. Similarly, Cloudflare (NET) is also falling due to concerns over its $1.75 billion convertible debt offering, which could impact shareholder value.
On the flip side, Oracle (ORCL) surged after reporting strong Q4 earnings, with cloud infrastructure revenue expected to grow over 70% in fiscal 2026. This could provide a tailwind for the broader cloud sector.
The market’s pullback today was much needed, with many stocks retesting key breakout zones

LRC, LOOPRING, HOW MANY LOOPRINGS DO YOU THINK SONIC COULD EAT?Something is going on with this coin on the technical side.
There is literally no downside target that I can see right now, so I just labeled in MASSIVE SUPPORT TREND.
It looks like it is really close to making a move to the upside.
Somewhere around .8
Then it will likely hit some resistance there, but has a lot of potential to keep building support and climbing.
This coin looks incredibly bullish right now.
Things can change fast and if they do it will likely be a break of this trend (green).
The run up can take it to .45 and maybe a little higher, but the buy the dip price looks to be around .245. which would then take price higher to over 1 and beyond.
I'm gonna go with 3684 looprings for sonic.
What even is a loopring?
I'll attach more crypto TA to this idea.
oh and don't follow the guideline, pay more attention to the trends and price zones.

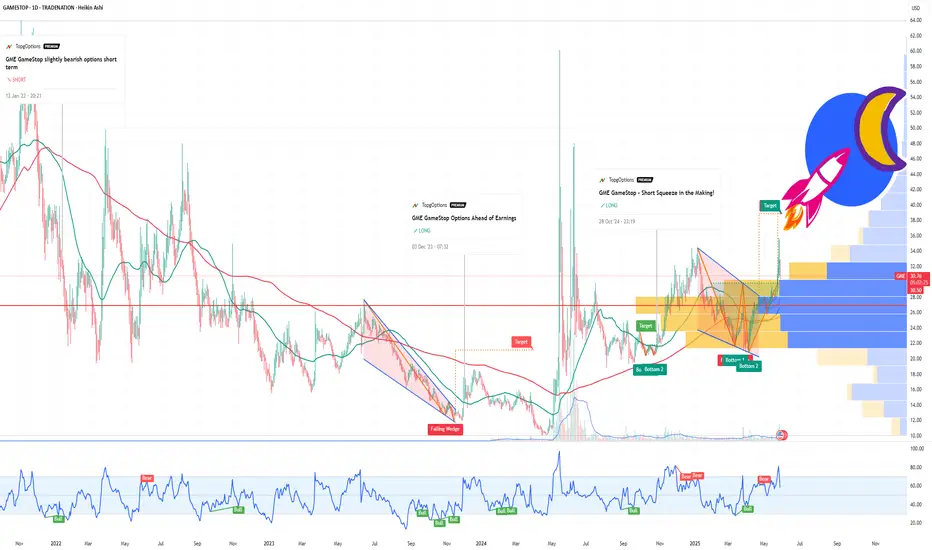
GameStop (GME) Is the New MSTR — And It Might Moon Harder ! If you haven`t bought the dip on GME:
Now You need to know that GameStop (GME) is the new MSTR MicroStrategy — But With Meme Power!
GME GameStop just made its boldest move yet: the company revealed it has purchased 4,710 Bitcoin, officially entering the crypto game in a serious way. While it hasn’t disclosed the total price paid, the intent is loud and clear — GameStop is transforming into a Bitcoin-holding company, just like MicroStrategy (MSTR) did back in 2020.
This isn’t just about hype. In March, GameStop raised $1.3 billion through a convertible note offering, specifically to help fund Bitcoin purchases. It also updated its investment policy to formally add Bitcoin as a reserve asset — the same exact strategy that led to MicroStrategy’s 10x stock explosion.
But here’s the twist: GameStop brings more than just Bitcoin exposure — it brings meme momentum. Unlike MicroStrategy, which had to win over the market, GME already has an army of loyal retail traders, massive online visibility, and a cultural legacy as the original meme stock. If MicroStrategy was the corporate face of Bitcoin adoption, GameStop is the internet’s version — louder, faster, and potentially more explosive.
Yes, the stock dipped on the announcement — typical for big moves like this — but long-term, the upside is undeniable. Bitcoin on the balance sheet gives GME new life, and volatility is GameStop’s comfort zone. With Bitcoin becoming a political and financial flashpoint — highlighted by major figures like JD Vance and Donald Trump Jr. attending the 2025 Bitcoin conference — GME’s move couldn’t be more timely.
This is more than a pivot. It’s a power play. GameStop is no longer just a nostalgia-fueled retailer — it’s a digital asset powerhouse in the making.
If you missed MicroStrategy’s rise, GameStop might just be your second chance — with even more firepower behind it.
Disclosure: I am part of Trade Nation's Influencer program and receive a monthly fee for using their TradingView charts in my analysis.
GameStop goes crypto: what 4,710 BTC means for the chartGameStop has disclosed a $500 million investment in Bitcoin, marking its first significant move into the crypto space.
The video game retailer is sitting on $4.76 billion in cash and hasn’t disclosed a limit on future purchases.
GameStop shares fell 10% following the announcement, while Bitcoin pulled back toward $107,000. A 14% rally would be needed for BTC to reach the 127.2% Fibonacci extension at $122,000, while $103,800 could be a key support level where we previously saw consolidation.
CEO Ryan Cohen addressed the Bitcoin 2025 Conference in Las Vegas via pre-recorded video Wednesday too, citing macroeconomic concerns as a key driver behind the company’s decision. These likely include rising U.S. debt levels and trump tariffs.

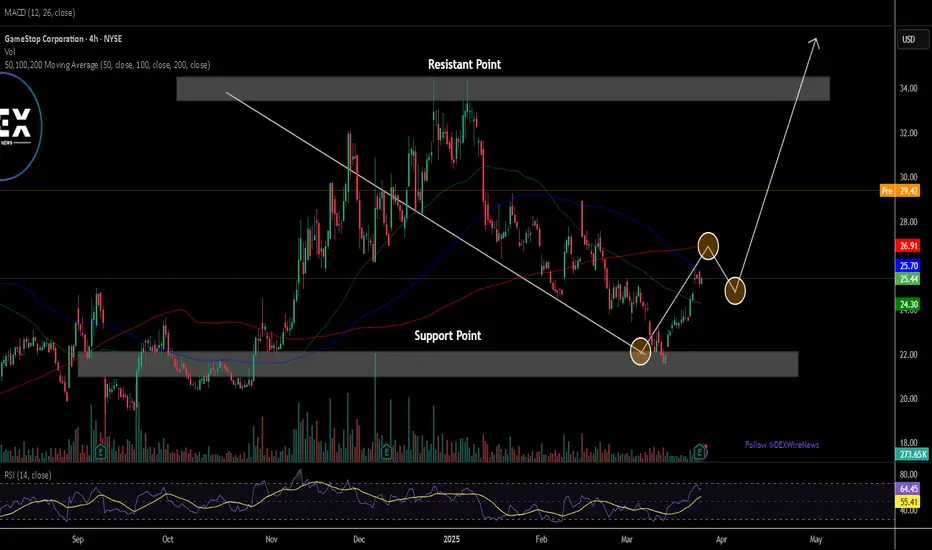
$GME Epic Short Squeeze? NYSE:GME had a classic breakout on the daily chart today.
- Breakout occurred on high volume
- Weekly & Daily RSI has room to run
- Clear stoploss level if this fails
- Upside parallel channel = target
Longing this name as long as it stays above $29.80
Next minor resistance will be the gap fill and then I believe we will liquidity sweep the most recent pivot highs before a pullback.

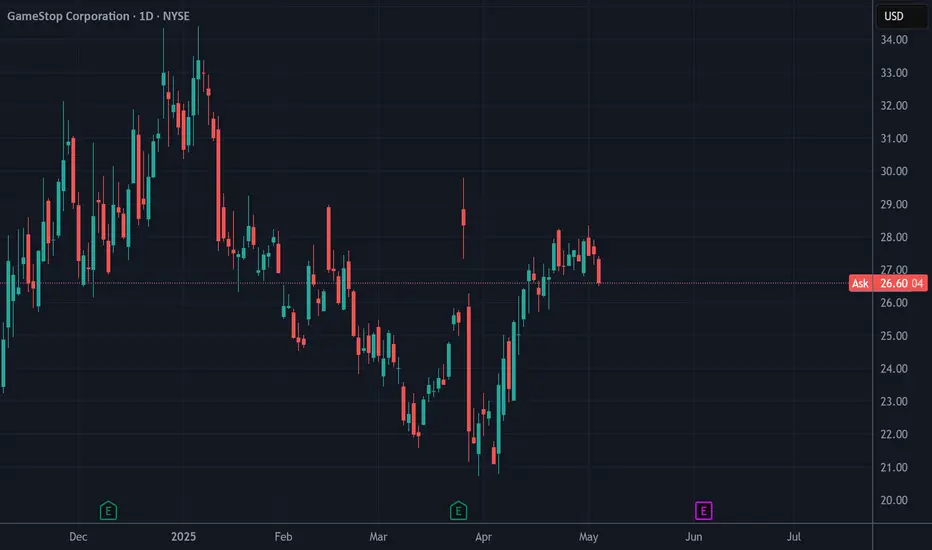
GME bullish with Golden crossGME bullish right now with:
- Golden cross in Day frame chart.
- Dragongly doji today maybe bullish if the volume higher tomorrow.
- MACD bullish .
- Pre Golden cross in Week frame chart too.
Today (05/15/2025) price closed: $28.63.
Entry now, R/R: 3.34.
Price target: $34.40.
Stop-loss: $26.90.
IMO.

GME - Uncertainly certainThe future is simply bright, from a top down view, GME is executing on the turnaround, by betting on Bitcoin. Simple as that, the future trajectory of this stock will be heavily tied to the Digital Gold, which is a good thing.
This turnaround also exposes Gamestop to future volatility events happening in the Cryptocurrency world. Up or down, once the pile of coins gets big enough, GME will benefit... Or go through intense selling periods (à la MSTR).
My proposed targets are :
- $65 August 2025
- $137, January 2026
- (-60% heavy correction through most of 2026)
- $174+, January 2027 this date being my personal MOASS date : January 27th 2027.
Confident in the leadership, confident in the market short and medium term. Those two factors could launch us into the second leg of this bull market, we may see GameStop perform exceptionally well, even on words and promises. Thankfully video games will sell themselves (GTA 6), consoles will too (Switch 2), but GME is finally about to become a lot more than that.
Don't sleep on it because it's a meme stock, these perform the best when the market goes banana on stimulus and deflation. If everything hits at the right time, then this 21% drop on SPX we've gone through in March and April of 2025 was the best dip buy ever.
GME forever bottomed in 2020, and since they started executing on the turnaround, the ceiling has been truly raised, although it was always high from the get-go :D
I must say, about that $174+ I honestly think, it's much much higher than that, I'm expecting this target to be busted through quite easily, ultimate target : $501. If, and if we get there, early 2027, I'm looking at a quite fantastic event, some kind of big news will shake up the markets, but GME, with a little bit of help from BTC could go through inversing main indices.

Its about the big picture. BUY SKLZImo this sklz stock is an easy buy and hold buy more and hold.
Volume profile on weekly at 11.53 is similar to the volume at 156$ a share
Volume of the passed is all this is missing. Avg down people who have been stuck like me no more 3.80$ buys.

$GME - Late PostingHi guys, sorry i'm a bit late on this post. mMy AI is suggesting that GME will go down from here. Unknown by how much. Just opened a long put position today around this area.
That's all. Thanks.
GameStopA stonk? Yes, a stonk.
Not just any stock. I really like the stock.
Technically, this looks ready for a run.
Fundamentally, it's the most bullish thing known to mankind.
Ryan Cohen just acquired 500K shares.
GME is investing in BITSTAMP:BTCUSD
What's up apes? 💎

You Won't Believe Who Saved Bitcoin: GMEThis last week was interesting to say the least but the most interesting thing to watch was the incredibly influx of volume into INDEX:BTCUSD
As the week progressed into Thursday and Friday and equity markets sold off big the volume of trading in Bitcoin more than doubled... yet the price remained stagnant.
A month ago I did a study of correlation and relative movements between stocks and Bitcoin to answer the question: "What would happen to Bitcoin if Stocks Crash?" The TL;DR was that 75% of all weeks exhibited a positive correlation with nearly 50% a "high" correlation. Also, when equities have sold off big over the past decade Bitcoin had sold off at least two times or more.
Correlations are not an absolute and can change but this week something unique was clearly going on. If the standard correlation had been allowed to play out on Thursday INDEX:BTCUSD would have fallen more than -8% and Friday more than -11%. It would have triggered mass liquidations. But that did not happen.
This was a critically important Support for Bitcoin to hold and someone knew it... enter Ryan Cohen.
Michael Saylor with NASDAQ:MSTR is definitely NOT the one deploying cash to prop up Bitcoin.
His buys have been entirely NOT-Strategy-ic and has mostly bought highs. He has made a virtue out of being a really bad "trader" uncaring about price and timing. That plan has not worked to push Bitcoin to new a new All Time High nor saved it from the bear trend in 2025.
Cohen, however, is a renowned trader/investor that should know market structure and would have the sense to deploy cash at the perfect time. Just this week two things happened: Cohen took out a loan backed by his NYSE:GME shares and GameStop completed a convertible note offering, like Microstrategy has done, to raise 1.4 Billion in cash to buy Bitcoin. That gave him lots of cash at the critical point at the end of the week.
So do they get to win? Very possible. It depends on equities. If stocks rise in the coming week then the Bitcoin correlation may resume and INDEX:BTCUSD be lifted. If the U.S. economy enters a recession, the stock market route deepens, or if they used all of their available cash to exhaustion then the plan could fail and Bitcoin will fall in sync.

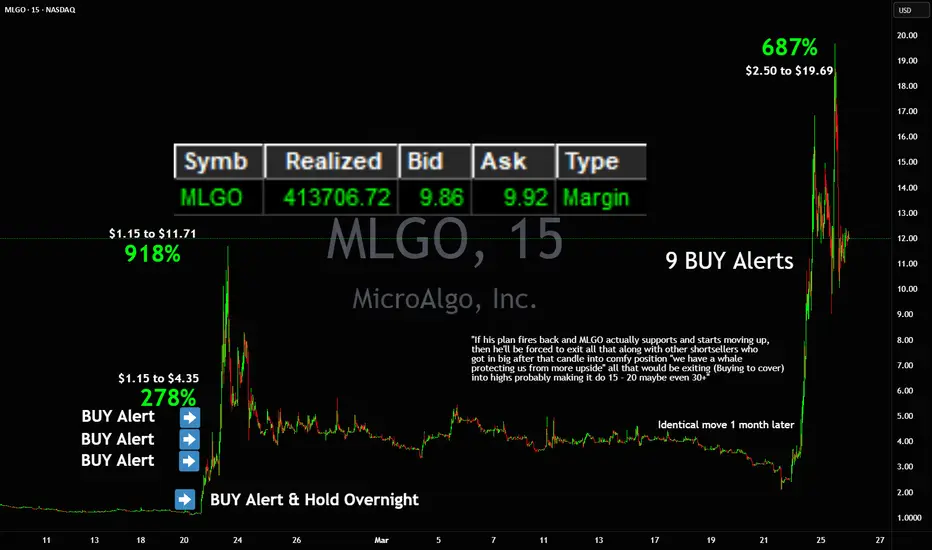
WOW $2.50 to $19.69 in 2 days 687% power squeezeWOW 💥 $2.50 to $19.69 in 2 days 🚀 687% power squeeze on 9 Buy Alerts
First buy at $4.93, last sell at $19.24
I sent commentary about NASDAQ:MLGO what's happening in the background and how I see shortseller behind manipulation losing the battle and blowing up to $15 - $20+ while it was still below $10 🎯
A month ago it triggered the exact move.
GameStop’s Bitcoin Bet Fails to Wow Traders. Can It Copy MSTR?GameStop NYSE:GME wants to jam Bitcoin BITSTAMP:BTCUSD into its treasury. But isn’t that a risky move that threatens to derail the video-game retailer’s finances? With $1.3 billion on the line, GameStop’s pivot to Bitcoin in efforts to revive its flagging share price may make things even worse. Let’s talk about that.
Desperate times call for desperate measures. After a couple months of speculation, traders’ suspicions turned out correct — GameStop is indeed adding Bitcoin on its balance sheet .
The company confirmed the plan in its quarterly earnings update released last week. That was all good — shares jumped 8% on the news and closed the cash session higher by 12%.
But these solid gains were not only wiped out — traders doubled down on the selling pressure when the shares crashed 23% a day later because GameStop unveiled a scary figure.
To make Bitcoin a treasury reserve asset, GameStop said it is seeking to sell $1.3 billion of convertible bonds , which will be used “for general corporate purposes, including the acquisition of Bitcoin in a manner consistent with GameStop’s Investment Policy.”
What do these convertible bonds do? They’re essentially papers that certify you’ve given the company a loan. Usually, they come bearing some nice guaranteed yield, but in this case, the yield is exactly 0.00%.
Another string attached to GameStop's bonds is that they are due in 2030 and you can choose to convert them into shares, each with a price tag of $28.46, or you can take them out in cash. That’s one reason why the stock tanked last week — not too favorable conditions.
Another one, and perhaps a bigger worry for investors, is that GameStop’s net income will no longer be as secure as it’s been until now. More precisely, GameStop generates around $220 million in interest each year thanks to its holding of Treasury bills.
With Bitcoin getting in the mix of factors contributing to the bottom-line figure, things may spin out of ordinary. True, Bitcoin may go up in price and lift GameStop’s net income but it could also decide to nosedive for no reason and eat into GameStop’s profits.
Judging by the votes of the traders last week (if the stock market is a voting machine in the short term), they seem to believe in the latter. At least for now. But that's not a concern to the OG meme stock . Where it hopes Bitcoin will make a difference is the long run. Just look at MicroStrategy MSTR .
Strategy, formerly known as MicroStrategy , is the world’s largest corporate Bitcoin holder. Even more, it’s a Bitcoin hoarder, sitting on more than 506,000 Bitcoin, according to BTC-tracking platform Bitcoin Treasuries .
Strategy has been issuing debt to buy Bitcoin since 2020 and that’s the exact same thing that GameStop is doing. But there’s a key difference. Strategy has largely strapped its share price to the performance of Bitcoin. So much so that the market has been feverishly buying the stock as a way to get exposure to Bitcoin (on steroids). For GameStop, it’s too late for that.
Shares of Strategy are trading at less than 2x the value of its Bitcoin holdings.
GameStop, in contrast, has appealed to investors for its stack of cash (besides the speculative bonanza) with $4.8 billion in dry powder ready to be deployed. The stock is trading at more than 2x its cash holdings and the cash-to-Bitcoin conversion is likely to dent that performance and trigger some outflows. And that’s how the company puts its premium at risk.
So is it safe to say that GameStop is looking to spark a share-price rally by following MicroStrategy’s lead? Maybe. But the exposure to Bitcoin also comes at a perilous time for the cryptocurrency industry. Bitcoin is down 10% on the year and more than 25% from its all-time high of $109,000 to hover around $84,000 a pop.
Can the Bitcoin philosophy reel GameStop out of the slump? Or will it drag the bottom line and chip away at whatever’s left of the bruised valuation under $10 billion? You be the judge — share your thoughts in the comment section!

GameStop Stock Holds 11% Gain Following Earnings ReportThe stock price has surged rapidly, nearly reaching the $30 mark, after a strong bullish shift emerged following the company’s latest earnings report. At first glance, the results were mixed: sales came in at $1.28 billion for Q4 2024, down from $1.8 billion in the same quarter of 2023. However, net income held strong at $131 million, compared to $63 million a year earlier. This disparity in results created volatility in the stock price. Adding to the bullish momentum was the announcement that GameStop plans to sell assets to create a strategic reserve in Bitcoin, which helped fuel the rally in recent hours.
Breakout from Bearish Channel:
The stock had been trading within a downward channel since early January, but recently broke out with a strong bullish move. The speed and strength of this breakout may lead to short-term selling corrections as the price stabilizes.
RSI Indicator:
The RSI line is now approaching the overbought zone around the 70 level. As price action continues at these levels, the market may be showing signs of imbalance due to excessive buying pressure, which could open the door to bearish corrections in the upcoming sessions.
Key Levels to Watch:
$31: A nearby resistance level, marking the highest price zone reached earlier this year. A sustained break above this level could trigger a strong short-term uptrend.
$25: A support level aligned with the top of the previous bearish channel and the 61.8% Fibonacci retracement. This could act as a tentative area for a short-term pullback.
$19: A distant support level, corresponding to the lows from September 2024. If selling pressure brings the price back to this level, it could reactivate the broader bearish channel seen in recent weeks.
By Julian Pineda, CFA – Market Analyst

GameStop-Themed Memecoin Spikes 167% Amidst Latest Bitcoin PlayA memecoin named after GameStop Corp. NYSE:GME skyrocketed about 167% Tuesday breaking out of a falling wedge pattern after the video game retailer adopted Bitcoin as a treasury reserve asset.
Build on the Ethereum blockchain, GameStop Coin (GME) soared 167% in the last 24 hours, dwarfing returns by blue-chip cryptocurrencies like Bitcoin and Dogecoin
The latest uptick widened the coin's monthly returns to an astounding +3778.06%. However, a cursory glance at its trajectory revealed periods of short-term rise followed by sharp collapse, indicating its speculative nature.
Note that the cryptocurrency isn't tied to GameStop in any way but seeks to capitalize on the hype surrounding the meme stock.
Technical Outlook
As of the time of writing, NYSE:GME coin is up 9.92% currently retraced as hinted by the Relative Strength Index (RSI) at 60. With the growing hype surrounding meme coins Gamestop coin is looking poised for a comeback as indicated by the daily chart - the wedge is still in play with a speculated surge to the January high, 2025.
GameStop (gamestop-coin.vip) Price Live Data
The live GameStop (gamestop-coin.vip) price today is $0.000101 USD with a 24-hour trading volume of $1,595,457 USD. GameStop (gamestop-coin.vip) is up 4.09% in the last 24 hours, with a live market cap of $41,512,628 USD. It has a circulating supply of 411,297,484,026 GME coins and a max. supply of 420,690,000,000 GME coins.

Gamestop ($GME) Surge 16% in Premarket Amidst Earnings Beat The shares of GameStop (NYSE: GME) surge nearly 17% as the firm reported fiscal fourth-quarter results, which saw revenue fall 28% year-over-year to $1.28 billion.2 However, adjusted net income rose to $136.4 million, or 30 cents per share, from $67.7 million, or 22 cents per share, a year earlier. The earnings growth came as the company moved to cut costs.
GameStop (NYSE: NYSE:GME ) updated its corporate investment policy to include Bitcoin, sending shares higher in extended trading Tuesday.
The video game retailer said its board unanimously approved the decision to add Bitcoin to its investment policy, following reports last month that the retailer was considering investing in cryptocurrencies.
The announcement follows speculation about GameStop's crypto plans after CEO Ryan Cohen last month posted a picture of himself with Michael Saylor, cofounder of Strategy (MSTR), the largest corporate holder of Bitcoin formerly known as MicroStrategy. The price of Bitcoin was just under $88,000 in recent trading.
Shares of GameStop jumped more than 6% in after-hours trading Tuesday following the announcement. The stock was down about 19% for the year so far through the market close.