AMC time to break 50? AMC and GME tend to trend in the same direction and both looking bullish atm
Looks like AMC is headed to test the 52 resistance, then 55 if it can break throug. What do you think?
Not financial advice - happy trading folks
GME

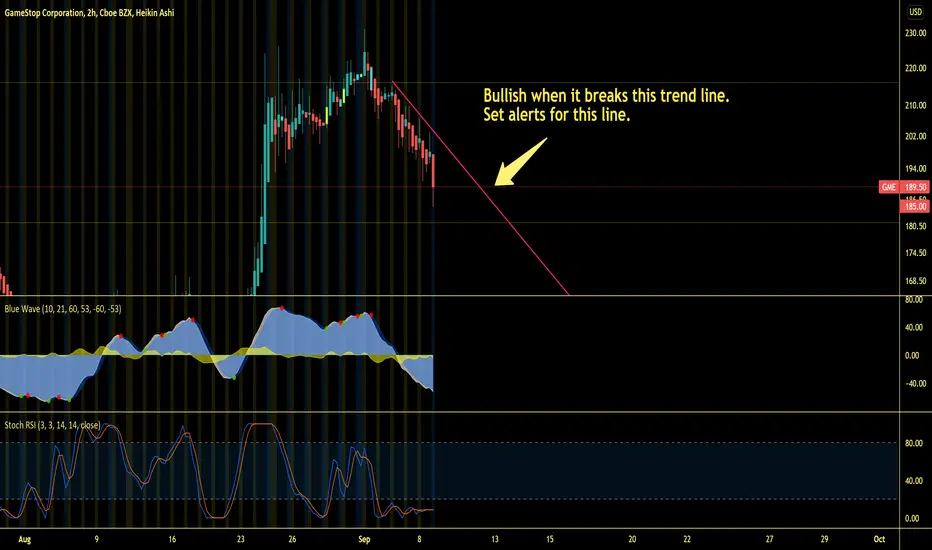
Set your Alerts for thisSet your alerts for this trend line.
GME will have a strong bullish momentum only after it breaks this resistance trend line.
GME extremely bullishGME is looking extremely bullish.
Yesterday I mentioned that GME needs to break this trend line to be bullish.
Don't forget your space suit boys, we're going to the moon!


GME Gamestop higher than expected net loss Yesterday i saw two times more puts than calls on the options chain for GME.
Gamestop reported adjusted net loss of 76 cents a share and net sales of $1.18 billion.
The analysts consensus called for an adjusted net loss of 67 cents a share and sales of $1.12 billion.
Let`s wait for a pullback to the key support levels then.

A Bearish 5-0 Could Take AMC Down Below $32 In The Coming Weeks.We have Bearish Divergence at the 50 percent retrace of a Potential Bearish 5-0 here and if this pattern plays out we will likely see AMC attempt to make a new lows below $32

Market Alpha - AMCNYSE:AMC
I actually think this one is going to go higher again... View the historical price action at this trend level. Let me know what you think!

GME broke through descending channelGME broke through descending channel and is about to run just before earnings release

Market Alpha Watchlist - ANYNASDAQ:ANY
This stock just recently did a direct offering to fund the purchase of cyrpto mining tools. That looked like it was going to bite them in the butt yesterday but with the flash sale and subsequent recovery, ANY might be a good choice as long as their is no funny business in regards to stock manipulation. Buyers are here and are interested in this stock.
My conviction on this stock comes from the option chain where we saw massive option buying take place yesterday on the call side.

GME earnings call dip then pop?Tomorrow we see if history repeats itself; historic trend has been for a post-earnings call dip followed by bullish retracement
RSI looking oversold at these levels but earnings call will be the strongest catalyst for any price movement up/down. Any positive news from RC tomorrow and this rocket may take off
w/ a dip, prices may fall temporarily fall to 160-180 levels before rebounding
w/o a dip, price target 400+?
Not financial advice, just my thoughts
Let me know what you think!

Analyzing GameStop GME Stock ChartFor those of you trading the meme stocks.... this one for you.
I took at look at Gamestop (GME)
Here's my analysis...
Watching in the 1 Hour chart.
Positives:
Price is bouncing off lower trend line.
Currently price is hitting previous support.
RSI and MACD reading oversold.
Negatives:
Price met a lot of resistance above $200
Current trend is down
Fundamentals are weak
Price prior to the Reddit move was well below current levels.
P/E is astronomically high at 10,140!!
In comparison, AMZN is around 80... and even that's high.
Opinion:
This is a highly risky trade.
Based on technicals, there is potential for a run-up again to $300-400 range. But this is a huge maybe considering it's majority depends on retail and not institutional money.
If it does run, it will end very quickly like previous runs.
In my experience, market makers like to project possible run up influencing the technicals that retail traders are using, convincing traders of a run before they pull the rug from under you.
If you do decide to enter, I'd look for a current dip to previous lows before entry and have tight stop losses in place. As always, don't use money your not prepared to lose. set your take profit within reason of the upper support and... don't be greedy.
As usual.. this is not investment advice. DO YOUR DUE DILIGENCE!
Best of luck trader!

Bearish Gartley on the Russel Visible on the DailyHidden Bearish Divergence on the RSI
This should lead to the bearish reversals of alot of midcaps. TZA looks like a good bullish option.

why i feel is going down helpWhy i feel the price is going to 145$ again ???? HELP!!!!!! tell mee before the earning report!

Common retracement to top of pattern following gap up breakoutWe broke out of a symmetrical triangle in a gap up and are simply retracing back to the top of that pattern before making the move up. This is very common and has to do with market cycles. We should expect volume soon, but if there's no volume it is possible we can retrace all the way back down to the 200 Day SMA around $120-$130. Near term outlook is neutral, intermediate term outlook is very bullish, long term outlook is very bullish. Good luck.

GME to over $700With 002 and 801 going into effect on Wednesday and the completed ATM offering, $GME is sure to take off. The chart is very, very bullish. $AMC is showing bearish divergence and a double top, which lends credence to the theories that it's a pump and dump to fund $GME losses. Not saying anything for certain, all we can do is wait and see.

PFE STILL MORE GAS IN THE TANKThis chart has been fairly predictable for the past year, however as we start to shape up the larger degree wave count, I've decided to alter this from an expanding diagonal to a typical impulse.
The main thing shaping this is the action for wave 2 which appears to be a flat.
Under this premise, we have subdivision of wave 3 underway. It appears to be an expanded third: triggering the 1.618 with evidence of another leg up to the 2.272 at $56. This is the primary trade at hand, as we target 15-20% gains here. This trade presents a 10:1 RR with a SL around $45.50 at the recent low for a 20% target.
Wave 4 of 3 looks to be complete, hitting the 1.618 extension of A to B (see chart below). We have RSI testing the 70 which will be telling: if it can get into overbought territory, then it's indication of a trend reversal (as markets typically only go into overbought when bullish). Not pictured is the stacking bullish divergence for this wave 4. Another thing that stands out as evidence of wave 4 complete is that it was sharper than wave 2 of 3. By rule of alternation, we would expect this.
Upon hitting this target near $56, we will reevaluate, likely close, and look for the next wave down. For now, I have a $45 level identified (w4 larger count) and a 2.618 target near $60 (w5 larger count) on the map. Remember: for extended wave 3s that approach the 2.0, we look for the next fib level near 2.618 for w5. These future targets are dependent on what happens here in this wave 3.

If GME's trends could talk [REPOSTED]Good morning Apes! This is a slightly retouched version of my last GME post. I noticed one trend line was slightly off and I corrected that mistake. As you can see since the first upbreak in January GME has been looking straight at the $500-ish area. I would guess, after every trend line confirming, that $500-ish is the price point that needs to be passed for MOASS. If not, that's still the area it wants to be in. NYSE:GME
For entertainment purposes only. Do your own research. NYSE:GME
God Bless

ROKUStrong move over the 363 level yesterday. If ROKU can break over 376 it can see 383, 390 next.
Trade Idea: 385C 9/3

If all of Gamestops uptrends had eyeballs....Then they would all be looking directly at about the $500 mark. If I were to take a guess I would say that's where we'll be seeing the next big move to.
I will be holding for a very long time.
Do your own research as I do this in my free time for fun.

GME To the moon soon....As we can see GME is at the strong support level tried to break it many times in a day I am anticipating it will break it in 2-3 days and ready to make all time high soon. Happy trading.

AMZNOne of the stronger name's yesterday as the market was basing. If the market can breakout higher today, AMZN can lead the market.
If AMZN can break over 3500 it can run another 25-50 points.
There's a 3.17% upside left before the gap is filled at 3580.
Trade Idea: 9/3 3525C

The Next 3 Extravagant Weeks ahead..!I believe there is a rational correlation between extravagant price moves like what happened in GME, AMC, and recently SPRT spiral and quadruple witching dates!
These types of price moves are strange and unexplainable phenomena for newbies..!
Let me explain why this phenomenon happens:
Stocks with high short interest are often very volatile and are well known for making explosive upside moves (known as a short squeeze). Stock traders will often flock to such stocks for no reason other than the fact that they have high short interest and the price can potentially move up very quickly as traders with open short positions move to cover.
1- What Is Short Interest?
Short interest is the number of shares that have been sold short but have not yet been covered or closed out. Short interest, which can be expressed as a number or percentage, is an indicator of market sentiment.
Extremely high short interest shows investors are very pessimistic (potentially overly pessimistic).
When investors are overly pessimistic it can lead to very sharp price rises at times.
Large changes in the short interest also flash warning signs, as it shows investors may be turning more bearish or bullish on a stock. (1)
2- What Is Quadruple Witching?
Quadruple witching refers to a date on which stock index futures, stock index options, stock options, and single stock futures expire simultaneously. While stock options contracts and index options expire on the third Friday of every month, all four asset classes expire simultaneously on the third Friday of March, June, September, and December.
Quadruple witching is similar to the triple witching dates, when three out of the four markets expire at the same time, or double witching when two markets out of the four markets expire at the same time. (2)
By now you should have a clear vision about these unexplainable prices movements! I believe with good timing we can use this information to make money extravagantly..!
I checked multiple resources and this is a watchlist of the stocks that may experience the squeeze phenomenon in the next 2-3 weeks!
www.tradingview.com
Be careful this types of price movements have some criteria:
1- They do not last long
2- They tend to be volatile (intraday) because of Algorithmic trading involvment.
3- They experience large Gaps
4- There is a risk of entrapment (look what happened in SPRT on Friday)
5- You have to be careful with volume, they usually experience a trading volume of more than 100% of the total outstanding share!
6- Monitoring the change in short interest is key to success, huge change could be considered as last day!
7- This rationale could explain the reason behind many "Wall Street Bets" moves!
for more information please read my related articles:
Max Pain or Short squeeze?
Is there hidden rationality beyond irrationality?
What is "witching" and why is it quadruple?
Reference Article:
1- www.investopedia.com
2- www.investopedia.com

Ideas and beyondJust a thought
Don't critique this too much, it's not a real TA.
Good luck to all investors.
