GME Other run comming GME could do other run to the upside also with the nft market news and the new things where they comming with
1.68 should be a nice target.
its important that he breaks the first ress then its free zone
GME


GME going BEAST MODEGME - looking beastly on the daily and ready to move up.
Bull flag looking similar to chart in early March.
MACD ready to rip.
Relative Strength Index strong but not oversold.
Aroon 25 - settling in.
Cycles lining up for a potential run higher.
90-day high to high for the last two rips and GME is coming up quickly on that algo prediction/date.
Note - GME hitting the middle line of the Regression Channel from before the January high - it just needs to break through. IMO very soon.
Not financial advice.

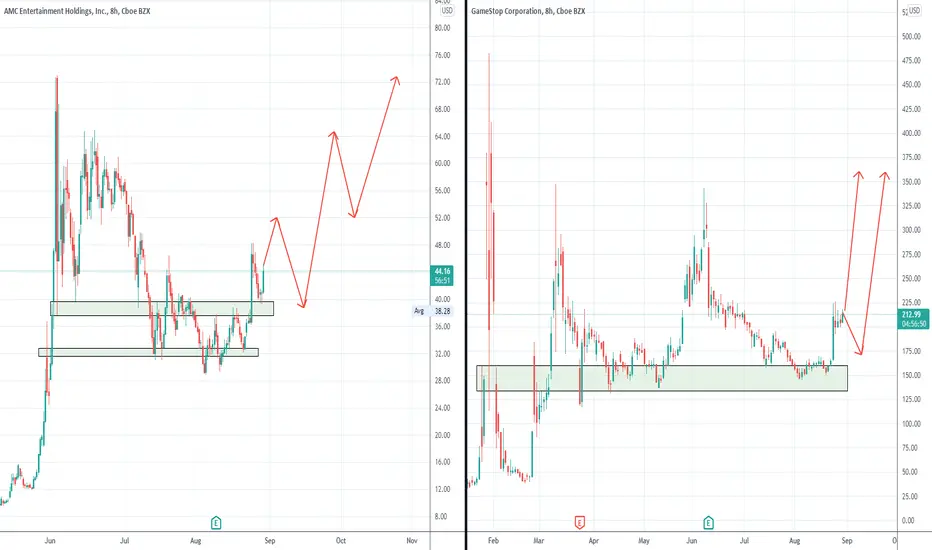
Let's get into some stock trades #4 & #5 - AMC & GMEDespite AMC & GME having either bad business models given the era we live in or bad financials or a mixture of both, the meme stock craze doesn't seem to be going away. AMC currently at about 17-18% short interest of free float and GME at about 12-13% short interest of free float. Neither heavily shorted, but there is some juice. Clearly neither as short as during the major squeezes, but the charts look pretty strong.
Currently we live in a world were memes, brands, communities and networks is all that matters, and these stocks have all of that behind them. Will these end well? Probably not, but in the short term we have something big here.
Several weeks ago I put out some updates on AMC and GME, and both did drop substantially since then and then found support. I stupidly ignored my 32$ buy level for AMC and on GME I was a little more scared that it would hold 150 after it lost 180. However the current view is quite different as they are both showing substantial strength. Short term might both pullback, but in my opinion it isn't a bad idea to own a little bit of both and consider that money lost as they could both go up 200-500% from here or even higher depending on how the stock market craze progresses.
In my opinion we haven't see the parabolic rise of stock markets yet, but we might be pretty close. Before that we might get a dip which would definitely be a great buying opportunity.
AMCAMC was able to hold the 40 level on Thursday and Friday and has formed a small bull flag pattern.
If AMC can't hold the 40 level, it can make its way back down to 37. If AMC can hold above 40, it can bounce back into 46. Over 46 can cause a bigger breakout.


AMC/GME " The 4th Cycle " before the biggest squeeze in historyAsk me questions.
look at my TA on the 2nd cycle. I WAS BANG ON THE MONEY, erhm in the money $
i was RIGHT again, Cycle 3 has started, I found this a month prior, fact check me.
SEE YOU @ $200-400. if big banks / SHF get liquidated or begin to cover in this bracket > ( like they should )
my next targets are $1200-4000.
Please this is not financial advise :P
p';s this applys to GAMESTOP
CANT STOP
WONT STOP
GAME STOP

AMC LONG -> BULLISH MONTH IN AUGUSTWhite line = RSI
Yellow line = Historic 180 day IV
Guys this is not a normal looking TA.
Just found something interesting.
Not advice, just an idea..
Going off of this, i feel next month is the next run up
Target is $200-400
p.s i predicted the last run up, check my post

GME and Wyckoff's Composite Man“…all the fluctuations in the market and in all the various stocks should be studied as if they were the result of one man’s operations. Let us call him the Composite Man, who, in theory, sits behind the scenes and manipulates the stocks to your disadvantage if you do not understand the game as he plays it; and to your great profit if you do understand it.” (The Richard D. Wyckoff Course in Stock Market Science and Technique, section 9, p. 1-2)
Wyckoff advised retail traders to try to play the market game as the Composite Man played it. In fact, he even claimed that it doesn't matter if market moves “are real or artificial; that is, the result of actual buying and selling by the public and bona fide investors or artificial buying and selling by larger operators.” (The Richard D. Wyckoff Method of Trading and Investing in Stocks, section 9M, p. 2)
Based on his years of observations of the market activities of large operators, Wyckoff taught that:
The Composite Man carefully plans, executes and concludes his campaigns.
The Composite Man attracts the public to buy a stock in which he has already accumulated a sizeable line of shares by making many transactions involving a large number of shares, in effect advertising his stock by creating the appearance of a “broad market.”
One must study individual stock charts with the purpose of judging the behavior of the stock and the motives of those large operators who dominate it.
With study and practice, one can acquire the ability to interpret the motives behind the action that a chart portrays. Wyckoff and his associates believed that if one could understand the market behavior of the Composite Man, one could identify many trading and investment opportunities early enough to profit from them.
Wyckoff's composite man theories, price cycles, schematics of accumulation/distribution and three laws have helped me a great deal in understanding how markets work.
Just as important has been Cem Karsan . The 19th I mapped out in this chart of a buy the dip trend:
was originally identified by Cem since 2020 as the Fed pumping stimulus (liquidity) into the markets. The Fed stimulus creates a well fed Gary (ape).
Gary is what people in vol markets refer to as how the majority of market markers are positioned for volatility. If a majority of MMs are long vol (well fed ape) it makes it harder for the underlying structure of the market to break down (corrections). Karsan identified this cycle of (dips) as a result of end of MM and HF 20 day cycles. With so much liquidity in the stock markets right now a well fed gary creates a pinning effect in major indexes for expiring contracts /hedging cycles.
Using order flow (supply / demand) of major derivatives, Karsan is able to identify market support/resistance levels from volatility hedges and dozens of other factors with weekly/monthly pin point accuracy.
What I think is causing all the short squeezes lately (AMC, SPRT, etc..) is that more people are identifying this cycle. All the short squeezes started up again at this wyckoff markup phase.
Gamestop is one of the OG short squeezes and the effects of these cycles/phases are clear in the charts now. There are several posts on popular subreddits related to these phases/cycles going back to the original short squeeze in Jan.
The thing with Gamestop are the Wyckoff price cycles are diminishing in volume and I don't know what that means.

AMC Short Squeeze Prediction (Third Times A Charm)When looking at AMC's price action in the previous months, September, particularly the week of 6th-10th, is looking real bullish for AMC. The first squeeze attempt happened Wednesday January 27th, the second Wednesday June 2nd. Both occurred in weeks where Monday landed on a holiday. Is it a coincidence that AMC's price action is rising and that September 6th happens to also be a holiday? Take this with a grain of salt because AMC is a hard one to predict, but September 8th looks really good on my calendar.

MOASS has just started. GMEThe mother of all short squeezes has just started and we think it will lead to a wave of liquidations, obliteration and bankruptcies of tradfi. We need to see the inefficient go before the new age can come into the foray. It looks like the short squeeze is ready to start from here it can happen before or after the crypto pump.
BULL CASE
Price goes to test the all time high after a short retest of 180.
BEAR CASE
Market makers tries to liquidate some more longs near the 120 level before the short squeeze begins.
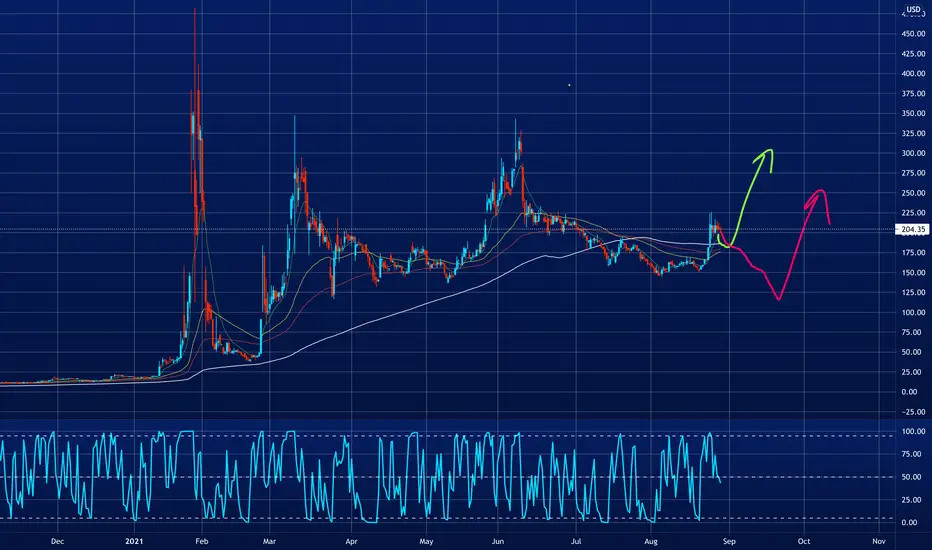

possible $800 GME pumpover the past few months we have seen some unrealistic price movements in GME. i think that we are about to get another/ final unrealistic pump before GME goes back down to a realistic price.
on this chart you can see fib time zones showing that big price movements happen after crossing one, right now we are about 1 week away from crossing one which means we could possibly get a pump.
GME price is forming a triangle pattern which means we could get a pump after were break it.

GME10k is not a meme? May be.
Not Financial Advice, I Just Admiring The Beauty of Fibbonacci, Perfectly Hit The 1.618 after clean breakout all retracement level
Crash - Retrace - Reaccumulation - Breakout

GME Ascended Triangle BreakoutGME Ascended Triangle Breakout GME Ascended Triangle Breakout GME Ascended Triangle Breakout

GME BULL FLAG UPDATE: SO FAR SO GOODNOT FINANCIAL ADVICE
Previous post called to breakthrough of the flag into uptrend, so far it is in the beginnings of an uptrend.
4 Hour support around $209-210
Resistance around $213
Still hoping for a $220 close for good confirmation of long bullish trend.
So far, analysis is correct, see previous post for bull flag analysis.

GME Flag Formation, Potential Breakthrough Flag support at 198
Flag resistance coming to an end, should see major move up or down.
Would play the breakthrough of flag resistance, still hoping for a close above 220.
Although there is a potential breakthrough, of course the opposite could happen as well.
Best thing to do for now is to wait or buy if you believe.
I will still be buying and holding (going long).

GME Breakthrough of Flag, Bull Flag forming/Bullish TrendGME breaks through flag resistance, going into bullish uptrend.
However, there is major resistance at 220, hoping for a close above 220.
New support should form soon, I estimate new support would be around 200-205ish.
Also hoping for higher than estimated earnings report, should reinforce retail and institutional investors for a long position until shorts cover.

GME Bull Flag Formation
Flag Forming on GME stock 15 min interval. Play the breakthrough of resistance (around 220+ on the close) for a long position.
Sell Attack may happen from the hedge funds, you can potentially short on the fall through of support (flag).\
Neutral for now as it is sideways market.

AMC Chart Update - One for the Apes. Pt2!!!NOT FINANCIAL ADVICE!!! The Pattern has played out perfectly to the dot. Reversal wedge retested and bounced off nearly right within my 2 week timeframe. We should be seeing $60 in the coming weeks and a break out from there to the upside. Price Target for first consolidation after breakout for me is between the $150 - $200 mark. Hold strong and Hold Long. Projected Time Frame to take profits should be Q4 (Which is where I believe the final short squeeze to happen), that's also when the execs can take profit from their shares and falls in line with the last all around the board push(Metals, Tech stocks, Crypto, Ape Stocks).

Mid-Day report Aug 25 2021Mid-Day report Aug 25, 2021
Market waiting on Powell and Gang. 10:am est. Friday

A Non-Random Pattern..!Jim Simons: we should try to trade patterns that happen on a non-random basis..!
Now with higher confidence, we can say Wall Street bets are predictable..!
NYSE:AMC with a 22 billion market cap gained more than 20% in a single day!
Today's price*volume: 9.9billion second to BABA and 10% above Tesla..!
Why this is important? because the last time this phenomenon happened it was the start of a Gamma squeeze..!
I will not surprise to see it ranked first tomorrow!
To learn more about it please read my previous post:
August 23-24, 2021:
Max Pain or Short squeeze?
Is there hidden rationality beyond irrationality?
Short Squeeze or Gamma Squeeze that is the question?
August 20, 2021:
This is called WSB effect..!
In the past few days, I published posts about Wall Street Bets and how they conquered the market!
They are not just a group of "Apes" unlike what many think, there is a master puppeteer and a core behind this phenomenon who know market mechanics top to down, the power of social media, data analysis.
The master puppeteer has learned to survive in life and career with a false identity many years ago from his grandmaster..!
To wrap it up, do not take an opposite position this could last for a while..! Today was the largest gain and trading volume since last "Quadruple Witching" June 18, 2021..!

AMCBig breakout over the 40 level today. Calls paid big if you played this.
Trade Idea: 8/27 50C over 46. *roll up with profits. (higher risk if you didn't already trade it yesterday.)
**Over 700 call sweeps yesterday.. one for 9/17 100C
