GMT

🔥APE: is the NEW ATH soon?💫Ape Coin is gaining popularity, as is the entire NFT industry. More implementations, more development and research. Today I will show you the scenarios that seem most relevant to me.
Let's mark two value zones on the chart:
🔶$13.7-14.4 - support for the price, from where the upward movement began.
🔶$17.6-18.35. This value zone should become support for the price. Of course, it is possible to expect a local correction to the $15-16 zone as well, but in the current situation, traders may not let the price go lower.
📊The price broke through the local downward wedge and rose 35% out of 59%. Technically, this pattern worked well and on the test of the $13.7-14.4 value zone and the trend line, it was possible to open long positions. Also, the volumes showed us the break of the trend and the presence of a buyer🐳
The next opportunity for a long trade might be a breakup of the ascending wedge or the return of the price to the second value zone at $17.6-18.35. As I wait for manipulation in the market, it is better to wait for a local correction and a test of the value zone than just make the trades.
🎯Targets:
1. $23 as the target for wedge pattern
2. $28 - key level, ATH
🔥The ascending wedge is a bearish pattern, but in the current conditions, when the price consolidated in the range of $10-15 for a month and a half, I suppose that the whales have accumulated positions and will want to realize their profit. The trigger for growth could be the local manipulation I was talking about. The growth of volumes will show us the big player's🐳 intentions.
Friends, press the "like"👍 button, write comments and share with your friends - it will be the best THANK YOU.
P.S. Personally, I open an entry if the price shows it according to my strategy.
Always do your analysis before making a trade.

🐦APE: MEME LORD tweets again! BUY or SELL?🔶ApeCoin(APE). If you are beginner at the crypto market and this is the first time you see a situation where Elon Musk or some popular person is pamping altcoins, that's fine. They do it often, but how do you make money on it?
📊How is the crypto market different from other financial markets? The crypto market is an unregulated, liberalized market. Manipulation and insider trading are allowed here. Of course, the richest man on the planet takes advantage of that. Just think about Doge, who is up by 200x in 2021. By the way, I talked about Doge, Musk and Twitter in this idea.
😮What should I do in these situations? Should I buy or try to open a short? Friends, I recommend using trading strategies and not playing casinos, especially with all of your money. As we can see, the token pumped for 20% and after Musk's tweet: "...seems kinda fungible" fell by 12%. Volumes are already up by 33% over the daily average. Someone had a good sellout. It is almost impossible to predict whether the price will fall or rise.
🎯About ApeCoin I did the idea a few days ago, the price reached 1 target +12% and almost reached second target close to ATH +37%. Who took advantage of the scenario, he earned.
🔥If it were possible to make money on manipulations, most would be rich by now. What do you think? Is it possible to make money on manipulation or is it a trick? Let`s share your ideas with us!
Friends, press the "like"👍 button, write comments and share with your friends - it will be the best THANK YOU.
P.S. Personally, I open an entry if the price shows it according to my strategy.
Always do your analysis before making a trade.

GMT | STEPN Gaining MomentumGMT looks very nice to me. It has just corrected and indicates bullish signals on the 1HTF. I entered a position and look forward to selling it higher.
Let's see how this plays out.
Thanks for your support.
Have a good one.

GMT trade set upGMT has had a nice run. Market structure has been broken to the downside so looking for shorts at the range high aiming for range lows.
NFA DYOR

🐋SHIB: 2 targets for this dogo! Where to open a trade?⚡Shiba Inu(SHIB) is squeezing under the trend line. But does it have enough strength to break it? Were there enough liquidations? Let's talk about it in this idea!
After the HUGE liquidation of the long traders who were the fuel for this fall, the price started to squeeze under the trend line. This is a good bullish signal and if the major cryptocurrency, Bitcoin, shows strength, the price will easily reach our targets:
🎯target 1 - $0.0000228-0.0000235 value zone
🎯target 2 - value zone $0.0000263-0.0000271
We can see from the volumes that the long traders who were accumulating before the fall were simply liquidated. Also, the fuel now could be desperate traders who want to open shorts or those who were shorting all this fall but have not taken profits yet.
🔥 How not to become fuel for a rise or fall and not be liquidated:
1. trade according to your strategy. Being out of the trade is also a trade.
2. look at the main altcoin, Ethereum. Its price shows the direction of movement for all altcoins
3. be craftier than the market and retail traders. Keep learning and improve yourself
🏁The local pullback is still possible, so pay your attention to the volume indicator and wait for the next update!
Friends, press the "like"👍 button, write comments and share with your friends - it will be the best THANK YOU.
P.S. Personally, I open an entry if the price shows it according to my strategy.
Always do your analysis before making a trade.

GMT - we can take Long at $3 - volume at bottom is best confirmGMT - we can take Long at $3 - volume at the bottom is best confirmation for our trade

GMTUSDT can go lower to FIB 0.5 level
GMTUSDT can potentially break below the trend line after forming a double top. We also see that the price can't get away from the trendline which is another indication that there is no buying pressure at this level which can lead then price go lower
💎 GMTUSDT
🔵 Entry zone 3.32891 - 3.61485
🟢 TP1 2.67000
🟢 TP2 2.06000
🟢 TP3 0.90000
🔴 SL 3.90000
Good Luck 🎲

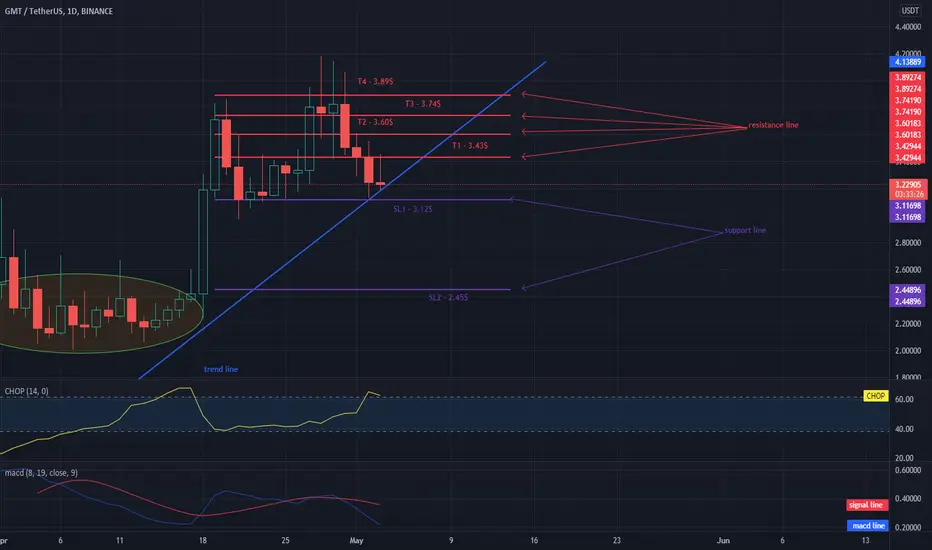
GMT has a price adjustment but has collected a lot of 1D energyHello everyone, let's take a look at the 1D GMT to USDT chart. As you can see, price is moving above the local uptrend line.
Let's start with the designation of the support line and as you can see the first support in the near future is SL1 - $ 3.12, if the support breaks, the next one is SL2 - $ 2.45. It is worth choosing at least one stop loss.
Now let's move from the resistance line, as you can see, the first resistance is T1 - $ 3.43, if you can break it, the next resistance will be T2 - $ 3.60 and T3 - $ 3.74 and T4 - $ 3.89.
Looking at the CHOP indicator, we can see that on the 1D m interval, we have a lot of energy for the next move, while the MACD indicator shows a downward trend because the blue line is below the red one.
Trading opportunity on GMTUSDTBased on technical factors there is a short position in :
📊 GMTUSDT STEPN
🔴 Short Now 3.32000
🧯 Stop loss 3.75000
🏹 Target 1 2.85000
🏹 Target 2 2.37000
🏹 Target 3 1.78000
💸Capital : 1%
We hope it is profitable for you ❤️
Please support our activity with your likes👍 and comments📝

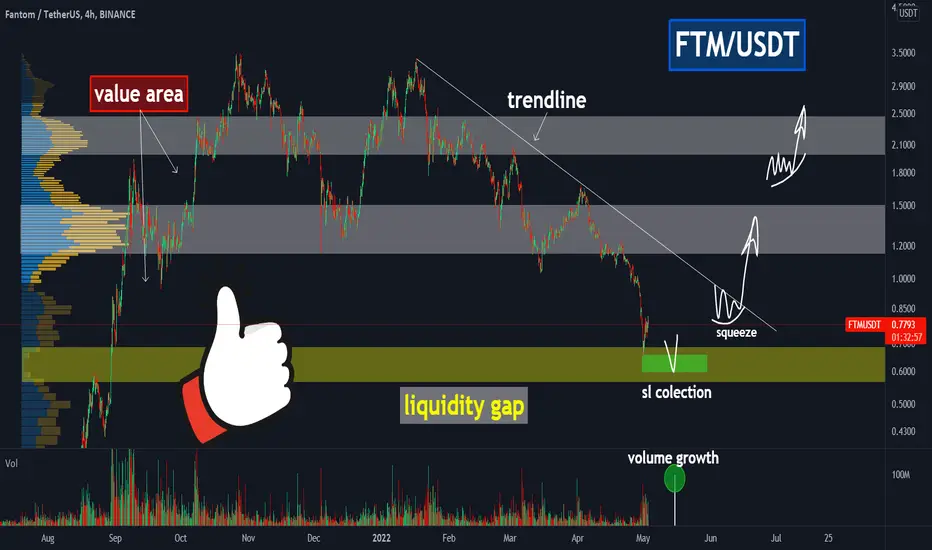
📈FTM: when to open a trade? Is sl collection still possible?📈Fantom(FTM), we have to wait for the RIGHT setup or pattern to open a trade to earn +10%, 20%, 100%, and not mindlessly open trades and lose -2%, -5%, -10%. That's what I'll talk about in this idea.
🚩The key zones on the chart are:
🔶$0.564-0.686 - liquidity gap
⬜$1.15-1.50 - huge value zone
⬜$1.98 -2.45 - value zone
The price touched the liquidity gap , and since there are no buyers or sellers there , the price quickly bounced off that area. To open a long it is necessary to wait for the collection of stop-losses, the whales manipulation, of course, with the growth of volumes on the indicator. That' s why local collection of traders' stop-losses below the level of $0.66 is still possible. After that it is possible to open long trades❗
📍The trendline. When the price touches the global trend line, it is necessary to pay attention to the squeeze. The squeeze shows the willingness of traders to buy and a possible break up soon. You can see manipulation and local stop loss collections sometimes, but the squeeze is one of the most successful and simple strategy I use .
🎯Targets. The first target will be the value zone of $1.15-1.50. If Bitcoin and the entire crypto market will be in uptrend, the price have the chance to reach the second value zone of $1.98 -2.45.
Every crypto (BTC or alts) is unique. Fantom, for example, grows very fast, pumping by 10-20%, so don't miss the entry point😉
🎥You have to wait for the right set-up on the chart, not to trade everything you see. Check out my yesterday video review on Bitcoin, it's relevant to all cryptocurrencies!
GMT could break to 2.95, or reverse if there's more volumeBINANCE:GMTUSDT
Hello everyone,
Gmt shows weakness last few dayes, coud break to 2.95 and 2.65
Trade wisely, and remember that this is not financial advice.
Do your research, and do not forget to like and subscribe if you find this analysis helpful. Thanks

BTC/USDT Long position 22.5.2Hello my friends
Its my idea about BTC long position
Entry price, stop loss and targets are clear in the chart
This Analysis will be updated ...
Sadegh Ahmadi: @SDQ_Crypto
2. May .22
(DYOR)
❤️ If you apperciate my work , Please LIKE and COMMENT , It Keeps me motivated to do better❤️

GMT trade set up. GMT with a daily bearish Div. looks like its loosing strength. My short trigger will be once the trend line breaks and retests it as resistance. From there gmt looks like it will drop to $2 as major support. Below that $1 -0.88c is the next stop.
NFA DYOR

GMT CRYPTO LONG SIGNALSNice to meet you, everyone
I'm an alt trader
I am a South Korean soldier
I'm analyzing and recommending things that are similar to my personality among many alt coins
It is likely to keep up with the upward trend.

GMTUSDTToday’s signal
GMTUSDT
May 2, 2020
7:10 UTC
Follow the signal at this time with entry 2 DCA @ entry 1 use SL
Success traders

GMT/USDT BULLISH BIASHey traders, in today's trading session we are monitoring GMT/USDT for a buying opportunity around 3.2 zone, once we will receive any bullish confirmation the trade will be executed.
Trade safe, Joe.

$GMT may go to 2$ soon. Watch out!!$GMT TRADE SIGNAL FOR THE WEEK - SELL BUY SELL
GMT recently made a new all time high @$4.17.
Breaking the previous high @$3.85.
Price then created a double top on the 4hr,
lower highs on the oscillator and fell hard
from there. Similar scenario to $APE
So now, what are we expecting??
If you said a pullback then you are correct! Friends
Before we get one, I personally would like to see
price tap our demand zone.
I will be looking to go long around that zone
especially after seeing lower time frame bullish
confirmations and watch price trade above $3.13.
A good 10-15% bullish run to 3.50 would be a nice
play and I would not hesitate to take most or all
profits at that level because we may see a run down
to 2$ based off our knowledge on fibonacci retracements.
On seeing bearish confirmations, I may take profits on
buys and hop into sells after the pull back is completed.
Wish us a successful trading week ahead.
#$KC #Meekhill #Meekhillacademy #RICHMMDT

GMT LONG BULL FLAG 15 MINGMT has dropped from hits head and shoulder pattern. Its now in a bull flag on 15 min. If bitcoin runs and it breaks the flag channel. Expect a significant run. This coin is always a gamble. Trade safe.

GMT Token LONG - Break consolidationGMT token remains as one of the few assets that are in an uptrend, at the moment it broke an upward consolidation.
We have an important risk factor to consider that the crypto market is in a downtrend and this can make this operation difficult.
Entry: 2.71
Initial target: 4.22 (55.9%)
Stop: 2.23 (17.4%)
Volume: 8%

🎯BTC: Real Life wedge trading! Tutorial for traders!🌟 The picture of the wedge pattern is beautiful, but you have to understand how to trade in Real Life! In this idea I will try to teach you how to enter the trade and what to look for. The descending wedge is a bullish pattern. On the chart you can see how it works on Bitcoin. Over the past year, it has worked well in 3 out of 3 trades.
🎓What is the wedge? Wedge is the price consolidation in downtrend or uptrend. So if it`s UPTREND, the price making higher highs and higher lows. The whales in this case sell higher and higher. Ascending (uptrend) wedge is bearish pattern. So If it`s downtrend the price making lower highs and lower lows. The big players try to hunt trader stop losses to get the liquidity for their LONG positions.
🚩Let`s start from the May-July 2021 wedge! In addition to the descending wedge, there are several triggers to open a long:
1. false breakout (liquidity collection) of the $30K key level. A lot of stop losses were collected, a lot of traders were liquidated. The whales were happy. Additionally, pay attention to volumes as well as liquidation volumes.
2. squeeze under the upper boundary of the wedge and test it as support. Here you can open a trade during the squeeze under the trendline and after test it as support. It`s better to check at lower timeframe.
All this added up to a long two-month consolidation with stops losses hunting and Bitcoin DUMP by 50-55%. Many traders simply lost faith and closed positions at a loss.
The price rose by 50-60%, but if you had closed the trade on the next Dump, you would have a profit at least +30-35%.
🚩Next is the Sep 2021 wedge! In this case we didn't see big liquidations, the whales had enough liquidity, and everyone who shorted on this 23% drop became the fuel🔥 for further growth. Additional triggers:
1. a trend change. The price trend changed from a downtrend to a small consolidation and then started to create higher highs and lows.
2. squeezing under the local trend line on lower timeframes. If you switch to the 1 hour timeframe this is clearly visible.
3. test of the global and local trend line as support and growth without pullbacks (strength of the bulls).
We close the deal as soon as the target is reached. If you continued to hold the trade for more than 10 days, the profit would be at least +30%.
🚩 Will the fourth wedge break up(4/4)? During this Apr 2021 wedge, we have not seen the huge liquidations yet. Also, we haven't seen bullish strength, squeezes under trend lines or levels. Therefore, we should wait for our entry point and don`t open trades without the confirmation of the trading strategy. I'll share with you my local ideas later.
🌐Globally, the market has been in a $30-67k consolidation for more than 1.5 years. Sooner or later the price will choose the trend and maybe even in the next few weeks.
🔥Trading is the combination of trading tools, using filters and non-standard methods, which I try to explain in my training ideas.
Friends, press the "like"👍 button, write comments and share with your friends - it will be the best THANK YOU.
P.S. Personally, I open an entry if the price shows it according to my strategy.
Always do your analysis before making a trade.

GMT SHORT - The COIN effectCoinbase listings nearly always lead to massive dumps. An overhyped coin like GMT is unlikely to be any different.

GMT Support RetestNice to meet you, everyone
I'm an alt trader
I am a South Korean soldier
I'm analyzing and recommending things that are similar to my personality among many alt coins
GMT Support Retest
