$GMT ready for next leg upno buying here
buying after close above (if any)
have patience kid
cheers,
nav
GMT

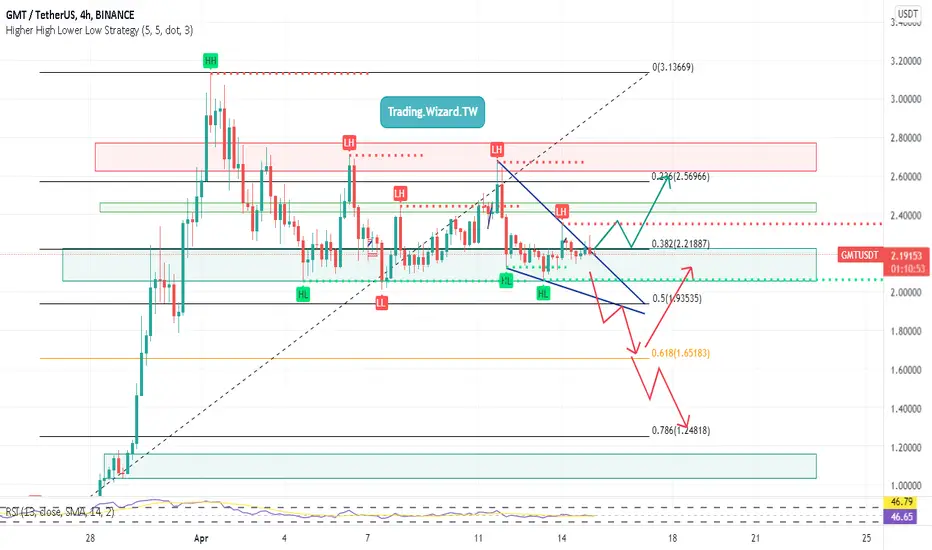
GMTUSDTI will buy here @ 2.37
and I will sell at 2.6
SL: 1 Hr candle close below 2.23
I will short @ 2.6 and buy @2.395
SL: 1 Hr candle close above 2.678

Long GMTGMT had a decent rally of late, it looks to have consolidated a fair amount and now looks like it wants to break to the upside.
Lagging strand above price and cloud on the 1hour. Could go heavier into your position as we come above the cloud on the higher timeframes, and you may want to extend your price target higher.
Stop loss just on the swing low and just below the cloud.

SLP Long (update v2)Hi ! We will see a good reaction in a few days! We must brake this triangle! Hold on

GMT / USDTIn 4h Time frame, we are in this pattern if we go down as you can see in the chart We might move down to the golden zone of fibo
but if we break the pattern from the upper line we will move up
We have to see what will be the next move of BTC
set rules in your trade and you will see trading is not that difficult, You just have to wait for the breakout and confirmation and enter the market based on your strategy oF entry and exit
so I just show you the patterns and you have to enter the market with your own rules.
My analysis are just good for short term not holding or long term, just take the advantage of market movement
THIS IS NOT FINANCIAL ADVICE
USE STOP LOSS
BTC: identified the bottom with VOLUME PROFILE! How to use it?
As we expected, Bitcoin tested the $37800-39600 zone. But how could you predict this? You have to use the volume profile.
A volume profile is close to horizontal volumes (bottom panel), but using them, you can indicate:
1. value areas(support and resistance)
2. liquidity gaps
This indicator is easy to apply, it is in the left sidebar in the "Prediction and Measurement Tools". You can use it to indicate the value zones in ANY crypto/stocks/currency.
Why does it work? The volume profile is a real value data and that's why the price reacts to it most of the time. Similarly, you can use the DOM and Footprint in real time to track the value zones and reversal points for price. If you have questions about it, write in comments or to the DM!
Right now we expect an upward move on Bitcoin:
1. The price has started to squeeze under the $41400-42700 value zone, which shows buyer strength.
2. Volumes have also increased. BIG VOLUMES=BIG PLAYERS.
3. Short traders who opened trades on the fall will be the FUEL for the upward movement.
Friends, press the "like" button, write comments and share with your friends - it will be the best THANK YOU.
P.S. Personally, I open an entry if the price shows it according to my strategy.
Always do your analysis before making a trade.


Bitcoin: 2 trading tips for BEGGINERS!Bitcoin has been in a $30,000 to $67,000 global consolidation for more than a YEAR. You can see on the chart that Bitcoin was down -31%, -36%, -58%, -25%, -52%, -19%. If you use a leverage larger than x2, you could be liquidated multiple times!
Do you want to increase your deposit? Use risk and money management! These are simple rules that help to calculate the risk of your position and the amount of money to buy CRYPTO.
For example, Bitcoin price is $40k and you see a sqeeze under the trend line. Knowing that 60% (6/10) of the time such trend lines break UP, you can divide your capital into 10 parts and buy Bitcoin for 20% of your money with a target of +25% to $50k. That way, the chance of losing your money is minimal (-1-2%) and the profit will be +5% to capital. If you have $10,000, you will earn +$500 per trade. Not bad, don't you think?
In addition, you can also use the short positions, it means to earn on the falls. To do this you:
1. have to understand the basics of trading
2. need to have a desire to study and earnr
This is a short and basic description of risk and money management principles. Trading is easy, but knowing the basics is essential.
If you still have questions how to use the RISK and MONEY management to increase your profitability - write in the comments or to the DM .
Friends, push the like button, write a comment, and share with your mates - that would be the best THANK YOU.
P.S. Always make your analysis before a trade.

GMT / USDTI do trading based on patterns
This is GMT 1H pattern, trade it based on your own strategy just wait for the confirmation to make it short or long
My analysis is good for short term
THIS IS NOT FINANCIAL ADVICE
USE STOP LOSS

$GMT is it repeatable pattern ?BINANCE:GMTUSDT
Hi traders.
If GMT will repeat the same pattern as before, the entry point will be between 2.07 and 2.19.
But watch out it could reverse to 1.80 and 1.6, so don't forget SL.
Trade wisely, and remember that this is not financial advice.
Do your research, and do not forget to like and follow if you find this analysis helpful. Thanks.

Green Metaverse Token AnalysisHey traders, in today's trading session we are monitoring GMTUSDT for a buying opportunity around 2.21 zone, once we will receive any bullish confirmation the trade will be executed.
Trade safe, Joe.

GMTUSDT BINANCE:GMTUSDT price has broken down the triangle and almost has enough consolidation for upside. The bulls are warming up and will surely try to achieve some upside zone with good positive activity.
- BINANCE:GMTUSDT
| buy : 2.44
| TP 1 : 2.53
| TP 2 : 2.73
| TP 3 : 3
stop loss : 2.28

WHAT IS YOUR OPINION ON GMT (STEPN)?GMT is trading within a descending channel.
Should we expect it to bounce from the current FIB32.8 or will it continue to fall down to FiB50 zone?
Skindly share your opinion

SHIBA Volatile Move Ahead: Triangle Analysis FTX:SHIBUSD
Over the course of several months, SHIB has formed a triangle pattern . Triangle patterns are classically ending in a strong climax either way.
Seeing that both crypto and stocks are trading bearish at the moment
most likely scenario will be for SHIB to break bearish
If you have any questions, you can write it in comments below, and I will answer them.
And please don't forget to support this idea with your like and comment, thank you

GMT Analyse As we can See GMT creating a Down Trend Channel by confirming the LL 4 times, and we should wait to see a breakout of the symmetrical triangle, and than decide where to go, be careful of Volume there is lake of volume, even +10% today but it's danger to enter a Long position with an Exploded coin and an unconfirmed Bull/bear Market.
GOOD Luck Everyone.

GMTUSDT - SETUPGMTUSDT price has broken down the triangle and almost has enough consolidation for upside. The bulls are warming up and will surely try to achieve some upside zone with good positive activity.

GMT Possible move to new ATH!GMT broke out of the Bullish Pennant and started an uptrend. Here is a possible path to the new ATH.
-----------------------------------------------------------------------------------------------------------------
Please note that this is not a financial advice. Just my personal idea. Do your own research.

Measured move on GMTThe token for the STEPN game.
I think a measured move is definitely possible here.

GMT Short 100% Profit in 2 Days - Quick TradeSignal ID 0015
GMTUSDT Future Trade
for those of you who have missed the previous trades, here is one more re entry. Dont miss this trade, this will be fast and profitable as well inshaAllah
Re Entry 1 @ 2.29
Re Entry 2 @ 2.32
Tp 1 @ 1.95 - 2$
This will be a quick trade, will most likely take 2 days to play out
Approx 100% Profit with 5x Leverage
As always, max leverage allowed is 5x

GMT\USDT 4H For SHORT!☑️Entry :2.2
🎯 Target 1 : 1.97
🎯 Target 2 : 1.7
🎯 Target 3 : 1.32
🎯 Target 4 : 0.83
🚨More Risk
🎯 Target 5 : 0.57
🎯 Target 6 : 0.44
🎚Leverage : 10X
💰Margin : 5-7% protfo
🚫 Stop loss : 2.4
⌚️Time : Midterm
RR(Risk/Reward ratio) : 5.9 (TP4)

GMT - Potential buying timing!BYBIT:GMTUSDT
4H trend chart
-
GMT is converging and approaching to the downtrend line(resistance) currently.
If price can break out the downtrend line, trading strategy as below.
-
Profit Targets:
a) 2.7093-----Blue horizontal ray
b) 3.1341-----Fib(1)
c) 3.7059~3.9731-----Fib(1.272~1.382)
d) 5.2362-----Fib(2)
Stop losses:
a) 2.0126-----Red horizontal ray
-
If you like this analysis, smash the "like button" and leave a comment below to share your thoughts
or let me know what crypto you want to see!
Trading is a reflection of yourself. Learn more daily and be ready for every opportunity.
Have a nice trading!

GMT 4H : Bullish Wedge Chart patternThe Stepn(GMT) has been one of the best performance in the market recent weeks after its lunch.it has no clear in the 1day time frame because it has not long history.
For now at Time frame 4H It is in the Formed Bullish Wedge pattern which is Continuing pattern. so i think it is breaking upside soon in the coming days and more gain toward $2.7 ~ $2.9. I think it will definently so high potential to huge gain in the coming months.
A bullish Wedge chart pattern takes place in an upwards trend, and the lines slope down. It is also known as a Falling Wedge.
Happy trading 🌷

Is it the break point or not yet?BINANCE:GMTUSDT
It's matter of time. What is your opinion?
Trade wisely, and remember that this is not financial advice. Do your research, and do not forget to like and subscribe if you find this analysis helpful. Thanks
