GMT/USDT Breakout Alert! Major Downtrend Broken🔻 End of a Long-Term Downtrend?
GMT has been in a strong downtrend since late 2024. A clearly defined descending trendline has acted as strong resistance—until now. The price has bounced from the major support zone between $0.0364 and $0.0425, which has held multiple times since March 2025.
🚀 Breakout Confirmation in Progress:
The chart shows a potential breakout from the descending trendline (yellow). A confirmed breakout with volume would indicate the start of a bullish reversal pattern.
🎯 Key Resistance / Profit Targets:
$0.0474 – Initial minor resistance
$0.0555 – First bullish confirmation
$0.0665 to $0.0744 – Medium-term target
$0.0977 to $0.1302 – Strong upside potential
$0.2108 to $0.2471 – Full bullish target zone if momentum continues
📌 Additional Notes:
The highlighted yellow area is a demand zone signaling potential accumulation.
This setup aligns with classic breakout-reversal formations.
Excellent risk/reward due to proximity to strong support.
#GMTUSDT #GMT #CryptoBreakout #AltcoinSeason #CryptoReversal
#TechnicalAnalysis #BreakoutCrypto #TradingSignals #CryptoTA
#BinanceTrading
GMTUSD

GMT New Update (The bullish wave is continuing) 12HThis analysis is an update of the analysis you see in the "Related publications" section
The previous setup is canceled due to the risk of being left behind.
The wave structure has been reanalyzed. It appears that GMT is in a large corrective pattern, likely a diametric, and wave F has completed. Wave F was a symmetrical structure that has now ended.
As long as the POI zone holds, the price can move toward the targets. The targets are marked on the chart. This movement is considered wave G of a higher degree.
A daily candle closing below the invalidation level will invalidate this view.
For risk management, please don't forget stop loss and capital management
When we reach the first target, save some profit and then change the stop to entry
Comment if you have any questions
Thank You

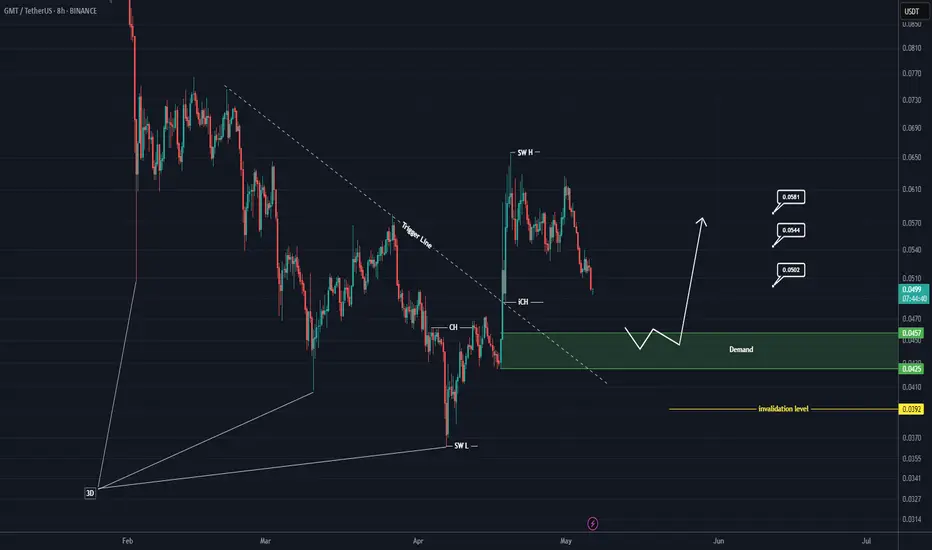
GMT Rebuy Setup (8H)Given the broken 3D pattern at the bottom and the trendline break, our demand zone is considered highly valuable. Therefore, we will look to enter a buy position within the green zone, which has been the origin of a strong move.
The price is currently in a support zone, but we will only enter a position if it reaches the green zone marked on the chart.
A daily candle closing below the invalidation level will invalidate this analysis.
For risk management, please don't forget stop loss and capital management
When we reach the first target, save some profit and then change the stop to entry
Comment if you have any questions
Thank You
GMTUSDT Analysis: Resistance and StrategyIn GMTUSDT, the red boxes represent key resistance zones . However, caution is essential as the price is currently in a strong bullish trend .
Key Highlights:
Red Boxes as Resistance: These zones are significant but require lower time frame confirmations for short entries.
Bullish Momentum: The price shows strength, aligning with my general long position target of 102k$ .
Hedge Strategy: I will consider these levels for hedge shorts while maintaining a broader long bias.
Confirmation Indicators:
Before trading these zones, I recommend using tools such as CDV, liquidity heatmaps, volume profiles, and volume footprints for confirmation.
Learn My Techniques: Interested in mastering these advanced tools to refine your trading? DM me, and I'll teach you step by step!
Support and Motivate: If this analysis helps, please boost and comment. Your engagement drives me to share more!
If you think this analysis helps you, please don't forget to boost and comment on this. These motivate me to share more insights with you!
I keep my charts clean and simple because I believe clarity leads to better decisions.
My approach is built on years of experience and a solid track record. I don’t claim to know it all, but I’m confident in my ability to spot high-probability setups.
If you would like to learn how to use the heatmap, cumulative volume delta and volume footprint techniques that I use below to determine very accurate demand regions, you can send me a private message. I help anyone who wants it completely free of charge.
My Previous Analysis (the list is long but I think it's kinda good : )
🎯 ZENUSDT.P: Patience & Profitability | %230 Reaction from the Sniper Entry
🐶 DOGEUSDT.P: Next Move
🎨 RENDERUSDT.P: Opportunity of the Month
💎 ETHUSDT.P: Where to Retrace
🟢 BNBUSDT.P: Potential Surge
📊 BTC Dominance: Reaction Zone
🌊 WAVESUSDT.P: Demand Zone Potential
🟣 UNIUSDT.P: Long-Term Trade
🔵 XRPUSDT.P: Entry Zones
🔗 LINKUSDT.P: Follow The River
📈 BTCUSDT.P: Two Key Demand Zones
🟩 POLUSDT: Bullish Momentum
🌟 PENDLEUSDT.P: Where Opportunity Meets Precision
🔥 BTCUSDT.P: Liquidation of Highly Leveraged Longs
🌊 SOLUSDT.P: SOL's Dip - Your Opportunity
🐸 1000PEPEUSDT.P: Prime Bounce Zone Unlocked
🚀 ETHUSDT.P: Set to Explode - Don't Miss This Game Changer
🤖 IQUSDT: Smart Plan
⚡️ PONDUSDT: A Trade Not Taken Is Better Than a Losing One
💼 STMXUSDT: 2 Buying Areas
🐢 TURBOUSDT: Buy Zones and Buyer Presence
🌍 ICPUSDT.P: Massive Upside Potential | Check the Trade Update For Seeing Results
🟠 IDEXUSDT: Spot Buy Area | %26 Profit if You Trade with MSB
📌 USUALUSDT: Buyers Are Active + %70 Profit in Total
🌟 FORTHUSDT: Sniper Entry +%26 Reaction
🐳 QKCUSDT: Sniper Entry +%57 Reaction
📊 BTC.D: Retest of Key Area Highly Likely
I stopped adding to the list because it's kinda tiring to add 5-10 charts in every move but you can check my profile and see that it goes on..

GMT Buy/Long Setup (2H) RiskyFirst of all, be aware that this setup is not low-risk. However, the invalidation level is close to the entry zone, and if it gets hit, the setup will be stopped.
There are two liquidity pools on the chart, one above and one below. We anticipate that the upper liquidity pool will be collected first, and then the price will be rejected from the order block above this pool.
From a wave count perspective, we have completed wave A and are now in wave B, which is a diametric pattern. We are currently in the final wave of this diametric, wave G.
After wave B is completed, we expect a bullish wave C.
Manage your risk carefully.
For risk management, please don't forget stop loss and capital management
Comment if you have any questions
Thank You

GMT looks like a rocket (1D)GMT, unlike other altcoins, is in a valuable range.
We have a symmetrical pattern with time-price similarities. Each bearish wave has dropped approximately 80%. Now, the last bearish wave of this symmetrical pattern has also dropped 80%.
The green zone is considered a valuable range for this coin.
The bullish legs of this pattern have usually exceeded 200%.
Since we are in the final bearish wave of this pattern, we should expect a post-pattern move.
This move will be sharper and faster than the previous bullish legs because it is not corrective but post-pattern. If the count is correct, we should see a +200% bullish move from this coin.
A buy opportunity can be considered in the spot market within the green zone.
If a daily candle closes below the invalidation level, this outlook will be invalidated.
For risk management, please don't forget stop loss and capital management
Comment if you have any questions
Thank You

#GMT (SPOT) entry ( 0.1400- 0.1960) T.(0.9500) SL(0.1300)BINANCE:GMTUSDT
#GMT/ USDT
Entry ( 0.1400- 0.1960)
SL 1D close below 0.1300
T1 0.3500
T2 0.5400
T3 0.7900
T4 0.9500
3 Extra Targets(optional) in chart, if you like to continue in the trade with making stoploss very high.
______________________________________________________________
Golden Advices.
********************
* collect the coin slowly in the entry range.
* Please calculate your losses before the entry.
* Do not enter any trade you find it not suitable for you.
* No FOMO - No Rush , it is a long journey.
Useful Tags.
****************
My total posts
www.tradingview.com
1Million Journey
www.tradingview.com
www.tradingview.com
**********************************************************************************************
#Manta #OMNI #DYM #AI #IO #XAI #ACE #NFP #RAD #WLD #ORDI #BLUR #SUI #VOXEL #AEVO #VITE #APE #RDNT #FLUX #NMR #VANRY #TRB #HBAR #DGB #XEC #ERN #ALT #IO #ACA #HIVE #ASTR #ARDR #PIXEL #LTO #AERGO #SCRT #ATA #HOOK #FLOW #KSM #HFT #MINA #DATA #SC #JOE #RDNT #IQ #CFX #BICO #CTSI #KMD #FXS #DEGO #FORTH #AST #PORTAL #CYBER #RIF #ENJ #ZIL #APT #GALA #STEEM #ONE #LINK #NTRN #COTI #RENDER #ICX #IMX #ALICE #PYR #PORTAL #GRT #GMT #IDEX #NEAR #ICP #ETH #QTUM #VET #QNT #API3 #BURGER #MOVR #SKL #BAND #ETHFI #SAND #IOTX #T #GTC #PDA #GMX #REZ #DUSK #BNX #SPELL #POWR #JOE #TIA

Is GMTUSDT Primed for a Breakout?Catch the Wave: GMT on the Verge of a Key Move
As of today, GMTUSDT is trading at $0.1066, standing 97.43% below its historical high of $4.15 from April 2022 and recovering 26.15% from its August 2024 low of $0.0845. The asset’s recent movement shows potential for significant momentum, supported by critical technical markers and volume patterns.
Despite the broader market's indecision, GMTUSDT’s RSI hovers near 53.53, signaling a neutral yet cautiously optimistic stance, while the MFI indicates underwhelming buying pressure at 37.10. This mix of metrics places the asset at a crossroads: consolidation or breakout?
Yesterday, a VSA Manipulation Sell Pattern emerged, hinting at a short-term pullback, but this follows a sequence of "Buy Volume Max" patterns earlier in the week, showcasing a potential accumulation phase. With resistance clustering at $0.1228 and $0.1294, traders should watch for a break above these levels, as this could ignite a rally fueled by a mix of technical and fundamental catalysts.
The question remains: Is the market ready for GMT to reclaim the bullish narrative? For traders and investors, the coming days may offer a defining moment. Are you prepared to ride the wave or step aside?
Roadmap: Tracking GMTUSDT's Patterns to Decode Market Moves
2025-01-19 02:00:00 – VSA Sell Pattern 2
This pattern set the stage with a Sell direction, identifying a potential breakdown below the high_3_bars level of 0.1286. However, the next pattern on 2025-01-19 07:00:00, a VSA Buy Pattern Extra 1st, flipped the narrative, signaling bullish action. This suggests the Sell Pattern 2 failed to activate its trigger point at the high level, indicating limited influence on the market.
2025-01-19 07:00:00 – VSA Buy Pattern Extra 1st
Marked as the turning point, this Buy direction triggered a rally from its low of 0.1195, creating a bullish sequence. Confirmation came with subsequent Buy Volume Max patterns, solidifying the shift in sentiment. Price momentum surged upward, aligning with the main direction of this pattern.
2025-01-20 00:00:00 – Sell Volumes Max
After bullish patterns dominated, this pattern forecasted a Sell direction. The price, previously testing highs near 0.1238, reversed and validated the Sell setup as the market retraced. This indicates a well-executed pivot, setting up traders for potential downside plays.
2025-01-21 16:00:00 – VSA Sell Pattern 4
A critical pattern, forecasting a Sell direction with low_3_bars at 0.099. This confirmed a broader bearish sentiment. As the price failed to reclaim the 0.1051 resistance level, the downward trajectory suggested the market respected the triggers outlined in this pattern.
2025-01-21 17:00:00 – VSA Buy Pattern 5
This pattern followed shortly after, signaling a potential reversal. The Buy direction saw a quick test of prior lows near 0.0979, rallying to challenge 0.1045, providing strong short-term recovery opportunities. This validated the market's responsiveness to consecutive directional shifts.
Conclusion :
The roadmap reveals GMTUSDT's intricate dance between buying and selling pressures, with several patterns confirming their predicted directions and delivering actionable opportunities for traders. Successful patterns like VSA Buy Pattern Extra 1st and Sell Volumes Max provided clear guidance, while occasional misfires remind traders of the importance of trigger points and market confirmation.
Technical & Price Action Analysis: Key Levels to Watch
Support Levels:
The first safety net for GMTUSDT sits at 0.0845, marking the absolute low from August 2024. If buyers fail to hold this line, expect increased pressure, and this level will likely flip into resistance.
Resistance Levels:
GMT faces a series of resistance hurdles ahead. The immediate test is at 0.1228, followed by 0.1294 and 0.1344. If bulls break through these zones, the next battleground lies at 0.1384 and 0.1472. Should these levels reject price action, expect them to act as a ceiling for any upside attempts.
Powerful Support Levels:
Long-term bulls will eye 0.2448, 0.4541, 0.7402, and 0.9678 as key zones for accumulating positions during any deeper corrections. These levels are fortress-like and pivotal for significant reversals.
Powerful Resistance Levels:
While immediate focus remains on nearer resistances, traders should keep in mind these untouched levels that loom higher in the structure. For now, however, the chart shows no specific "powerful resistance levels," emphasizing the importance of breaking closer hurdles.
Pro Tip: Always keep an eye on price action around these levels. If a support gives way, it’s game over for bulls, and the same zone will likely serve as resistance for the next rally attempt. Conversely, breaking through resistance opens the door for extended bullish momentum. Adapt your strategy accordingly—don’t marry a bias, and let the market tell you the story!
Trading Strategies: Fibonacci Rays and Dynamic Factors
Concept of Rays
The "Rays from the Beginning of Movement" method combines Fibonacci mathematical principles with geometric precision to create dynamic levels that adapt to the market's behavior. Rays, drawn from the inception of a trend or corrective move, define boundaries for movement channels and offer insights into price interactions. These interactions, coupled with dynamic factors such as moving averages, provide robust signals for entry and exit points.
Why Rays Work
Predicting exact price levels is impossible due to the financial market's complexity. Instead, rays identify zones of probable reactions, signaling either reversals or continuations. Traders observe price behavior near these zones and make decisions based on confluence with patterns and dynamic support or resistance levels, such as Moving Averages.
Optimistic Scenario
If GMTUSDT interacts positively with ascending rays and surpasses key resistance zones:
First Target: $0.1228 – A breakout above this level confirms bullish momentum.
Second Target: $0.1294 – Continued strength can push the price toward this resistance.
Third Target: $0.1344 – If momentum persists, the next ray interaction will target this zone.
Bonus Levels: $0.1384 and $0.1472 – These levels represent extended bullish objectives based on ray progression.
Pessimistic Scenario
If GMTUSDT interacts negatively with descending rays or fails to hold support levels:
First Target: $0.1038 (MA50) – A breach here indicates bearish continuation.
Second Target: $0.0845 – Testing the absolute low from August 2024 suggests a significant downward shift.
Third Target: $0.0678 – If momentum is bearish, price may interact with this deep support zone, reflecting a broader sell-off.
Dynamic Interaction with Moving Averages
Moving averages play a vital role in confirming ray signals:
MA50 ($0.1038): A close above or below validates the ray's directional bias.
MA100 ($0.1102): Acts as dynamic resistance during upward attempts.
MA200 ($0.1217): A critical barrier to long-term trends and corrections.
MA233 ($0.1227): A key decision point, aligning closely with significant ray levels.
Suggested Trades Based on Rays
Long from $0.1066 to $0.1228: After confirming interaction with ascending rays, target the first resistance zone.
Short from $0.1228 to $0.1038: If price rejects at the resistance ray, aim for MA50 as the initial support target.
Breakout Trade above $0.1228 to $0.1344: A clean breakout signals strong bullish momentum, allowing traders to target subsequent rays.
Reversal Play at $0.0845 to $0.1038: If the price rebounds near the absolute low, capitalize on the recovery toward MA50.
Aggressive Long from $0.1294 to $0.1384: For experienced traders, momentum above the ray at $0.1294 suggests a run to the next dynamic zone.
Call to Action: Let’s Trade Smarter Together!
Hey traders, I hope this analysis gives you a fresh perspective and valuable insights! If you have any questions or want to discuss specific levels, drop your thoughts in the comments—let’s keep the conversation flowing. I’m always happy to engage and share ideas.
If this post resonated with you, hit that Boost button and save it to your favorites. Come back later and see how price respects the rays and levels I’ve highlighted—it’s a great way to sharpen your trading edge. Remember, understanding the key points for entries and exits is the heart of successful trading!
For those curious about my strategy: the rays and levels you see here are generated automatically using my proprietary indicator. It’s a private tool, but if you’re interested, feel free to message me directly to discuss how you can access it.
Got an asset you’d like analyzed? Let me know in the comments or via message. Some requests I’ll happily do for free and share with the community, while private setups can be tailored just for you—discreet and exclusive.
These rays aren’t just for GMT—they work across all assets. If you’re looking for personalized charting and analysis, I’m here to help. Just share the asset you’re tracking, hit Boost, and I’ll add it to my list.
Finally, don’t forget to follow me here on TradingView—this is where I post all my updates and ideas. Let’s build a strong community of traders who learn and grow together. Thanks for your support, and may the charts be ever in your favor!


GMT buy/long setup (2H)A strong source of movement has been tapped, and the lower liquidity pools have been swept clean. The price has encountered an important demand zone. In the upper part of the chart, there are no strong order blocks visible, and the price has already dropped significantly, giving a prolonged corrective phase. It is susceptible to a bullish move.
The targets are marked on the chart.
A 4-hour candle close below the invalidation level would invalidate this analysis.
For risk management, please don't forget stop loss and capital management
Comment if you have any questions
Thank You

Watch GMT Reach $0.26: More Gain Likely in 2025Hello and greetings to all the crypto enthusiasts, ✌
I aim to provide you with a comprehensive overview of the future price potential for GMT , 📚💡
GMT is a highly promising project that skillfully bridges the gap between emerging technologies and the physical world, offering a distinct competitive advantage. Its launch garnered significant media attention, and it quickly established a strong, engaged community within the digital space, attracting both enthusiasts and institutional interest. 📚🎇
Technically, after several months of price correction and consolidation, GMT is now positioned in a favorable spot for growth. The token shows strong potential for at least 60% upside, reflecting its solid foundation and market readiness. Given the current dynamics, it represents an attractive opportunity for future gains. 📚✨
🧨 Our team's main opinion is: 🧨
GMT, blending tech innovation with the physical world, has built a strong community and, after months of consolidation, is poised for a 60% growth, making it a solid investment opportunity.
Give me some energy !!
✨We invest countless hours researching opportunities and crafting valuable ideas. Your support means the world to us! If you have any questions, feel free to drop them in the comment box.
Cheers, Mad Whale. 🐋

GMTUSDT On The Way To 30 CENTS !!!As you can see, the price is likely forming a cup and handle pattern. If our assumption is correct, we should wait for this pattern to break out to see a price increase.
Give me some energy !!
✨We spend hours finding potential opportunities and writing useful ideas, we would be happy if you support us.
Best regards CobraVanguard.💚
_ _ _ _ __ _ _ _ _ _ _ _ _ _ _ _ _ _ _ _ _ _ _ _ _ _ _ _ _ _ _ _
✅Thank you, and for more ideas, hit ❤️Like❤️ and 🌟Follow🌟!
⚠️Things can change...
The markets are always changing and even with all these signals, the market changes tend to be strong and fast!!

GMT Analysis - What Shall we Expect !!!The price is within an ascending wedge and this can be a bullish signal for GMT. However, we need to wait for this wedge to be broken and then wait for the price to rise. Currently, the price can be bearish because more funds have been injected into Bitcoin to allow Bitcoin to find more stability in the coming days.
Give me some energy !!
✨We spend hours finding potential opportunities and writing useful ideas, we would be happy if you support us.
Best regards CobraVanguard.💚
_ _ _ _ __ _ _ _ _ _ _ _ _ _ _ _ _ _ _ _ _ _ _ _ _ _ _ _ _ _ _ _
✅Thank you, and for more ideas, hit ❤️Like❤️ and 🌟Follow🌟!
⚠️Things can change...
The markets are always changing and even with all these signals, the market changes tend to be strong and fast!!

Stepn GMT price analysisWhile the crypto market continues to stagnate, long-forgotten “hype” projects are trying to “shoot”)
🚀 For example, they decided to give a ray of hope to fans of #Stepn OKX:GMTUSDT sneakers
Although there is a prospect of growth of at least x2 to $0.38-0.40, we don't want to buy this asset.
🆗 Because the pump can end at any second and then again many months of sitting in a drawdown.
‼️ Therefore, we would consider this one-time growth as an opportunity to exit the position at $0.40, and if you are lucky, at $0.60 - it's hard to believe higher.
_____________________
Did you like our analysis? Leave a comment, like, and follow to get more

#GMT (SPOT) entry range( 0.1100- 0.1340)T.(0.2330) SL(0.1067)BINANCE:GMTUSDT
entry range( 0.1100- 0.1340)
Target1 (0.1899) - Target2 (0.2330)
3 Extra Targets(optional) in chart, if you like to continue in the trade with making stoploss very high.
SL .1D close below (0.1067)
*** collect the coin slowly in the entry range ***
*** No FOMO - No Rush , it is a long journey ***
**** #Manta ,#OMNI, #DYM, #AI, #IO, #XAI , #ACE #NFP #RAD #WLD #ORDI #BLUR #SUI #Voxel #AEVO #VITE #APE #RDNT #FLUX #NMR #VANRY #TRB #HBAR #DGB #XEC #ERN #ALT #IO #ACA #HIVE #ASTR #ARDR #PIXEL #LTO #AERGO #SCRT #ATA #HOOK #FLOW #KSM #HFT #MINA #DATA #SC #JOE #RDNT #IQ #CFX #BICO #CTSI #KMD #FXS #DEGO #FORTH # AST #PORTAL #CYBER #RIF #ENJ #ZIL #APT #GALA #STEEM #ONE #LINK #NTRN #COTI #RENDER #ICX #IMX #ALICE #PYR #PORTAL #GRT #GMT ***

Will GMTUSDT Pass the $0.203 Test—or Face a Steep Decline?Yello, Paradisers! Will the #GMTUSDT bulls cross the $0.203 level or lose steam? Let's discuss the latest analysis of #GMT and see what's happening:
💎After breaking out of its descending channel resistance, #GMTUSDT now finds itself at a critical juncture, testing the key resistance level at $0.203. A breach above this zone could unravel the bullish momentum and shift the narrative entirely for the bulls.
💎The $0.203 resistance is more than just a price level; it represents a pivotal test of market confidence. A clean daily close above it would confirm a bullish reversal, signaling the potential for #GMT to target significantly higher price levels. Such a move would mark a clear shift in market structure and reignite optimism among traders looking for a sustained uptrend.
💎However, the downside risks cannot be ignored. If #GMTUSD fails to break above $0.203, a retracement toward the critical demand level at $0.1168 becomes likely. This level, aligned with a previously established low, acts as a key safety net for buyers. A failure to hold this support would bring the $0.1030 zone into focus, a vital defense line for bulls.
💎Should #GMT close below $0.1030 on the daily chart, the bullish case would be entirely invalidated. This would confirm a bearish shift in market sentiment, increasing the probability of new lower lows and deeper declines as sellers gain control.
Stay focused, patient, and disciplined, Paradisers🥂
MyCryptoParadise
iFeel the success🌴

GMTUSDT 1WGMT ~ 1W
#GMT So far this support block continues to keep the price from dropping any lower. If you have Conviction on this coin,. Buy in stages from here with a minimum target of 20%+

GMT ANALYSIS (8H)The GMT correction has recently run out. On the chart, this correction seems to be double. It's over now.
Now we have a demand range on which we are looking for buy/long positions. Actually, this demand is our rebuy place.
The target can be the red line.
Closing a daily candle below the invalidation level will violate the analysis.
For risk management, please don't forget stop loss and capital management
When we reach the first target, save some profit and then change the stop to entry
Comment if you have any questions
Thank You

GMT/USD HAS FAILED THE BREAKOUT! TIME TO TAKE SHORT ?GMT/USD has failed to break out, leading to a price drop. You can capitalize on this by considering a short trade for a small target.

GMTUSDT (GMT), falling to support after accumulationHi everybody. GMTUSDT have more then 500K contracts to short position. Resist level - 0.1356, support level and bears target in near time - 0.129. Levels thanks to x-lines script.
Have a nice trading day

GMT accumulation and distribution zonesWhere to buy and where to sell GMT for middle term? BINANCE:GMTUSDT
Possible Targets and explanation idea
➡️W timeframe finally came in to 27 zone (accumulation zone)
➡️Most negative scenario test 27 level or sweep listing low
➡️Based on market mood now absolutely 0 interest from retail investors
➡️Distribution level will be at 0.23 lvl correction + same time its a M imb
➡️ Crucial level from sellers marked horizontal line
Hope you enjoyed the content I created, You can support with your likes and comments this idea so more people can watch!
✅Disclaimer: Please be aware of the risks involved in trading. This idea was made for educational purposes only not for financial Investment Purposes.
---
• Look at my ideas about interesting altcoins in the related section down below ↓
• For more ideas please hit "Like" and "Follow"!

GMT undervalued here GMT binance Launchpad coin & based on Solana
Undervalued here my target sell zone: 1.6 - 1.9
Goodluck

GMT Technical Analysis in 3-Day TimeframeHello everyone, I’m Cryptorphic.
For the past seven years, I’ve been sharing insightful charts and analysis.
Follow me for:
~ Unbiased analyses on trending altcoins.
~ Identifying altcoins with 10x-50x potential.
~ Futures trade setups.
~ Daily updates on Bitcoin and Ethereum.
~ High time frame (HTF) market bottom and top calls.
~ Short-term market movements.
~ Charts supported by critical fundamentals.
Now, let’s dive into this chart analysis:
NZX:GMT is in a downtrend and is currently holding support at $0.13. If the current support remains strong, we are likely to see a bullish rally in NZX:GMT very soon.
The RSI shows a rebound from the oversold range, and it is gaining momentum indicating a bullish move on $GMT.
Key levels:
- Support/Accumulation: $0.13 to CMP.
- Trade: Spot.
- Initial Target: $0.3.
- Higher Target: $0.7.
- Invalidation: A close below the support trendline.
DYOR, NFA.
Please hit the like button to support my content and share your thoughts in the comment section. Feel free to request any chart analysis you’d like to see!
Thank you!
#PEACE
