GMT / USDTIN the H2 time frame we are in this pattern. I do trading based on patterns . wait for the confirmation to make in short or long
this is not financial advice
USE STOP LOSS
GMTUSDT

GMT, My favorite break up pattern is going to confirmGMT, My favorite break up pattern is going to confirm with squeezing to trend line


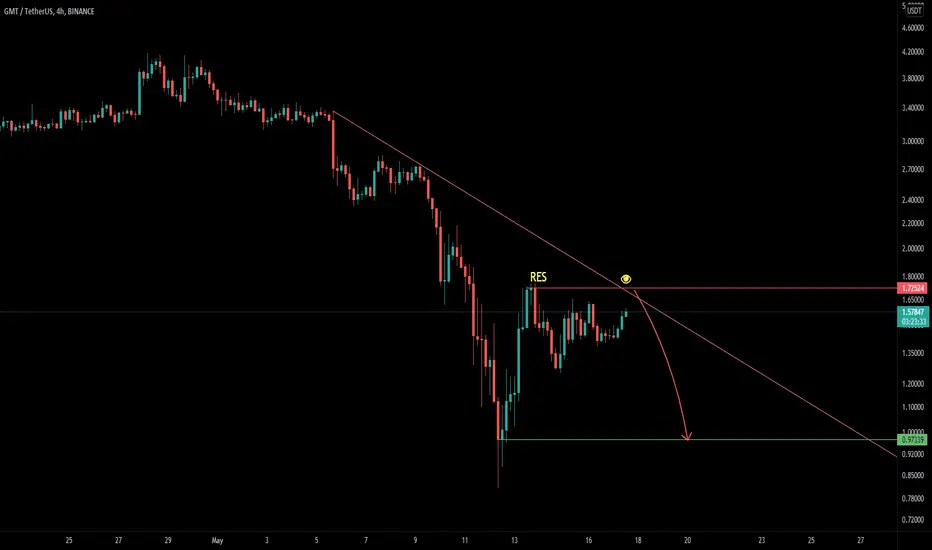
GMT IS AT AN IMPORTANT LEVEL, WHAT NEXTGMT is currently kissing a resistance trendline.
There are 2 possibilities from here.
1. Break above the TL and start running to the NORTH.
2. The TL will act as resistance and drive it to the SOUTH.
Caution is a virtue trading the market this period.
PLEASE,
Kindly like, comment, FOLLow and share your thoughts

GMT - short the ponziGMT made a massive impulse to the downside. This could be the start of another major impulse down OR a ZigZag.
in the bullish case where GMT actually ends it correction here with this latest impulse being the end of a correction, I dont see it making ATHs again.

BNBUSDT biasWe are still in a bear market sadly but we may be up for a short buy(long term) before continuing the sell. Hopefully we get a divergence soon. We may sell for a quick profit if we see a ichimoku cloud breakout in the m15 time frame down to 286.30 or 278. If we don't get a break out we will find a buy set up. Still BEARISH OVERALL .

STEPN GMT/USDT Path Towards $1 Activated!STEPN (GMT) price appears to have chosen the next price movement which is woefully pretty negative. The market sentiments are not in favour of any upward trajectory. Therefore, more blood bath may be expected in the upcoming couple of days.
Considering the GMT price, the price could soon break out of the symmetric consolidation and tank down squeezing another 25% in the upcoming days. The market again fell into bearish well fuelled by Bitcoin prices tanking below $30,000. Therefore, no prominent possibilities a rebound may be expected for the GMT price as the volume has depleted.
Therefore, possibilities of GMT price dropping below $1 support zone emerges.

STEPN GMT Entry Range, Take Profits and Stop LossGMT/USDT
Entry Range: $1.44 - 1.65
Take Profit 1: $1.75
Take Profit 2: $1.92
Take Profit 3: $2.27
Stop Loss: $1.24
short targets reached

GMTUSDT Short ScenarioMarket overall formed a downtrend, and on a 1h timeframe we can see a correction upwards, but recently market broke its higher lows sequence, went above the point of structure break, we are waiting for market to fall down to 1.44 zone which is where it broke a structure and we forecast it will continue falling down.
Entry: 1.44 (Or now for better R/R but more risk)
Invalidation: 1.65535
Target: 0.92347

✅Is GMT ready to PUMP? Long after the false breakout! 📈Stepn (GMT) is now in a triangle and according to technical analysis should break up. But will it really do that? In this idea I will explain to you where you can open a long with the highest probability of success.
✅Why is a long more possible? After bouncing back from the bottom by 100%, retail traders have started to accumulate altcoin in a triangle. On a local manipulation and a break down, a large number of GMT will sell off and a big player will accumulate enough position for a Long. Do you want to be like a big player?
🎯The targets:
1. $1.86-2 - value area, round number
2. $2.61-2.8 - value area
📊What do you need to pay attention to?
🔶The volume indicator will help you understand if a big player bought on this manipulation. The volumes should increase!
🔶Keep an eye on Bitcoin. Altcoins very often repeat its movements, so if there will be such a manipulation on Bitcoin, then also on GMT.
💻Friends, press the "like"👍 button, write comments and share with your friends - it will be the best THANK YOU.
P.S. Personally, I open an entry if the price shows it according to my strategy.
Always do your analysis before making a trade.

GMT ShortThis is not a financial advice-
please do your own research -
As you can see we are in downtrend at least till end of this month and we will see lower price coming in days , GMT is a good investment for long term and our target in a year would be $14-$20 ,
if you are agree or not please leave your comments and don’t forget to like and share .

#GMT/USDT RE_ENTRY !!Hello, dear traders welcome you to this GMT /USDT 4hr chart analysis.
I have tried my best to bring the best possible outcome in this chart.
Hello dear traders, we here new so we ask you to support our ideas with your LIKE and COMMENT, also be free to ask any question in the comments, and we will try to answer for all, thank you, guys.
As we can see from the above-mentioned chart that GMT /USDT is printing an inverse head and shoulder-like pattern which can happen.
If a triangle pattern creates and retests the green zone and then we can take a long entry:-$1.50,$1.56.
GMT has a resistance zone between $2.21-$2.20 which is the longest and strong resistance zone.
and stoploss:-$1.40
If we take an entry at the neckline level of an inverse head and shoulder pattern then we can gain almost 50% to the resistance level and if it breaks the resistance then more % will add.
We will keep updating you.
Thanks for your time, we hope our work is good for you, and you are satisfied, we wish you a good day and big profits.
THANK YOU.

#GMT/USDT 4HOUR UPDATE BY CRYPTOSANDERS !!Hello, dear traders welcome you to this GMT/USDT 4hr chart analysis.
I have tried my best to bring the best possible outcome in this chart.
Hello dear traders, we here new so we ask you to support our ideas with your LIKE and COMMENT, also be free to ask any question in the comments, and we will try to answer for all, thank you, guys.
As we can see from the above-mentioned chart that GMT /USDT is printing an inverse head and shoulder-like pattern which can happen.
If an inverse head and shoulder pattern creates then we can take a long entry:-$1.27,$1.42.
GMT has a resistance zone between $2.21-$2.20 which is the longest and strong resistance zone.
and stoploss:-$1.12
If we take an entry at the neckline level of an inverse head and shoulder pattern then we can gain almost 50% to the resistance level and if it breaks the resistance then more % will add.
We will keep updating you.
Thanks for your time, we hope our work is good for you, and you are satisfied, we wish you a good day and big profits.
THANK YOU.

GMT/USDT BUYING SETUP (SWING)$GMT Breakout bullish pennant with strong buy volume, potential continue upward movement
MACD showing bullish crossover
Buy zone : 1.56 - 1.4 - 1.26
Target : 1.6286 - 1.7494 - 1.8933 - 2.0563
Stop : 1.15

GMTUSDT - a possible increaseP.S. Always do your own analysis before a trade. Put a stop loss. Fix profit in parts. Withdraw profits in fiat and reward yourself and your loved ones

Static resistance is near priceIt seems that the price will decrease after the price hits the static resistance range.
GMT longSimilar to the setup on KNC.
Price and lagging strand above the cloud. Targets and stops on the chart.

GMTUSDTHello my friends , this is my idea about GMT chart , please check it by yourself and its not financial advice !
always manage your RISK

Is this enough speculation for you?...GMT in a "correction" in a downtrend, the case presented its ideal, we might have some supply zones higher which the market is gonna hunt for.

BULLISH IN 1.15 HOURS FOR BTC!I believe that the reversal will occur around 4 am EST ( MAY 16 ) , and we will see #bitcoin hit 32 800 over the next two days and hover there for a couple of days before dropping to 30 700. After that, we will see breakouts like JASMY, SAND, CRO, NEAR, APE, MANA etc.
I am buying the altcoins listed above. Do your research. I believe we will see a new market cap ranking that will become more solidified with currencies tied to NFTS and other needs of the NFT and gaming communities for blockchain P2E. I believe now is a great time to BUY GMT, KNC, APE and NEAR! THEN HOLD AND WHEN YOU UP 20 - 30 % remember retracements are very lucrative used correctly. Trade responsibly and proactively! BE VIGILANT; THE MARKET NEVER SLEEPS! When you sleep, place a stop loss if you're leveraging
REMEMBER YOU HAVE ONLY YOURSELF TO RELY ON!!! KNOW WHAT YOU ARE DOING!!!!!!
DONT WATCH LUNA GO TO 0 then say you lost everything because of LIUNA, I am sorry for the losses but I lost as well and cut them at the point of 30%. Set up a system and remember the market IS VOLATILE AND NOW PICK UP currencies for half price!
Happy Trading!
- EhBeast

GMT - Buying strategyBYBIT:GMTUSDT
1H trend chart
-
GMT keeps consolidating and the low points are getting higher gradually.
If price can overcome the downtrend line, trading strategy as below.
-
Profit Targets:
a) 1.7342-----Fib(1)
b) 1.987~2.0893-----Fib(1.272~1.382)
Stop losses:
a) The relative low point after breaking out downtrend line-----Red horizontal ray
-
If you like this analysis, smash the "like button" and leave a comment below to share your thoughts
or let me know what crypto you want to see!
Trading is a reflection of yourself. Learn more daily and be ready for every opportunity.
Have a nice trading!


BTCUSDT H4In the H4 timeframe, I expect corrosion correction to the desired levels.
👤SecondChanceCrypto
📅15.May .22
⚠️(DYOR)
