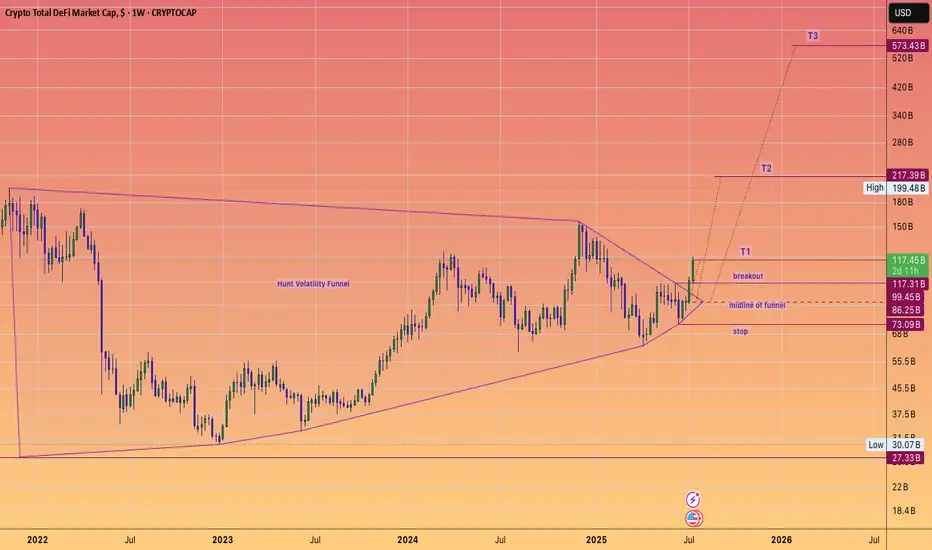
DeFi Moonshot! Moon mission to $573 Billion dollars!DEFI fuelled by Ethereum, built on proven protocols and stablecoin legislation is ready to keep cranking higher for the rest of the year. And instead of a Defi summer of emergence (2020), a multi season of adoption that takes it to half a trillion dollars, hitting these targets of a #HVF
@TheCryptoSniper
The components set to benefit are:
Uniswap #UNI ~ $12.3 Billion
Lido DAO #LDO ~ $9.1 Billion
Aave #AAVE ~ $7.5 Billion
MakerDAO #MKR ~ $4.6 Billion
GMX #GMX ~ $2.5 Billion
Curve #CRV ~ $1.9 Billion
Synthetix #SNX ~ $1.1 Billion
Pulsex #PLSX ~ $0.46 Billion
Key points:
The #TotalDefi index is currently at $117B aligning closely with the $123.6B of TVL
As we see hundreds of billions of dollars get digitized watch this index climb onwards and upwards... With $1 Trillion dollars and obvious milestone that is surely set to be met ... one day.
GMX
GMX is Still Bearish (12H)From the point where we placed a red arrow on the chart, it appears that GMX has entered a bearish diametric pattern.
It now seems that wave F is nearing completion.
The target is marked on the chart. it could be the green target box. If a daily candle closes above the upper red box, this analysis will be invalidated.
For risk management, please don't forget stop loss and capital management
Comment if you have any questions
Thank You

GMXUSDT 1DGMX ~ 1D Analysis
#GMX High risk trading, Buy after successfully penetrating this resistant line with a short -term target of at least 10%+.

GMX/USDTHello friends
Due to the heavy price drop on the indicated support, buyers have provided good support for the price, which has caused a good price growth.
Now you can buy in steps in the indicated support areas.
If you want to be with us in the Alt Season, send us a message.
*Trade safely with us*

GMXUSDT 5DGMX ~ 5D
#GMX So far it still maintains this support block,. Buy in stages from here with a minimum target of 20%++

GMXGMX/USDT Analysis
📊 Introduction
GMX token is considered one of the high-risk assets in the cryptocurrency market, as its relatively low market cap leads to significant price volatility. However, GMX has attracted considerable attention from investors due to its high growth potential in areas related to DeFi and decentralized contracts. In this analysis, we will examine GMX's price structure within a descending channel and explore the possible scenarios ahead.
🔎 Technical Analysis
Overall Trend in the Descending Channel
Channel Structure: GMX is currently moving within a descending channel and has experienced a sharp price correction after hitting the upper boundary of the channel.
Key Levels:
Resistance Zone (Yellow): The range of $26.50 - $27.26, a break above which could pave the way for a bullish move.
Midline of the Descending Channel: This level plays a crucial role in determining the current trend, and breaking above it would be a strong indication of buyer dominance.
Bullish Scenario (Breakout of Resistance Zone)
If the price breaks the yellow resistance zone and stabilizes above it, a bullish move is likely to gain momentum.
After breaking both the resistance and the midline of the channel, the price will approach the upper boundary of the channel. A breakout here could lead to further upward movement towards target levels.
Take Profit Targets (TP):
TP1: $44.57 - $47.86
TP2: $57.68 - $61.98
TP3: $77.88 - $82
🔍 Key Insight: Due to GMX’s low market cap, a significant influx of liquidity could push the price even beyond these targets.
Relative Strength Index (RSI)
The RSI moving above the midline serves as a critical confirmation, signaling bullish momentum alongside the breakout from the resistance zone and the midline of the descending channel.
Volume
An increase in trading volume during the breakout of the resistance zone and midline is crucial. High volume can prevent fake breakouts and provide confirmation for the continuation of the bullish trend.
🔒 Risk Management Key Points
Suggested Entry Point:
Enter after the breakout of the yellow resistance zone ($26.50 - $27.26) and price stabilization above it.
Stop Loss (SL):
Place the stop loss below the lower boundary of the descending channel to mitigate the risk of potential volatility.
Trade Volume Management:
Given GMX’s high volatility and inherent risk, the trade volume should be adjusted according to the investor's risk tolerance.
✨ Final Conclusion
The analysis suggests that GMX token has significant growth potential, especially if key resistance levels are broken and new liquidity flows into the market. However, monitoring technical confirmations (such as RSI and trading volume) and staying alert to market trends are crucial for successful trade entry.

#GMX (SPOT) IN ( 21.00- 24.50) T.(83.00) SL(19.73)BINANCE:GMXUSDT
#GMX/ USDT
Entry( 21.00- 24.50)
SL 1D close below 19.73
T1 34.00
T2 44.00
T3 62.00
T4 83.00
______________________________________________________________
Golden Advices.
********************
* collect the coin slowly in the entry range.
* Please calculate your losses before the entry.
* Do not enter any trade you find it not suitable for you.
* No FOMO - No Rush , it is a long journey.
Useful Tags.
****************
My total posts
www.tradingview.com
**********************************************************************************************
#Manta #OMNI #DYM #AI #IO #XAI #ACE #NFP #RAD #WLD #ORDI #BLUR #SUI #VOXEL #AEVO #VITE #APE #RDNT #FLUX #NMR #VANRY #TRB #HBAR #DGB #XEC #ERN #ALT #IO #ACA #HIVE #ASTR #ARDR #PIXEL #LTO #AERGO #SCRT #ATA #HOOK #FLOW #KSM #HFT #MINA #DATA #SC #JOE #RDNT #IQ #CFX #BICO #CTSI #KMD #FXS #DEGO #FORTH #AST #PORTAL #CYBER #RIF #ENJ #ZIL #APT #GALA #STEEM #ONE #LINK #NTRN #COTI #RENDER #ICX #IMX #ALICE #PYR #PORTAL #GRT #GMT #IDEX #NEAR #ICP #ETH #QTUM #VET #QNT #API3 #BURGER #MOVR #SKL #BAND #ETHFI #SAND #IOTX #T #GTC #PDA #GMX #REZ #DUSK #BNX #SPELL #POWR #JOE #TIA #TFUEL #HOT #AVAX #WAXP #OGN #AXS #GALA #ONE #SYS #SCRT #DGB #LIT #QI #FIL #GLMR #ATOM #LTC #MANA #ONT #TLM #SLP #ROSE #NEO #EGLD

GMXUSDT: Buy Zones in Chaos! GMXUSDT: Buy Zones in Chaos! 💎
Blue box looks okey but green line will probably come.
When the market crumbles, opportunities arise. GMXUSDT is no exception.
Blue Box Zone: This is where I’ll take action. If the price reaches this carefully selected area, it’s a solid buying opportunity.
Remember, trading during such volatile times requires confirmation. Tools like CDV, volume profile, and structure breaks on lower time frames are essential.
Stay calm, stay calculated, and let’s make the most of this chaos. Boost, comment, and follow for more winning strategies! 🚀
Let me tell you, this is something special. These insights, these setups—they’re not just good; they’re game-changers. I've spent years refining my approach, and the results speak for themselves. People are always asking, "How do you spot these opportunities?" It’s simple: experience, clarity, and a focus on high-probability moves.
Want to know how I use heatmaps, cumulative volume delta, and volume footprint techniques to find demand zones with precision? I’m happy to share—just send me a message. No cost, no catch. I believe in helping people make smarter decisions.
Here are some of my recent analyses. Each one highlights key opportunities:
🚀 GMTUSDT: %35 FAST REJECTION FROM THE RED BOX
🎯 ZENUSDT.P: Patience & Profitability | %230 Reaction from the Sniper Entry
🐶 DOGEUSDT.P: Next Move
🎨 RENDERUSDT.P: Opportunity of the Month
💎 ETHUSDT.P: Where to Retrace
🟢 BNBUSDT.P: Potential Surge
📊 BTC Dominance: Reaction Zone
🌊 WAVESUSDT.P: Demand Zone Potential
🟣 UNIUSDT.P: Long-Term Trade
🔵 XRPUSDT.P: Entry Zones
🔗 LINKUSDT.P: Follow The River
📈 BTCUSDT.P: Two Key Demand Zones
🟩 POLUSDT: Bullish Momentum
🌟 PENDLEUSDT.P: Where Opportunity Meets Precision
🔥 BTCUSDT.P: Liquidation of Highly Leveraged Longs
🌊 SOLUSDT.P: SOL's Dip - Your Opportunity
🐸 1000PEPEUSDT.P: Prime Bounce Zone Unlocked
🚀 ETHUSDT.P: Set to Explode - Don't Miss This Game Changer
🤖 IQUSDT: Smart Plan
⚡️ PONDUSDT: A Trade Not Taken Is Better Than a Losing One
💼 STMXUSDT: 2 Buying Areas
🐢 TURBOUSDT: Buy Zones and Buyer Presence
🌍 ICPUSDT.P: Massive Upside Potential | Check the Trade Update For Seeing Results
🟠 IDEXUSDT: Spot Buy Area | %26 Profit if You Trade with MSB
📌 USUALUSDT: Buyers Are Active + %70 Profit in Total
🌟 FORTHUSDT: Sniper Entry +%26 Reaction
🐳 QKCUSDT: Sniper Entry +%57 Reaction
📊 BTC.D: Retest of Key Area Highly Likely
This list? It’s just a small piece of what I’ve been working on. There’s so much more. Go check my profile, see the results for yourself. My goal is simple: provide value and help you win. If you’ve got questions, I’ve got answers. Let’s get to work!

#GMX (SPOT) IN (29- 33) T. (85) SL(27.19)BINANCE:GMXUSDT
#GMX / USDT
Entry (29- 33)
SL 4H close below 27.19
T1 35
T2 36
T3 42
T4 85
______________________________________________________________
Golden Advices.
********************
* collect the coin slowly in the entry range.
* Please calculate your losses before the entry.
* Do not enter any trade you find it not suitable for you.
* No FOMO - No Rush , it is a long journey.
Useful Tags.
****************
My total posts
www.tradingview.com
1Million Journey
www.tradingview.com
www.tradingview.com
**********************************************************************************************
#Manta #OMNI #DYM #AI #IO #XAI #ACE #NFP #RAD #WLD #ORDI #BLUR #SUI #VOXEL #AEVO #VITE #APE #RDNT #FLUX #NMR #VANRY #TRB #HBAR #DGB #XEC #ERN #ALT #IO #ACA #HIVE #ASTR #ARDR #PIXEL #LTO #AERGO #SCRT #ATA #HOOK #FLOW #KSM #HFT #MINA #DATA #SC #JOE #RDNT #IQ #CFX #BICO #CTSI #KMD #FXS #DEGO #FORTH #AST #PORTAL #CYBER #RIF #ENJ #ZIL #APT #GALA #STEEM #ONE #LINK #NTRN #COTI #RENDER #ICX #IMX #ALICE #PYR #PORTAL #GRT #GMT #IDEX #NEAR #ICP #ETH #QTUM #VET #QNT #API3 #BURGER #MOVR #SKL #BAND #ETHFI #SAND #IOTX #T #GTC #PDA #GMX

GMXUSDT: 550% Profit PotentialGMXUSDT on the 4-hour timeframe is exhibiting a strong bullish setup with a potential 550% profit at 10x leverage. This long trade opportunity, identified using the Risological Swing Trading Indicator , is positioned to deliver significant returns. The price has broken through key resistance levels, confirming upward momentum.
Key Levels:
Entry: $29.525
SL: $26.955
TP1: $32.695 🔄
TP2: $37.825 🔄
TP3: $42.960 🔄
TP4: $46.130 🔄
Technical Analysis:
The trade commenced at $29.525, with a protective stop-loss at $26.955, ensuring a favorable risk-to-reward ratio. The price action has remained firmly above the Risological trend line, underscoring the strength of the current uptrend. Fibonacci extensions validate the profit targets, while the breakout above resistance levels signals a likely continuation to the upper targets. This setup demonstrates the precision and reliability of the Risological Swing Trading Indicator in identifying high-potential opportunities with controlled risk.
All the best!
Namaste!

FREE SIGNALHello guys
After the bottoming, this coin was able to hit its weekly resistance, and now, considering the pullback it has made, it is a good time to buy it for the goals we specified for you.
Be successful and profitable.

What currencies are Trend 2025?hello friends
This altcoin, which is active in the field of DEFI and can grow well in 2025, is now in a good range with the correction it has made, so it is a step to buy.
The second step is the lower range that we specified for you.
Note that DEX tokens can experience good growth in 2025.
So be sure to have it in your basket.
Be successful and profitable.

GMXUSDT Short Setup Crushes TP1! Bearish Momentum Eyes TP4GMXUSDT on the 4-Hour timeframe executed a short trade setup, successfully hitting TP1 and showing strong momentum to likely reach the remaining targets.
Trade Highlights:
Entry: $36.805
TP1: $30.815 (DONE)
TP2: $21.125
TP3: $11.430
TP4: $5.445
Stop Loss: $41.650
Technical Insights:
The downtrend is well-supported by bearish confirmations from the Risological Trading Indicator , with clear rejection at resistance levels. Momentum indicators suggest a continuation of the bearish move.

GMXUSDT: The Blue Box as a Strong Demand ZoneThe blue box on this chart highlights a carefully identified demand zone, which signals a key area of potential buying interest. This zone is derived from technical analysis and represents a level where buyers are likely to regain control, pushing prices higher. Here's a detailed breakdown of this analysis:
1. Understanding the Demand Zone
A demand zone is a price area where significant buying interest exists, often leading to a reversal or sustained upward move. These zones are derived from historical price action and are reinforced by various confluence factors.
Blue Box Characteristics: This blue box represents a primary demand zone. It is based on the last significant area of consolidation before a strong bullish move, making it a key level of support.
Confidence Level: The blue box is considered high-confidence due to confluences such as Fibonacci retracement levels, order block dynamics, and volume profile analysis.
2. How Was This Zone Identified?
This demand zone is drawn using the following methods:
Fibonacci Retracement: The 0.618–0.786 range, drawn from the last swing low to swing high, aligns with the demand zone.
Order Block Analysis: The blue box highlights the last bearish candle before a significant bullish breakout, indicating institutional activity.
Volume Profile: This zone coincides with a high-volume node, suggesting strong accumulation by market participants.
Market Structure: The zone respects the higher low pattern in the overall bullish structure, reinforcing its importance.
3. How to Trade the Blue Box
When the price approaches the blue box, consider the following strategies:
Wait for Confirmation: Monitor the price action for bullish signals, such as a hammer, engulfing candle, or bullish divergence on RSI/MACD.
Set Stop-Loss Orders: Place stop-losses slightly below the demand zone to account for potential false breakouts.
Target Levels: Set take-profit levels at the next resistance zones or Fibonacci extension levels (e.g., 1.272 or 1.618).
4. Additional Confirmation Signals
Strengthen the reliability of trades using these signals:
Volume Spikes: Look for increased volume as the price enters the blue box, signaling buyer interest.
Bullish Divergences: Identify divergences between price and momentum indicators like RSI or MACD.
Break of Local Resistance: A strong break above nearby resistance after testing the blue box further validates the demand zone.
5. Example Scenarios
Scenario 1: Price retraces into the blue box and forms a bullish engulfing candle. Enter a long position with a stop-loss below the zone and target the previous swing high.
Scenario 2: Price consolidates within the blue box, forming higher lows on lower timeframes. This signals accumulation, presenting a lower-risk entry.
This analysis is designed to provide clarity and actionable insights for your trading. While no strategy is infallible, the blue box demand zone offers a high-probability setup based on proven technical principles.
I keep my charts clean and simple because I believe clarity leads to better decisions.
My approach is built on years of experience and a solid track record. I don’t claim to know it all, but I’m confident in my ability to spot high-probability setups.
My Previous Analysis
🐶 DOGEUSDT.P: Next Move
🎨 RENDERUSDT.P: Opportunity of the Month
💎 ETHUSDT.P: Where to Retrace
🟢 BNBUSDT.P: Potential Surge
📊 BTC Dominance: Reaction Zone
🌊 WAVESUSDT.P: Demand Zone Potential
🟣 UNIUSDT.P: Long-Term Trade
🔵 XRPUSDT.P: Entry Zones
🔗 LINKUSDT.P: Follow The River
📈 BTCUSDT.P: Two Key Demand Zones
🟩 POLUSDT: Bullish Momentum
🌟 PENDLEUSDT: Where Opportunity Meets Precision
🔥 BTCUSDT.P: Liquidation of Highly Leveraged Longs
🌊 SOLUSDT.P: SOL's Dip - Your Opportunity
🐸 1000PEPEUSDT.P: Prime Bounce Zone Unlocked
🚀 ETHUSDT.P: Set to Explode - Don't Miss This Game Changer
🤖 IQUSDT: Smart Plan
⚡️ PONDUSDT: A Trade Not Taken Is Better Than a Losing One
💼 STMXUSDT: 2 Buying Areas

GMX/USDT Trading ScenarioGMX is another undervalued asset in the current market. Its price is currently 70% below its all-time high (ATH), yet there is potential for it to reach that level again. The asset is currently trading at $28.37, close to its local minimum.
From a volume analysis perspective, the asset is at the Point of Control (POC), which formed in May 2024, when the asset was in an accumulation phase. Trading volumes also indicate heightened interest from market participants in this price range.
Despite the overall positive trend, the asset has not yet shown significant growth. However, with the upcoming altseason, it has strong potential to surpass its historical maximum.

GMX Long Spot Trade (Accumulation Breakout)Market Context:
GMX is exhibiting signs of accumulation exit, with price action hinting at a potential breakout. A sustained move above $30, followed by a successful retest of this level as support, could confirm continuation toward higher targets.
Trade Setup:
Entry Zone: Around support at $30.00
Take Profit Targets:
First target: $40.00
Second target: $49.50
Third target: $70.00
Stop Loss: Daily close below $25.00
This trade capitalizes on the breakout potential and a confirmed support flip for a strong upward continuation. Keep an eye on volume to confirm breakout strength.

#GMX Showing Signs Of Bullish Breakout | Watch These LevelsYello Paradisers! Is #GMX gearing up for a major breakout, or will we see a downward spiral? Let's dive into the latest #GMXUSDT analysis to uncover what's brewing:
💎#GMX is showing strong signals of a potential bullish breakout from the descending trendline, following several failed attempts. The recent price action showed a loss of momentum after facing a sharp rejection at the key $29.09 resistance.
💎The price is heading towards a potential retest of the support zone around $19.6-$20.9. This zone is crucial as #GMX attempts to gather fresh momentum. If GMX manages to bounce off this demand area and break through the $29.09 resistance once more, we could witness a strong upward push, re-establishing a bullish structure. This would significantly increase the likelihood of #GMXUSD surging past the current resistance levels.
💎However, if the price fails to maintain above the $19.6-$20.9 support zone and breaks below, it could trigger a downward movement towards the $17.2 demand zone. This area is relatively fresh and may attract buyers, potentially leading to a sharp rebound if respected.
💎If TSX:GMX slips below the $17.2 level without showing any signs of strength, it would signal a bearish shift, opening the door for an even deeper correction. You should be cautious, as failing to hold this level could accelerate the sell-off.
Remember, Paradisers, trade smart, and avoid emotional decisions.
MyCryptoParadise
iFeel the success🌴

Alikze »» GMX | Ascending Channel - 1H🔍 Technical analysis: Ascending Channel - 1H
- It is moving in an ascending channel in the one-hour time frame.
Due to the formation of a Double Top pattern in the range of 24 dollars, it has faced selling pressure.
Therefore, it can face demand by continuing the correction in the OB area of 22.40 or by pulling back to the previous ceiling.
- So, in the case of a pullback to the previous ceiling and the OB zone of $22, it can face demand and continue its growth up to the supply range of $25.
🟩 Support ranges: 22.27 - 22.40
♻️ Return zone: 21.68
⛳️ TP: 23.44 - 24.20 - 24.60 - 25 -25.40
⚠️ In addition, if it penetrates and stabilizes below the range of 21.68, the bullish scenario will be invalid. Therefore, as long as the candles are above the range of 21.68, the upward trend can continue. ⚠️
»»»«««»»»«««»»»«««
Please support this idea with a LIKE and COMMENT if you find it useful and Click "Follow" on our profile if you'd like these trade ideas delivered straight to your email in the future.
Thanks for your continued support.
Best Regards,❤️
Alikze.
»»»«««»»»«««»»»«««
BINANCE:GMXUSDT

GMX sell/short setupFrom where we put the green arrow on the chart, it looks like a triangle is forming.
Now we seem to be at the end of wave d.
We are looking for sell/short positions in the red range. In this range, the e-wave and the whole triangle can be completed.
Closing a daily candle above the invalidation level will violate the analysis.
For risk management, please don't forget stop loss and capital management
Comment if you have any questions
Thank You

Have you forgotten $GMX?Hi everyone, this is BINANCE:GMXUSDT.P idea for its upcoming (major) breakout and from the long-term downtrend.
GMX (Limit or Market either one is fine)
Entry: 24-28 range
SL: 19.965
TP 1: 33.131
TP 2: 48.195
Leverage: 10-20X
Potential profit 70% for short to mid-term
Hopefully this will work out well and everyone makes profit.
Alongside, would be BINANCE:AVAXUSDT.P and BINANCE:ARBUSDT.P perhaps.
I might provide updates to this idea as and when necessary.

GMX Technical Analysis in 3-Day TimeframeHello everyone, I’m Cryptorphic.
For the past seven years, I’ve been sharing insightful charts and analysis.
Follow me for:
~ Unbiased analyses on trending altcoins.
~ Identifying altcoins with 10x-50x potential.
~ Futures trade setups.
~ Daily updates on Bitcoin and Ethereum.
~ High time frame (HTF) market bottom and top calls.
~ Short-term market movements.
~ Charts supported by critical fundamentals.
Now, let’s dive into this chart analysis:
GMX recently rebounded from its lower support trendline and is gearing up for a potential rally toward $40+.
The 21 MA is acting as temporary resistance, and once GMX breaks through this, it is likely to test the upper resistance at $45.
- Entry range: $22 to CMP.
- Close Position: If it breaks down below $22.
- Short-term Target: $42 to $58.
- Mid-term Target: $58 to $72.
- Long-term Target: $71 to $91.
DYOR, NFA.
Smash the like button, share it with your crypto enthusiast, and follow for more updates.
Thanks
#GMX #cryptocurrency

GMX is BearishAfter the bearish iCH, the price structure has become bearish.
A trend line has also been broken
By maintaining the resistance swap range, it can drop towards the targets.
The targets are clear on the chart.
Closing a daily candle below the invalidation level will violate the analysis
Note that the financial market is risky, so:
Do not enter any position without confirmation and trigger.
Do not enter a position without setting a stop.
Do not enter a position without capital management.
When we reach the first TP, save some profit and try to move the stop continuously in the direction of your profit.
If you have any comments please post them, comments will help us improve our performance
Thanks

GMXGMX is a decentralized spot and perpetual exchange that operates on the Arbitrum and Avalanche blockchains, offering traders low swap fees and zero price impact trades. It leverages a unique multi-asset pool that provides liquidity for trades and earns yield from market making, swap fees, and leverage trading.
Given GMX's innovative approach to decentralized trading and its recent market trends, the next price targets for GMX could be $36, $44, and $52. Investors might consider capitalizing on this upward trend by entering a position at the current level. This trading idea is predicated on the continued growth and innovation in the DeFi sector, with GMX positioned as a key player due to its unique trading features and liquidity solutions.
