Goatseus Maximus(GOAT) Ready to FALL!!!(Alert)!!!Today, I want to analyze the Goatseus Maximus(GOAT) memecoin, which has increased almost 😱+1500%😱 in less than 12 days .
What is Goatseus Maximus (GOAT)!?
Goatseus Maximus (GOAT) is a meme coin within the Solana( BINANCE:SOLUSDT ) ecosystem, which has gained significant attention due to its AI-driven features and strong community backing. Its recent surge in price has been driven by multiple factors, including listings on major exchanges.
⚠️Regarding the GOAT memecoin , I must warn that as if the team members of GOAT are NOT known, the specific website or social media(just X Platform) related to GOAT that have been approved by the project team CANNOT be found . As a result, please pay more attention to capital management before buying GOAT .⚠️
In terms of Technical Analysis , GOAT is moving near the lower line of the Ascending Channel and Potential Reversal Zone(PRZ) .
Also, the Evening Star Candlestick Reversal Pattern in PRZ and the Huge volume of the third candle of this pattern again indicate the return and fall of GOAT .
Also, Regular Divergence(RD-) between Consecutive Peaks .
I expect GOAT to drop at least 🚨 -50% 🚨 after breaking the lower line of the ascending channel, according to the explanation above .
⚠️Note: If GOAT can trade above $1.00 for 2-3 days, we can expect an increase.⚠️
Goatseus Maximus Analyze ( GATEIO:GOATUSDT ), 1-hour time frame⏰.
🔔Be sure to follow the updated ideas.🔔
Do not forget to put Stop loss for your positions (For every position you want to open).
Please follow your strategy and updates; this is just my Idea, and I will gladly see your ideas in this post.
Please do not forget the ✅' like '✅ button 🙏😊 & Share it with your friends; thanks, and Trade safe.
Goat

GOATSEUS MAXIMUS - CONSOLIDATION BEFORE EXPLOSION TO THE TOP 100Technical Analysis for GOATSEUS MAXIMUS (GOATUSDT) + TRADE PLAN
Overview and Price Movement:
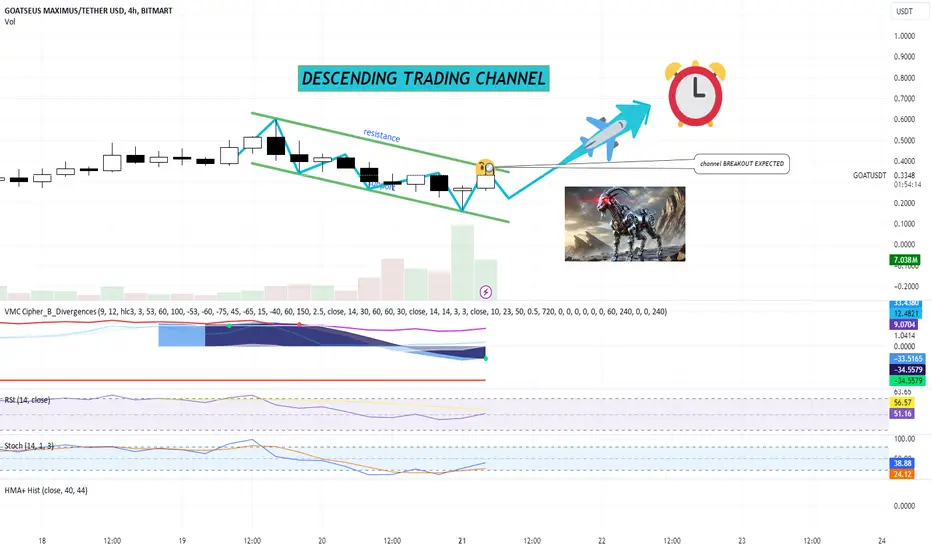
Current Price: $0.3180 (according to the chart).
Price Range: The price has fluctuated between a low of $0.2571 and a high of $0.3800 within the observed time frame.
Volume: Significant trading volume is noted, with a recent surge reaching 6.703M, suggesting rising interest and liquidity.
Descending Trading Channel:
The chart shows a descending trading channel, with price consistently testing the lower and upper bounds.
Resistance Level: The upper trendline of the descending channel represents a resistance level where the price has struggled to break through.
Support Level: The lower boundary of the descending channel serves as a support level, and the price has bounced back multiple times from this level.
Breakout Potential:
There is an indication of a potential breakout. The price has recently tested the upper trendline and is approaching a critical resistance level. The illustrated expectation suggests that the price may break out of the channel.
Time-sensitive breakout: The chart suggests that a breakout might occur shortly, as highlighted by the visual cues (alarm clock).
Indicators Analysis:
VMC Cipher B: Displays divergences, which are often early signals of potential trend reversals. In this case, the indicator suggests a weakening downward momentum.
RSI: Currently at 49.61, which indicates a neutral zone. It implies that the asset is neither overbought nor oversold, giving room for potential upward momentum after a breakout.
Stochastic RSI: Currently at 22.83, which is in the oversold zone. This reinforces the potential for a bullish reversal in the near term.
Hull Moving Average (HMA): The HMA is smoothing out the price movements, but its current position supports the possibility of a breakout from the channel in the next few candles.
Trading Plan for GOATUSDT
Entry Strategy:
Aggressive Entry: Enter at the current price ($0.3180) with the expectation of a breakout. This strategy capitalizes on momentum.
Conservative Entry: Wait for a confirmed breakout above the resistance level of the descending channel (around $0.3800) with a 4-hour candle close above this level.
Stop-Loss Placement:
Place a stop-loss below the support level of the descending channel (around $0.2570), as a breakdown below this level would invalidate the bullish thesis.
A tight stop-loss can be placed at around $0.2900 to manage risk more conservatively in case of a false breakout.
Profit Targets:
First target: If the breakout occurs, aim for the first profit target near $0.5000, as psychological resistance tends to form around these round figures.
Second target: A more extended target can be placed around $0.7000, which could be reached in a strong bullish continuation.
Risk Management:
Risk no more than 1-2% of your capital on this trade to ensure proper risk management.
Adjust the position size according to the stop-loss and entry level.
Time Horizon:
Short to medium term, with a breakout expected within the next few trading sessions (as highlighted by the chart's time-sensitive breakout indicator).
Continuously monitor the chart for any invalidations of the descending channel breakout.
Potential Risks:
False breakout: Be cautious of a possible fake breakout where the price might briefly cross above resistance but then fall back into the channel.
Market Sentiment:
Cryptocurrency markets can be volatile, and any broader market movements (such as Bitcoin price changes) could impact this analysis.
Conclusion:
The GOATSEUS MAXIMUS (GOATUSDT) price is positioned at a potential breakout zone, with several indicators showing early signs of a reversal. A well-structured trading plan that includes careful risk management and flexible profit targets is essential to maximize the potential of this trade. Always consider broader market conditions and adjust the plan accordingly.
Can Goatseus Maximus Sustain Its Rally After Major Listing?Solana meme coin Goatseus Maximus ( MIL:GOAT ) made headlines with an explosive 150% surge in price following the announcement of its listing on Crypto.com, a leading global cryptocurrency exchange. As the hype builds around this meme coin, traders and market watchers are speculating whether this rally can sustain itself in the days ahead or if this surge is just a temporary spike.
Key Factors Behind the Surge
The surge in MIL:GOAT 's price comes as Crypto.com officially confirmed its plans to list the Solana-based meme coin, unlocking a wave of liquidity from its broad user base. The listing allows users to trade MIL:GOAT against major fiat currencies like USD, EUR, and over 20 others, amplifying its exposure and accessibility. This triggered a frenzy of buying, pushing the price up by a whopping 150%.
Adding fuel to the fire, reports surfaced of an investor turning a mere $727 into an eye-watering $2.42 million profit in just four days. Stories like this are drawing more retail investors to the token, attracted by its volatility and profit potential.
However, despite the positive momentum, prominent venture capitalist Marc Andreessen, founder of Andreessen Horowitz, clarified on X that he has no involvement with the token. This dispelled some rumors swirling around the venture firm’s possible connection to MIL:GOAT , but the meme coin's hype remains largely unaffected.
Technical Analysis: Can GOAT Continue Its Bullish Momentum?
At the time of writing, MIL:GOAT is trading at $0.2634 after hitting an intraday high of $0.33. While the token retraced slightly for a cool-off, the overall sentiment remains bullish, supported by a surge in trading volume of 170%. This shows that traders are still engaged, and interest in the token has not waned.
The Relative Strength Index (RSI) sits at 47, signaling a period of consolidation after the explosive price action. While the RSI is slightly weak, it does suggest that MIL:GOAT has room to push higher without being overbought. This cool-off phase could pave the way for another leg up if bulls regain momentum.
On the technical front, MIL:GOAT has strong support at $0.10, with resistance likely forming at $0.33 based on its previous high. A break above this level could open the door to further gains, particularly if buying pressure continues to build on the back of increased liquidity from the Crypto.com listing.
What’s Next for MIL:GOAT ?
MIL:GOAT ’s rally largely revolve around its meme coin status and listing on a major exchange, giving it the liquidity and attention it needs to flourish. Meme coins often rely on community-driven hype, and with stories of massive profits, MIL:GOAT could remain in the spotlight for some time.
However, as with many meme coins, volatility is a double-edged sword. The token's future performance hinges on sustained trader interest and whether it can attract enough long-term holders to stabilize its price. Whale activity and larger market conditions will also play key roles in shaping the token's trajectory.
Conclusion: Can GOAT Maintain Its Momentum?
In conclusion, Goatseus Maximus ( MIL:GOAT ) has shown tremendous upside potential, with a 150% surge following its Crypto.com listing. The technical indicators suggest a period of consolidation, but with the right market conditions, MIL:GOAT could see another breakout, particularly if it surpasses its resistance at $0.33.
While meme coins can be unpredictable, MIL:GOAT ’s rise in both price and attention makes it one to watch in the near future. Investors will need to stay tuned to see if this rally has legs or if it will fade just as quickly as it started.
As always, trading meme coins involves high risk, so investors should proceed with caution while keeping an eye on market developments.

GOATSEUS MAXIMUS IS MEMECOIN OF THE YEAR! TRADE PLAN + ANALYSIS 🚀 THE MEMECOIN OF THE YEAR! 🚀
GOATSEUS MAXIMUS is set to dominate the upcoming bull run with its bullish technical pattern and growing hype! It’s positioned to be the No. 1 MEME COIN with the highest potential for insane gains! 🌕 Falling wedge breakout imminent, and with the strong social backing of this community-driven project, we're looking at the next potential 100x gem.
With massive social engagement, an active community, and favorable technicals, this is THE MEMECOIN to keep on your radar for exponential growth!
Chart Overview:
Current Price: $0.11310 (as shown in the image)
Volume: 53.78K, indicating a moderate trading activity.
Formation: A Falling Wedge pattern is clearly visible, which is a bullish reversal signal. A falling wedge typically indicates a strong potential for a breakout to the upside as the price consolidates within narrowing bounds.
Indicators:
VMC Cipher B: Showing divergence signals, and while the indicator line has been in negative territory, we can see signs of momentum gradually shifting back into positive.
Blue Wave suggests weakening bearish momentum, and with this setup, an upside breakout seems likely.
RSI (Relative Strength Index): RSI is at 52.23, which is neutral. This implies there is room for further price movement without entering overbought territory, aligning with the possibility of a breakout.
Stochastic RSI: At 10.85 (oversold levels), suggesting strong upside potential. When both the RSI and Stochastic RSI are in neutral and oversold conditions respectively, this typically signals an imminent rally.
HMA (Hull Moving Average): The histogram shows the start of positive momentum, which indicates a potential shift in trend to the upside.
Key Technical Levels:
Resistance Levels:
Immediate resistance at $0.11485, the recent high.
Secondary resistance at $0.125 and $0.150 in the event of a strong breakout.
Support Levels:
Immediate support at $0.10557, the most recent low.
Stronger support at $0.10000.
Trading Plan
Entry:
Look to enter a long position at the breakout from the falling wedge pattern. Confirmation of the breakout should be around $0.1150–$0.1160.
For a more conservative entry, wait for the price to break and close above the $0.1250 resistance level with confirmation from volume.
Stop-Loss:
Set a stop-loss below the wedge's support line, ideally around $0.1050. This gives room for natural volatility but avoids significant downside risk.
P rofit Targets:
Target 1: $0.1500 (short-term resistance).
Target 2: $0.2000 (medium-term target, given the potential for a strong rally as indicated by the technical setup).
Target 3: $0.2500 or higher for long-term holders, as the meme coin hype continues to drive potential exponential gains.

Goatseus Maximus is meme NO.1 for this bull run! TA+TRADE PLAN🚀🚀🚀 MEMECOIN No.1 FOR THIS BULLRUN 🚀🚀🚀
Goatseus Maximus is primed to be the KING OF MEME COINS this season! With a powerful symmetrical triangle pattern, an incoming breakout, and massive hype potential, GOATSEUS MAXIMUS is set to dominate the market. This coin isn’t just riding the meme wave—it’s about to surf it to HUGE GAINS! 🌊💎
Get ready for the next big thing in crypto. With strong technicals, an upcoming bullish breakout, and a dedicated community, GOATSEUS MAXIMUS is about to hit the moon! Don’t miss the ride of a lifetime! 🌕✨
Goatseus Maximus is forming a symmetrical triangle pattern during an overall uptrend, a continuation pattern that often precedes a breakout in the direction of the prevailing trend. In this case, given the prior upward momentum, the odds are in favor of a bullish breakout.
Key Technical Insights:
Symmetrical Triangle: The price has been consolidating within the triangle, making higher lows and lower highs. This signals market indecision, but as the triangle narrows, an imminent breakout is expected.
Volume Spike: The volume shows a notable increase (175.9K), a positive signal that a strong move may follow soon, potentially confirming the breakout direction.
Indicators:
RSI (Relative Strength Index): At 54.21, the RSI suggests the coin is in a neutral zone, with more room for an upside move before hitting overbought territory.
Stochastic Oscillator: Sitting at 57.79, it shows momentum is gradually turning positive, which aligns with a potential breakout to the upside.
Support and Resistance Zones:
Support: The orange zone between $0.08 - $0.10 acts as a solid support area where buyers could step in.
Resistance: The current resistance levels are projected near $0.16 and $0.20. A breakout from the triangle could push the price toward these levels.
Trading Plan:
Entry Strategy:
Enter long on a confirmed breakout above the upper trendline of the triangle (above $0.14 - $0.15). Ensure that volume supports the breakout to avoid a false move.
Consider setting a pending buy order slightly above the triangle resistance line at $0.1505 to catch the breakout early.
Stop Loss:
Place a stop loss just below the lower trendline of the triangle (around $0.105) to protect against invalidation of the pattern.
Alternatively, if the price breaks below the support zone near $0.08, consider exiting, as this would signal bearish momentum.
Profit Targets:
First Target: $0.18, aligning with the next significant resistance zone.
Second Target: $0.24, based on the measured move from the base of the triangle, offering a strong risk-to-reward ratio.
Risk Management:
Ensure that the position size adheres to a 2-3% risk of your total portfolio.
Monitor volume and price action closely for any signs of reversal after a breakout.

I'm Bearish on BitcoinThis is what i'm anticipating.This will be the last public Bitcoin price prediction of mine. Pipsologics ENIGMA will guide you in upcoming years. Thank you so much !

Pre-analysis 1/17/2023Hello, It's nice to see you all again. I hope you are progressing in your journey ALWAYS.
Risk Disclaimer. Trading foreign exchange on margin carries a high level of risk, and is not suitable for all investors. Past performance is not indicative of future results. The high degree of leverage is dangerous and can work against you as well as for you. Before deciding to invest in foreign exchange or any market you should carefully consider your investment goals, level of experience, and risk tolerance.

NAS100 [US100] Daily Outlook | July 08Here is what am looking at today. Have in mind that NFP new release is today so be wise with your risk management.
See you all during live streaming/trading session at 8:45AM EST/ 4:45 PM GST.
Kings.
Update: AM LIVE- Join me now!

ULTIMATE MOON | FuelCell Breakout??HUGE PLAY COMING. Massive, massive downtrend over the previous years. I will be entering the breakout with several options calling high strikes.... Meaning if we breakout past $3, bulls will engage and we moon.
Easy Loot | DotcomJack
Always do your own research before investing, this isn't a game.
Redfin signal below had a similar play.


i post way too many h&s... but looks pretty clean using rangesObserving price action in ranges seems to reduce asymmetry in this monster snapback we have experienced. Maybe a compelling argument for the next leg up. The outer KC converging onto pre-crash ATHs could help accelerate the melt-up; however, I would be looking to moderately sell into further strength, especially with an election coming up we will likely be coming back into the KC zones soon. That being said, it is impossible how long to tell the record-breaking buying, and rapid asset price appreciation will persist, and it seems like 4000-4500 will be in play before we see anything close to 3000.

005. Piggish Play - Long AMZN to 2750+NASDAQ:AMZN
AMZN's last earnings report is nothing short of unbelievable, in my opinion.
How does the world's greatest growth-turned-cash-cow crank out revenue numbers like 40%? The answer is partially the virus, but more importantly, AWS is exploding. I'm not going to sell you on Amazon because it's Amazon (the potential GOAT of stocks). What I am suggesting is that the company is now a growth-turned-cash cow-turned-growth cow.
I've never actually seen a Growth Cow before and I'm pretty familiar with all the financial animals. If you agree that AMZN is the GOAT as well, that would make it a growth-cow-goat. To make things simpler, the price is likely to go higher in a short period of time.
Technically speaking, Waves I. and II. are wholeheartedly locked in, so Wave III. should yield incredible results. Further technicals suggest that the RSI is ripe for an entry with solid support levels to boot.
Fundamentally speaking, Amazon is becoming something entirely new and analysts other than myself are recognizing it. Many agree that 3,000 is fair value, while the new consensus is around 2800. Both numbers would be just fine if they were to come into view this month.
The details of the trade can be found in the chart and I would suggest entering now-ish.
-Perma Pig-san

GA pretty simple, after stimulus hit fib level to return back the downside eventually hitting trend line on said chart. hr chart. put sl just above next fib level.


GOLD UPDATE TRADE IDEA: Gold is looking great, playing out perfectly to my analysis from last week.
We saw a retest at the blue line *618 fib level* and now it’s continuing down to the low of the green line!

Median projection FUTURE local median reversal, HomelyA more comforting homely forecast for btc / usd, while goats where sleeping..
If..yet to be seen "price reversal" from the current median line hits 13300,
the higher probability for a legendary 20k+ pump during 2020 run up / new year / jan week 1 & 2, lures.
btc still has route to follow, see projected wave top / frothy head.
As local sentiment is now uncertain leaning bearish, will this move pass baa by..
Get ready..
the next 72hrs will draw some baa conclusions..
Duke
Goatclub.io

Progressions of the Median Progressions of the Median
Biff Bam Boom , 3 times the goat..
What comes next ?
3k by October , 900 by 2020.. or other..
can we make a better future outcome , something more comforting and homely . hmmm

BTC USD Median line Back TestingWithin 80% the second high hits the median square on the nose.
ba baa ba baa
Now to predict the next big move..
Duke
goatclub.io

Hypothetical Projection Using Kazonomics' Lucky13 GoldFractalI've been analyzing @Kazonomics' #Lucky13 #GoldFractal for $BTCUSD & here's what I came up with since revisiting it yesterday.
It could be crunched or stretched, but I lack the accuracy of the #GOAT. Not sure what timeframe to use, but like he always says, #TimingMatters
#BTFD


USDJPY 28//11/2018This pattern is still in the process of forming. Possible bearish price movement towards the support 112.6630 within the next 2 days.
