Silver for Gold! – Correlation, Leading, GOLDSILVER Index
- In the first chart (above), we can see the GOLDSILVER index. This index shows us how many ounces of silver one ounce of gold is worth. In other words, it represents the price of gold in terms of silver.
- In the second chart (bottom left), we see the volatile child, silver's chart.
- And in the third chart (bottom right), we have the chart for shining gold.
Both gold and silver charts are D1 charts. The dates marked in red and green on them represent the days when the daily closing prices of these two precious metals were different. Green lines indicate days when silver closed higher, while red lines indicate days when it closed lower.
When we carefully examine the chart, especially the marked dates, we can observe that whenever silver has a different daily closing compared to gold, the next day, gold tends to mimic silver's previous move. Every day when silver closes green and gold closes red, gold follows suit the next day by closing green.
Silver serves as a crucial and highly consistent leading indicator for gold prices. The reason for this is quite simple!
As we all know, gold and silver prices have historically maintained a proportional and correlated relationship. However, gold is rarer and is in much higher demand by both individuals and governments compared to silver. This results in a significantly larger trading volume for gold. As we also know, for a financial product's price direction to be determined, there needs to be a consensus among people regarding buying or selling. The more people, including central banks holding gold reserves, are involved, the harder it becomes to reach a consensus. In the case of silver, the trading volume is much lower compared to gold, which means there are fewer individuals needed to determine its value. Therefore, price consensus for silver is established somewhat faster compared to gold. Gold usually accepts this consensus, especially after silver.
In summary, before making any buying or selling decisions regarding gold, taking a quick look at a silver chart can be very beneficial for you. Of course, this is not a standalone pricing method, but it is highly reliable. It not only helps in making buying or selling decisions but also serves as an excellent exit indicator when deciding to continue or close an existing position.
Now, let's talk about the GOLDSILVER index that I placed in the first position…
This index is truly fantastic for increasing our profitability. While gold and silver prices often move in correlation, their profit or loss rates are not always the same. When both precious metals rise simultaneously, one of them often rises or falls more than the other.
There are many macro and microeconomic reasons for these differences. For example, changes in central banks' demands for gold, periods of increased marriage rates in countries like India, and so on.
You might find the marriage seasonality in India interesting, so let me briefly explain... In countries like India and Turkey, it's a widespread tradition for couples to exchange gold during weddings, and in some countries, it's almost like a law. Countries with populations like India's 1.4 billion or Turkey's nearly 100 million can influence gold demand, albeit to a small extent, due to these traditions.
Returning to our main topic… Due to differences in demand and supply, the rates of increase or decrease in gold and silver prices generally vary.
With the GOLDSILVER index, even using very basic technical analysis methods, it's often possible to predict which one will rise or fall more compared to the other. And since our goal is to maximize our profits, if we have a direction in mind for these two precious metals, it makes sense to bet more on the one that the GOLDSILVER pair indicates will rise or fall more. If the GOLDSILVER pair suggests that silver could rise more than gold, then it might be more profitable to bet on silver instead of gold, or vice versa.
To summarize everything:
Before opening a position in gold, it's a good idea to quickly check the silver trend or leading technical indicators on the H4 or D1 chart.
If you have a bullish or bearish view on silver or gold, considering the GOLDSILVER index when deciding which precious metal to focus on can be an important additional indicator to increase your profits.
GOLD-SILVER

Natural Gas DXY GOLD SILVER Price ForecastWelcome to the everyday how to make money online trading with Natural Gas Technical Analysis show, where I give you guys support & resistance levels to potentially play off of. As well as both sides perspective of a bear and a bull to give us a better understanding of where our trades are currently and not have a bias

Natural Gas Price Forecast | Bull Flag 2.0 formingWelcome to the everyday how to make money online trading with Natural Gas Technical Analysis show, where I give you guys support & resistance levels to potentially play off of. As well as both sides perspective of a bear and a bull to give us a better understanding of where our trades are currently and not have a bias
- Natural Gas Natgas Stock in confirmed daily uptrend
- Next level for natural gas resistance is 2.86

The Evolution Of Money: From Barter-System To Cryptocurrency!Hello,
Welcome to this analysis about The Evolution Of Money. Till today money had a protracted history reaching back to times where there even did not exist electricity or industry like we now it these days. Since these beginnings money constantly reshaped and emerged new forms of money that theoretically can be applied still today however it is also a fact that it is important in which form the money circulates bringing innovation and prosperity to the civilization as there are money forms although logical from its form however contra-productive for the further developments.
__
The Barter System (High Phase 98000 BC - 900 BC):
It is clear that in times where people did not have the ability to keep a sufficient store-of-value they had to adapt to circumstances and exchange what they had in order to receive things they need for everyday living, this form of money is called the "Barter-System". This system principally defines the exchange of goods and services against other goods and services. It was a typical hunter-gatherer-form of exchange between the individual occupations. For example, a fisherman had a lot of fish however no grain to exchange for and on the other side there was a farmer which had a lot of grain, however, no fish to eat, so these two come to an agreement to exchange the fish against the grain in order to fulfill both sides needs.
This system had a lot of substantial problems as it was not possible to store any value with the goods and services, besides it only functioned when the other side also searched for the offered product therefore there needed to be a double coincidence of wants otherwise an exchange was not fulfilled by both sides agreements. Besides that there was the issue with the indivisibility of goods, for example, one had one goat and needed one pot therefore it was only possible to exchange one goat against 10 pots and now the goat holder was stuck because he could not share the goat into 10 pieces to received his one pot as needed. Overall it was a complicated exchange system that definitely could have been improved.
Commodity Money (High Phase 6000 BC - 500 AD):
Since it was not possible to store values with the Barter-System as there were also many goods that fouled by the times this could also be improved by the right commodities that do not foul. In ancient Rome, the Romans moved on to keep salt as a store of value and exchange for goods and services. Salt is easily divisible, it can be stored for a long period of time and it was expensive and labor-intensive to produce therefore limited in quality, besides that it was widely consumed by everybody. Additionally to salt, many other forms of this commodity money emerged such as Cattle, Tobacco, Rice, Sugar, or Tea. All commodities which can be stored over a long period and exchange properly.
Together with these new gained advancements, it was a step in the right direction nevertheless there remained significant negative aspects in the commodity money these are various things such as some forms of cattle are very difficult to store because they need to be fed constantly and can not obtain a passive store, other forms like cowry shells are fragile and need to be transported carefully. Besides these storing problems, it was always difficult to transport over long routes as the commodities can take up so much room that it was simply so unpracticable to transport them over long distances. Also, there existed not universal acceptability so the two exchange partners needed to agree on the exchange of these commodities to come up with a deal.
Metal Money (600 BC till today)
Metal money was a true revolution in the money evolution and the story speaks for itself as it is still today widely accepted and a sufficient store of value with gold and silver holding its values. Against the commodity money, it was stable and had an inherent value as it is rare in nature as well as its supply is limited, the perfect characteristics for a natural store of value and also exchange value. As metals were already used for armors and tools and had already the value within these products this kept advancing with the first coins to be pressed in ancient Greece 600 BC after which the metallic money kept advancing into more sophisticated forms such as the IOUs and also tender coinage bringing a practicable way to pay for goods and services.
The Metallic Money shaped into different forms like the IOUs where Goldsmiths backed the gold and gave people a trust which they can exchange in order to receive goods and services, so the people came to the goldsmith and bought basically gold for which they received the document to pay with. The only problem with this system was that the Goldsmiths created fake IOUs and kept spending them. Besides this form, there was the legal coinage in Rome for example with gold coins issued by the empire however the problem, in this case, was that it got debased over time as the people mixed more cheap metal like copper with the gold coins to get a higher supply, today it wont function so easily as it can be proved nevertheless in this time it marked a serious issue.
Paper Money (1690 till today):
The emerging paper money in fact marked a true change in the whole money system as now it was not possible to issue by everybody, now it was issued by a central authority whereas these authorities firstly existed private also the mission came more and more into central bank area. The first printed money was created in 1690 in the form of a bill of credit to serve as a promissory note by the government on its own credit, these bill of credits were unsecured paper money and at this time in the 17th to 18th century, it was still possible to have private money with private companies creating own bills with the individual exchange qualities to get into the circulation.
Till today many currencies have established holding the money as it is issued by certain central banks such as the US-Dollar by the Federal-Reserve-System or the EURO by the European-Central-Bank. The problem here is that this money is printed by will and the central banks have the ability to just print more when the time is needed to do so like it was seen in the corona crisis where the money sum moved exponentially to new heights. Although Paper Money is still omnipresent and used as a store of value as well as exchange value to there are important faults that need to be improved to keep a healthy economic balance and obtain continued stable money.
Plastic Money (1946 till today):
In the 20Th Century, the printed central bank money moved now into the account money especially backed by the payment providers in the individual credit or debit cards. The first bank-issued cards originated in 1946 as a Brooklyn banker created the charge-it card, these were forwarded to the bank account and then the service or good was released. In post-war times further cards followed and till now there established credit-card providers which issue credit or debit cards also with giving their own credits to people that can be paid back.
Cryptocurrency (2008 till today):
This is the very last money form and the most innovative so far, like Bitcoins, like they invented, are limited in supply and can only be created through the mining process and proof of work they provide a sustainable interface within the blockchain which transactions are scalable and easy to use for peer-to-peer-transactions. It is not a wonder that the cryptocurrency market since the beginnings expanded more and more and several other projects emerged, there are still many projects given however the market will likely sort the not innovative ones out. Cryptocurrency marks the point in the history of money evolution where money advanced significantly from its initial barter exchange system to cryptocurrency. This is a major step and as for now, central banks are looking also into cryptocurrency and blockchain technology to implement their own central-bank-digital-currencies. There are really not many contra-aspects like in the previously stated money forms as cryptocurrency improved all the issues that previously came up and also innovated increasingly above these.
__
In this manner, this was my analysis about the evolution of money which is important as the money keeps on shaping as we see it especially in these times with cryptocurrency, it is also not unlikely that these technologies will improve further, and there comes something new that is more applicable and innovative however till now cryptocurrency serves as the highest quality money forms when comparing to the other money forms. Especially it is the case that all money forms still coexist today however mainly not applicable.
__
In this manner, thank you everybody for watching, support the idea with a like and follow or comment, have a good day, and all the best to you!
Information provided is only educational and should not be used to take action in the markets.
__

USD vs Foreign Currency Sets Up Black Swan/Credit Event 2028-29USD vs Foreign Currency Sets Up Black Swan/Credit Event – Pay Attention
This video will show why the US stock market continues to rally and the US Dollar continues to strengthen. It is all related to what is happening in China/Asia and much of the world.
The cheap US interest rates over the past 4+ years have allowed foreign borrowers to take advantage of localized demand for capital and the “Dollar Carry Trade.” When you can borrow USD for 2.5%, convert the USD capital into localized currencies, and use that capital to earn 20% or more – it’s easy to borrow as much as you can to make the extra 18% - right?
As long as there is no disruption in currency valuation levels and/or economic activities, it seems like a simple process for profits.
But when localized currencies collapse against the US Dollar, this sets up a very dangerous waterfall event. Now, the profitable USD carry trade is upside down from the start. It takes 25~35% more localized currency to repay the USD debt.
Additionally, consider that the performance of these borrowed funds may also be upside down related to profits. If the localized economy collapses and consumers are not buying, now you have additional downside pressure related to economic performance.
This is why the rush into USD-based assets and equities continues. The rally we see in the US indexes/stocks is almost “in the face” of the US Fed raising interest rates while trying to weaken inflation. It is almost as if the US Fed has acted in a predatory manner by raising interest rates – yet failed to understand the dynamics of the global markets.
The result will be a Black Swan type of credit event. Buckle up and prepare for it.
Follow my research and prepare for the biggest opportunity of your lifetime.

Strifor || USDJPY-09/14/2023Preferred direction: Neutral
Comment: The Japanese yen is starting to gradually move into the top topics against the backdrop of recent statements from the Bank of Japan, a change in the head of the central bank, and, in general, a likely change in policy from soft to more hawkish. The fall may very well be approximately from the current levels, but most likely it is better to wait for a false breakout of the level of 147.816 (this is option No. 1), and after that go short. Also, option No. 2 is not excluded, in which the price will reach the level of 150.
Thank you for like and share your views!

Strifor || XAUUSD-09/11/2023Preferred direction: SELL
Comment: Despite the fact that the level of 1920 has not yet been passed, the priority of sales and the previous targets for selling remain. Since the level of 1912 is ahead, a deep downward impulse is not expected, but it is not excluded. There is a possibility that with a strong downward impulse, the 1912 level will later play the role of resistance, from which sellers will move further down, or simply keep the price below the level for some time.
Thank you for like and share your views!

Strifor || AUDUSD-09/11/2023Preferred direction: SELL
Comment: The Australian surprisingly shows potential buying priority, however, the medium-term outlook is still on the side of sellers, and it is better to stick to it. There is potential for growth to the upper limit of the current balance at the level of 0.65141. During this month, a decline to 0.63500 and below is expected.
Thank you for like and share your views!

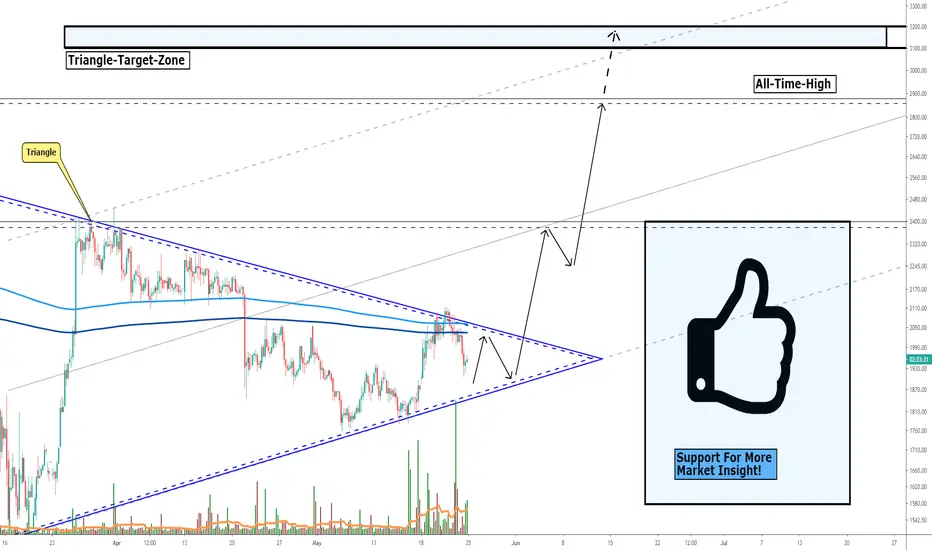
PALLADIUM, Trading Near A-T-H, Targets Ahead When Confirmed! Hello Traders Investors And Community, welcome to this analysis where we are going to look at palladium, its price-action, and what we can expect from the future hours and days. It is one of the important metals and therefore a demanded exchange good in today's global economy. In my observations, I found some important and significant signs which will affect the price further and determine its outcome, therefore we are looking on the locally 4-hour timeframe.
As you can see in my chart palladium currently trades in a huge triangle which you can see marked in blue in my chart in which we have good bullish volatility and support at the moment which indicates a highly possible breakout to the upside as you can see the arrows marked in my chart. At the moment the bullish scenario is more likely because we have strong support in the range and has some good bullish volume but also we are still trading in a big correction that isn't completed yet.
After the triangle has confirmed properly we can expect palladium to test its higher levels, firstly it will be the middle line of the channel as you can see it in my chart when the price and trend stay stable in this region we can expect palladium to move higher at least testing the higher boundary of the uptrend channel and the all-time-high, as you can see the all-time-high is just slightly below the overall triangle target when this target is finally reached it can provide a new all-time-high which will be extremely bullish and can catapult palladium to next highs.
Remember that this scenario has to be confirmed properly, first we have to break the upper boundary with good volatility and close above the 600 and 800-EMA which you can see marked in my chart in light and dark blue. To wait on the right confirmation is the best option wise traders can do in today's market environment, otherwise, trading half-cooked and speculative setups can lead to unsatisfying results therefore it is important to always look and trade the best possible setups which today's market environment can provide to us.
Thanks to everybody for watching, support for more market insight, and all the best!
The ambition to transform opportunity into gold remains the most significant tool for a trader.
In this manner: FAREWELL
Information provided is only educational and should not be used to take action in the markets.
GOLDSILVER RATIO, Moving In Downtrend-Channel, More To Come! Hello, Traders Investors And Community, welcome to this analysis about the gold-silver ratio, its current price-action, and what we can expect the next time. In my observation, I found some significantly sings in the chart which will affect the ratio fundamentally farther the next days and weeks. The goldsilver ratio is an important ratio to track the number of silver ounces compared to one ounce gold, therefore, it is providing important information about the value between silver and gold. I made already the analysis of gold and silver, if you didn't saw these already I recommend to you that you go to my account and have looked to have a full-depth-overview of the analysis in the gold-silver ratio and its interrelation to gold and silver.
When looking at my chart you can see that the ratio is trading in a huge and fundamental downtrend-channel which you see marked in blue. We already touched the channel lower and upper boundary several times to form the overall downtrend-related channel. At the moment the ratio fell down from an important support-point at the 109 level, you can see this big red candle to the downside with high volatility it is suggesting that the ratio is turning to the downside here and that we will continue in the downtrend-channel until important support has reached.
The next time we can expect a bounce back to the 109 support/resistance level where the likelihood increases that the downtrend continues when the huge heavy bearish-confluence-cluster zone you can see in my chart is confirmed. We have several resistances there which building the logical resistance-level, first it is the 50-EMA which you see marked in blue, second, it is the 109 support/resistance level and third, it is the upper boundary of the falling downtrend-channel, therefore, I don't expect a breakout of the channel here so far and the rise to the downside will continue.
In this situation it has to keep in mind that the worth fullness of silver compared to gold rises, this is insightful because at the moment we see more volatility to the upside and sharp rises in silver than in gold, it also means that the value of silver can increase higher and gold gets cheaper compared to silver which is an indication for the bullishness I mentioned already in the silver-analysis. Investors and traders can take advantage of it when the ratio drops more to buy silver instead of gold or to exchange the gold for silver for a later exchange back when the ratio increases again. This should be a good opportunity to make a profit out of the situation with gold and silver.
Alright, this should give you a good overview, thanks to everybody for watching, support for more market insight, and all the best!
The ambition to transform opportunity into gold remains the most significant tool for a trader.
In this manner: FAREWELL
Information provided is only educational and should not be used to take action in the markets.

Strifor || USDCHF-09/08/2023Preferred direction: BUY
Comment: The extreme ideas for the franc gave were the most effective, we considered buy-deals. Now the story is the same, and the power of the buyer is still great. At the moment, we expect growth to 0.9000
Thank you for like and share your views!

Strifor || XAUUSD-09/06/2023Preferred direction: SELL
Comment: Gold a week ago perfectly worked out our BUY-idea, but already this week everything is forming in favour of the seller. This trend is likely to continue in the near future. The level of 1920 has been passed, fixing under it is expected. This is a potential area to consider short trades. The nearest target is, of course, 1912, then, after a probable accumulation, the price will drop to the level of 1900 again.
Thank you for like and share your views!

GBPAUD Long Setup: Bullish Divergence & Falling WedgeHi Fellow Traders,
The GBPAUD pair has recently seen an impressive rebound after touching the EMA200 line, indicating a continued bullish trend. Simultaneously, prices have formed a falling wedge pattern, which was later followed by an impulsive breakout from this pattern. Additionally, the MACD Indicator has displayed a bullish divergence.
In simpler terms, this breakout and the presence of a Bullish Divergence suggest the potential for an upcoming upward movement, with our initial target being area 1. After reaching target 1, we might expect a temporary pullback to the blue zone before resuming its upward journey towards the second target.
In essence, GBPAUD is showing signs of a promising uptrend, making it an interesting opportunity for traders."
It is essential to note that the analysis will no longer hold validity once the target/support area is reached.
Please support the channel by engaging with the content, using the rocket button, and sharing your opinions in the comments below!
Disclaimer:
"Please note that this analysis is solely for educational purposes and should not be considered as a recommendation to take a long or short position on FX:GBPAUD ."

$DXY plows higherTVC:DXY still going strong!
It's highly likely that the retests the recent highs.
We history in the making!
This is the 1st time the US #DOLLAR didn't break down @ major support! It has not withstood a monthly close after peaking.
Does it have enough steam to retest the 2022 highs?
#interestrates #GOLD #SILVER #BTC

gold 8 hours buy/hold dips TP bulls 1977 usd🔸Hello traders, today let's review the 8 hour chart for gold. Expecting more gains in this
market, strong V-shape recovery in progress after we hit the cycle low near 1890 USD.
🔸V-shape recovery projected high set at 1975/1978 USD, which is heavy overhead S/R,
bulls will target re-test of the key S/R going into FED in September, this is a bullish impulse
in progress until FED meeting late September.
🔸Recommended strategy bulls: seek to buy/hold dips or market buy, final TP bulls set at
1976/1978 usd, expecting solid gains in gold going into FED meeting later in September.
good luck traders, this is a swing trade setup, patience required.
🎁Please hit the like button and
🎁Leave a comment to support our team!
RISK DISCLAIMER:
Trading Futures , Forex, CFDs and Stocks involves a risk of loss.
Please consider carefully if such trading is appropriate for you.
Past performance is not indicative of future results.
Always limit your leverage and use tight stop loss.

Gold defies bond sell-off once againNominal 10-year Treasury yields have risen to the highest level since 2007. Just when we though the bond sell-off of 2022 was behind us, it came back with a vengeance. Hawkish Federal Open Market Committee (Fed) minutes and a string of positive economic data from the US are casting doubts whether we have reached peak interest rates in the US. The Fed certainly has left the door open for further hikes and its decisions will be very data sensitive.
Relative to the bond market, gold is holding up well at USD1916/oz (on 23 August 2023). While gold prices temporarily fell below the psychologically important US$1900/oz level, Treasury Inflation-Protected Securities (TIPS) prices had fallen much further and other-things-being-equal, the bond market would indicate gold should be trading closer to $1830/oz. Gold’s resilience in the past month mirrors its defiance again the bond headwinds of 2022.
Gold has been facing US Dollar headwinds as well in the past month. The Dollar Basket (DXY) has appreciated 2.1% in the past month (to 22 August 2023). With a more hawkish Fed, there is a greater risk of further dollar appreciation.
Central banks bought a net 55 tonnes of gold in June following three straight months of selling. The Central Bank of Türkiye's (CBRT) return to net buying in June helped reverse a temporary trend. Having been a significant net seller between March and May to meet local demand, it swung back to net buying in June, adding 11 tonnes to its official reserves.
Of all the precious metals, silver fell the most in the past month (-6.1%). Net speculative positioning fell 88% to a level one standard deviation below its 5-year average. However, we suspect that excessive shorts were being covered in the past week. Since hitting an intra-day local low of US$22.35/oz at 13.30 on 15/08/2023 silver prices have bounced up to US$24.14/oz at 15.00 on 23/08/2023 (+8.0%). That low point seems to match the Fibonacci-implied support levels looking at year-to-date silver performance (the 38.2% retracement).
Silver inventory in London Bullion Market Association (LBMA) vaults, which fell precipitously in 2022 (-28%), has stabilised and gained 3% year to July 2023. Silver holding in exchange traded commodities (ETCs) have only modestly declined in 2023 so far (4%) after a 15% decline in 2022.
The last week’s bounce in silver price takes the gold-to-silver ratio back down to 81 (22/08/2023), from 84 (08/08/2023), fractionally higher than 80, where we were a month ago (21/07/2023). Net speculative positioning in silver fell 88%, one standard deviation below its 5-year average according to Commodity Futures Trading Commission (August 15, 2018 to August 15, 2023)
Platinum and palladium also followed silver higher in the past week, but monthly prints have come in lower. Auto sales have largely been improving in the past year, with sales up 18% y-o-y in Europe (June) and US (July). However, China sales fell 1% y-o-y in July. Autos are the main source of demand for platinum group metals.
This material is prepared by WisdomTree and its affiliates and is not intended to be relied upon as a forecast, research or investment advice, and is not a recommendation, offer or solicitation to buy or sell any securities or to adopt any investment strategy. The opinions expressed are as of the date of production and may change as subsequent conditions vary. The information and opinions contained in this material are derived from proprietary and non-proprietary sources. As such, no warranty of accuracy or reliability is given and no responsibility arising in any other way for errors and omissions (including responsibility to any person by reason of negligence) is accepted by WisdomTree, nor any affiliate, nor any of their officers, employees or agents. Reliance upon information in this material is at the sole discretion of the reader. Past performance is not a reliable indicator of future performance.

Copper - Did Social Media Tell You To Long The CCP Again?They call copper "Doctor Copper" because it's said to forecast the overall world economic conditions on account of being tightly wed to manufacturing.
Well, what people are really yammering about with that over the last 20 years is whether or not the Chinese Communist Party is healthy, and the world by proxy being healthy because it tied itself to the most heinous regime in history, the one responsible for the 24-year persecution of Falun Gong by former Chairman Jiang Zemin and the accompanying organ harvesting and genocide.
Unfortunately for all the blind bulls, the early 2021-2022 price action was a pretty good indication of a top, and that top is really confirmed by the fact that since October of '22, this bounce has been pretty weak, and starting this month, with all the drama surrounding the slow collapse of the Chinese economy, took out the previous two months' lows.
Monthly shows you that August price action took both the July and June lows.
Like, that's not the kind of "signal" you want to see to get long for a new all time high.
When something is retracing to take out major highs, you want to see lows rarely violated with something of a freight train towards the old highs.
Weekly bars show us something of a subtle pattern where it looks like it's just taken some lows and is consolidating and continually flirting with going back up.
But in reality the market makers are, most likely, just selling more under the previous $4.00 area.
And if that's really true, it means another gap down is imminent, especially after an entire quarter of ranging.
If you ask me, the first area that you can look for a long that is more than a scalp on copper is under $2.8, which is a critical pivot from September.
And a more likely target in the next 12 months is the $2.00 mark, which was barely swept out in the COVID drama.
The reality is, my friends, the Chinese Communist Party is going to fall overnight in our lifetimes. Not five or ten years from now. But very shortly, and everything is going to change.
Whether that is caused by Xi Jinping throwing away the CCP to protect himself and China from being taken over by the International Rules Based Order as it uses Taiwan as a soft proxy war, or because the whole world collapses under the results of the persecution of Falun Dafa, since everyone's been going to Shanghai to worship the toads and the Devil Red to get financial benefits.
This is the danger.
The danger is imminent.
But copper trades painfully slowly, so if you want to do this you have to have long duration, ignore the noise, and be willing to suffer some drawdown.
China under the CCP is never going to recover. Things are never going to be okay ever again.
Things will be okay once mankind returns to tradition.
But there won't be an international stock market like this anymore that day.

US Dollar Index Could Be Topping HereSee the three touches on the upper trend line. If this line holds, the DX price could move down to the 98 area. Also the RSI (10) is overbought.
Such a chart could be used to short the DX, or to go long the EUR/USD and the precious metals such as gold, silver, platinum.
If I were to trade the DX short, I would place an extra big stop loss, maybe at 103.90 or at 104 (maybe even higher) in case of some stop hunting/a shake out before a big move down. Then would carefully add on to a profitable position. Same for going long the other choices: use a big stop loss.
(A strong close above the upper trend line would not be good for this trade; a peek-a-boo move that does not actually close above the trend line means the trade is still viable. Also, a daily close below the 103 area would help confirm this trade idea.)
Good luck!

Strifor || XAUUSD-08/25/2023Preferred direction: BUY
Comment: As we expected, the metal rolled back exactly to 1912 and the correction stopped. The current consolidation above this level most likely indicates the forthcoming further strengthening of the buyer. Gold is characterized by medium-term long, so a rollback to 1900 and even lower is possible, however, the medium-term instrument looks very good up.
Thank you for like and share your views!

Gold - The Tea Leaves Say: More Downside On Deck3.5% is a lot in gold, and that's about the range of the total landslide we've been through the entirety of August so far.
It's the kind of pattern where goldbugs and USD collapse narrative nerds go long and go long or hodl and hodl but the price never goes up.
In my last call on gold from the beginning of July, I warned that $2,000 was a death trap. That call was pretty successful, coming just a few dollars shy of the target, abeit it was because the next month's futures contract settled some 2% higher.
Gold - $2,000 Is a Death Trap
And with the index markets at large, I caution that Nasdaq not breaking 15,000 is actually a real bull trap
QQQ - Is It Rally Time? Or Are You Too Early?
With gold, geopolitical risks are heightened because Xi Jinping and the Chinese Communist Party he has yet to throw away bought a lot of gold, and at relatively high prices, according to media reports at least.
And thus, because of this, a form of subtle on-the-low economic sanctions against Xi and/or the CCP can be to devalue the price of gold, which puts the central bank in a bind.
And this is a real problem for China right now with all the other economic catastrophes that land one after another, and the flooding, and the instability, and the posturing of the International Rules Based Order about war/invasion via Taiwan.
The CCP won't invade Taiwan. But China might get invaded by the IRBO via Taiwan.
You might not believe it. But give it some sober thought. Tacticians are tacticians for a reason. Hitting from the shadows and blind spots is a real useful thing.
But for Xi, he can always weaponize the 24-year persecution against Falun Dafa that was launched on July 20, 1999 by former Chairman Jiang Zemin against the entire world.
Because the whole world has been going to Shanghai to train under the Jiang faction for economic and social benefits. Which means a lot of closet skeletons. Which means a lot of data dumps can serve as weapons delivered to international media in the future.
Anyways, here's the call, friends.
Gold is obviously going down and will go down farther. It really looks like it's seeking at least the short term lows, which means $1,900 is longzo-gonzo.
And so on a dump from where we're at at time of posting to, say $1,850, you're getting 5% on a very safe short.
You can short the hole.
And 5% is a lot of money on gold.
Probably only at $1,850 can we look for reversal longs towards new all time highs.
But with how lethargic gold has been, we may very well just have seen the top on the re-run to $2,080.

Strifor || AUDUSD-08/21/2023Preferred direction: SELL
Comment: The US dollar continues to put pressure on the Australian dollar, namely, the squeeze to the level of 0.63750 most likely indicates the seller's intention to continue falling prices. The downside potential is located at the levels of 0.63500 and 0.63000.
Thank you for like and share your views!

#Gold Update I believe we are in wave (3) of of c. It has been difficult to define what was going on at the lowest levels of time.
In doing so, I tagged the result of 1-2 waves, anticipating a decrease in wave 3 of 3 of (3) anytime soon. However, the big plunge may never occur because the price continues to roll gradually down through levels.

GOLD (XAUUSD): FOMC Ahead! Your Plan: 🥇
Today, we are expecting the FOMC minutes.
Here is your plan to trade Gold.
As you know, the market is currently approaching a key daily structure support.
Analyzing the reaction of the price to that structure on a 4H time frame,
I spotted a horizontal trading range.
1910 - 1912 is the upper boundary of the range.
Bullish breakout of that - 4H candle close above, will be a strong bullish signal for you.
I would suggest buying the market then, expecting a bullish continuation at least to 1923.
Also, remember that the news can be bearish.
In such a case, I would recommend staying away from the market.
❤️Please, support this video with like and comment!❤️
