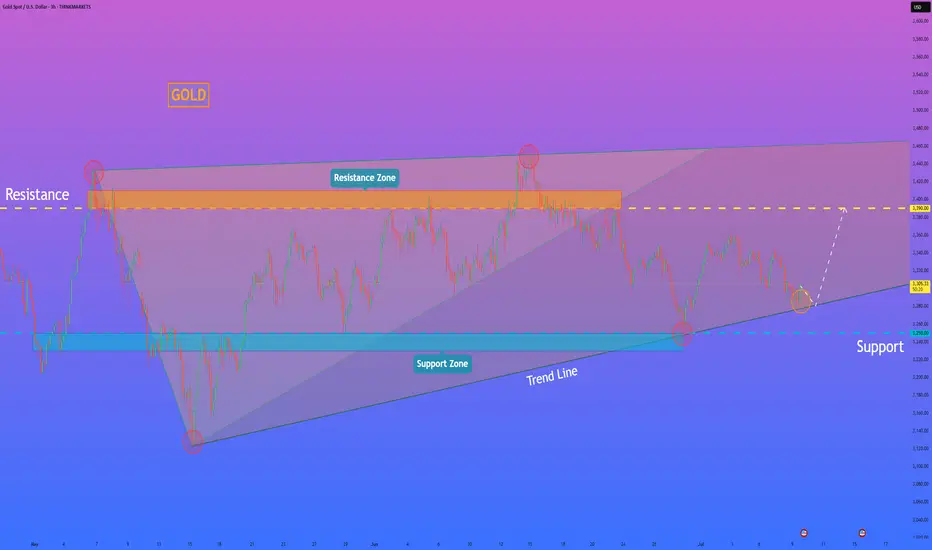
HelenP I. Gold can rebound from trend line and start to move upHi folks today I'm prepared for you Gold analytics. In this chart, we can see that gold has formed a clear wedge pattern, and within it, we can also observe a smaller triangle forming. This structure reflects a narrowing price range and growing tension between buyers and sellers. After testing the upper boundary near the resistance zone at 3390 - 3410 points twice, gold started moving lower and now approaches the trend line again. This level has already held as support multiple times, and each time the price touched it, it showed a rebound with renewed buying interest. Now the price is again trading near this trend line, around the 1300s area, and a small triangle has formed inside the larger wedge. This triangle may act as a base for the next upward movement. I believe that as long as gold respects this trend line and doesn’t break below the 3250 - 3230 support zone, the probability of upward continuation remains strong. My current target is the 3390 resistance level, which aligns with the top boundary of both the wedge and the resistance zone. A breakout above the triangle may give the price enough momentum to approach this area again. That’s why I remain bullish in this situation and expect a bounce from current levels, followed by an upward move toward the resistance. If you like my analytics you may support me with your like/comment.❤️
Disclaimer: As part of ThinkMarkets’ Influencer Program, I am sponsored to share and publish their charts in my analysis.
Gold
7.9 Latest gold trend analysis and operation layout📰 News information:
1. Federal Reserve meeting minutes
📈 Technical Analysis:
Our decision to close our positions at 3305 yesterday was undoubtedly a very strategic one. After reaching a high of around 3310 last night, it began to fall. At the same time, I also gave VIP members the news that it might fall back to around 3300. Since the opening, the lowest point has reached around 3285. The overall trend is still under our control.
At present, gold will still usher in technical corrections in the short term. The current price of 3293-3290 support can be considered for long positions. If the European session continues to fall below the low, you can try to go short during the NY session. If the European session continues to maintain sideways consolidation, you can consider retreating and going long during the NY session. As long as the key support of 3250 below is held, gold will maintain its consolidation trend in short-term trading. On the contrary, once it falls below 3250, gold may directly touch the 3200 mark. Focus on the minutes of the Federal Reserve meeting, which may further influence the trend of gold.
🎯 Trading Points:
BUY 3293-3290-3285
TP 3305-3310-3320
In addition to investment, life also includes poetry, distant places, and Allen. Facing the market is actually facing yourself, correcting your shortcomings, facing your mistakes, and exercising strict self-discipline. I share free trading strategies and analysis ideas every day for reference by brothers. I hope my analysis can help you.

GOLD - SHORT TO $2,800 (UPDATE)Gold has dropped even lower overnight during the Asian market session. We're now running 500 PIPS in profit & hopefully this is only the BEGINNING of this huge move.
Being extremely careful here, as Gold is currently at a make or break sort of area.

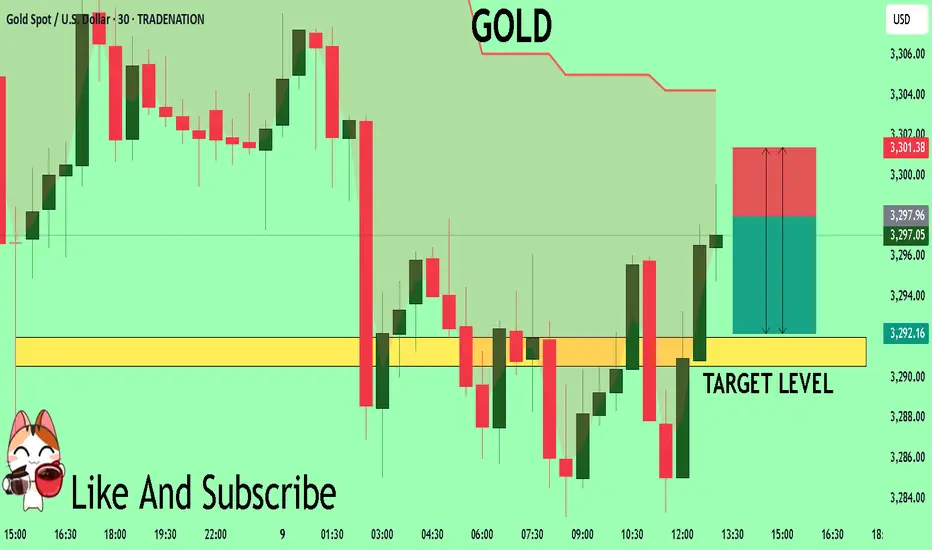
GOLD Trading Opportunity! SELL!
My dear subscribers,
My technical analysis for GOLD is below:
The price is coiling around a solid key level - 3297.6
Bias - Bearish
Technical Indicators: Pivot Points High anticipates a potential price reversal.
Super trend shows a clear sell, giving a perfect indicators' convergence.
Goal - 3291.9
My Stop Loss - 3301.3
About Used Indicators:
By the very nature of the supertrend indicator, it offers firm support and resistance levels for traders to enter and exit trades. Additionally, it also provides signals for setting stop losses
Disclosure: I am part of Trade Nation's Influencer program and receive a monthly fee for using their TradingView charts in my analysis.
———————————
WISH YOU ALL LUCK
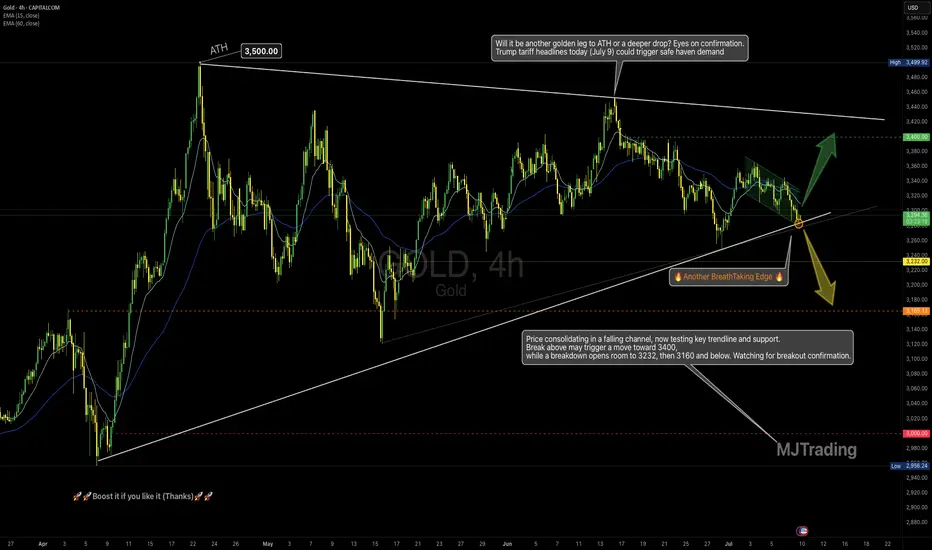
Gold at a Decision Point-Just as Tariff Headlines Return(July 9)📌
4H Technical Outlook by MJTrading
Price is compressing inside a falling channel, nested within a large symmetrical triangle, and now sits right at a high-stakes confluence zone — a perfect intersection of dynamic EMAs, rising trendline support, and local structure.
This could be a pivot point for the next major leg.
🧭 Key Scenarios:
🟢 Bullish Breakout Potential:
If price breaks above the falling channel and holds above $3,310–$3,320:
🎯 Target: $3,400, and eventually upper triangle resistance near $3,480–$3,500
✅ Watch for impulsive breakout + retest confirmation
🟡 Bearish Breakdown Risk:
If the rising trendline gives way and price closes below $3,275 (High Risk) and $3,245(Low Risk):
🎯 Targets: First $3,232, then key level $3,166
⚠️ Further weakness may expose $3,000 psychological support
🔍 Why It Matters:
• Symmetry + compression = potential volatility expansion
• Trump tariff headlines today (July 9) could trigger safe haven demand
• Strong historical respect of these trendlines
• EMAs aligning around decision zone
“Another BreathTaking Edge” — because this is one of those moments where market structure whispers louder than words.
🗣 Boost if you find value, and follow MJTrading for more clean setups.🚀🚀
#XAUUSD #Gold #TradingView #TechnicalAnalysis #ChartPatterns #PriceAction #BreakoutTrade #Forex #MJTrading
Zoom in to get closer to battlefield:
Zoom out to see where we are:
XAUUSD: Market analysis and strategy for July 9Gold technical analysis
Daily chart resistance level 3340, support level below 3245
Four-hour chart resistance level 3308, support level below 3264
One-hour chart resistance level 3296, support level below 3275.
The expectation that the Fed will keep interest rates unchanged in July has been widely accepted by the market, mainly because Trump announced that he would increase import tariffs on goods from many countries from August 1, triggering market concerns about rising inflation. This expectation pushed up the US 10-year Treasury yield, supporting the dollar to a two-week high, which put gold under downward pressure. On Tuesday, gold closed sharply lower at the daily level, with ma5 and ma10 running downward, indicating that the bears once again dominated. Today, the price of gold may continue to fall. Pay attention to the support near the lower track 3275. If the price of gold closes the real falling candle again today, it will drive the Bollinger Band opening downward, which will further confirm the downward trend. The market may start a new round of decline in the future. The 4-hour level K line continues to fall, and the Bollinger Band opening expands downward! The short-term key support position below is around 3275. After breaking through, it may fall to the previous low of 3266-3245; the important pressure position is around 3308!
SELL: 3296near
SELL: 3308near
BUY: 3250near

Gold Under Pressure as Dollar Strengthens – Watch Below 3297FX:XAUUSD – Technical & Fundamental Outlook
Gold prices declined on Monday, pressured by a stronger U.S. dollar following President Trump’s announcement of a potential 10% tariff on BRICS-aligned countries. The news supported the dollar and weakened demand for gold as a safe-haven asset.
Although uncertainty remains around U.S. trade negotiations ahead of the July 9 tariff deadline, signals of possible extensions and staggered implementation have further reduced short-term haven flows into gold.
Technical View:
Gold remains under bearish pressure while trading below 3320.
As long as the price stays under this level, we expect sideways consolidation between 3297 and 3320 until a breakout occurs.
A 1H close below 3297 would confirm bearish continuation, targeting 3281 and 3255.
A break above 3320 would invalidate the bearish outlook and shift momentum toward 3342.
Pivot: 3297
Support Levels: 3281 / 3255 / 3239
Resistance Levels: 3314 / 3320 / 3342
Previous idea: Click Here...

Bitcoin vs Gold: Driving the Point Home📉 Bitcoin vs Gold: Driving the Point Home The long-term comparison we can't afford to ignore.
Gold, after achieving mainstream status, weathered a 20-year consolidation phase, low volatility, muted investor excitement, but enduring presence. This historical precedent forces us to reconsider expectations for Bitcoin, now in its 15th year.
⚡ While Bitcoin’s adoption curve has been sharper, its market dominance has steadily declined since 2017. Despite intermittent, and often deceptive relief rallies, the trend remains downward. Altcoins, forks, and shifting narratives (DeFi, NFTs, meme tokens) continue to fragment attention and capital.
⚡ Could Bitcoin follow gold’s path and enter a prolonged era of post-hype consolidation? If so, the next bull run might be a decade away or more … if it happens at all. In an age of digital abundance, durability; not innovation, may define Bitcoin’s legacy.
📊 Chart Highlights: The latest image visualizes Bitcoin’s current phase against gold’s historical arc. The final label "Monetary Maturity" suggests a shift from speculative highs to a more sober test of endurance.
🔍 Will Bitcoin evolve into a true store of value or fade as just another chapter in financial innovation? Let the markets answer, but history offers clues. Only Time will tell.
#Bitcoin #Gold #CryptoAnalysis #BTCdominance #CryptoHistory #DigitalAssets #TradingView
CRYPTO:BTCUSD INDEX:BTCUSD TVC:SILVER NASDAQ:MSTR NASDAQ:MARA NASDAQ:COIN NASDAQ:TSLA TVC:DXY NYSE:CRCL

Strong USOIL Setup: Long from Support + 4.34 R/RHey Guys, hope you're all doing well!
I've placed a limit buy order on USOIL from a key support level. Below are the relevant levels for your reference:
- 🔵 Entry Level: 67.424
- 🔴 Stop Loss: 66.803
- 🟢 Target 1 (TP1): 67.908
- 🟢 Target 2 (TP2): 68.456
- 🟢 Target 3 (TP3): 70.036
📊 Risk/Reward Ratio: 4.34
Your likes and support are what keep me motivated to share these analyses consistently.
Huge thanks to everyone who shows love and appreciation! 🙏

Smart 15-Min Entry on USDJPY – Clear Plan with 2.33 R/R📢 Hey Guys;
I've placed a buy limit order on USDJPY at a key support level.
🔵 Entry: 145.956
🔴 Stop Loss: 145.743
🟢 Targets:
• TP1: 146.069
• TP2: 146.232
• TP3: 146.468
📐 Risk/Reward Ratio: 2.33
-------
Your likes and support are what keep me motivated to share these analyses consistently.
Huge thanks to everyone who shows love and appreciation! 🙏

GOLD SELL M15Gold (XAU/USD) 15-Min Chart Analysis – July 9, 2025
The price is currently trading around the 3,295 level, after a recent Change of Character (CHoCH) and Break of Structure (BOS) indicating a shift from bullish to bearish momentum.
The market has formed a consolidation zone (highlighted in purple), suggesting a possible bearish continuation setup. Price is expected to retest the supply zone and then move lower.
Sell Setup Details:
Entry Zone: Inside the purple consolidation range (~3,295–3,297)
Stop Loss (SL): 3,305
Target (TP): 3,282
Key Support Levels:
3,292.16
3,288.16
3,282.39 (Main Target Zone)
This setup anticipates a bearish move after a rejection from the supply area, aiming for the liquidity zone near 3,282.

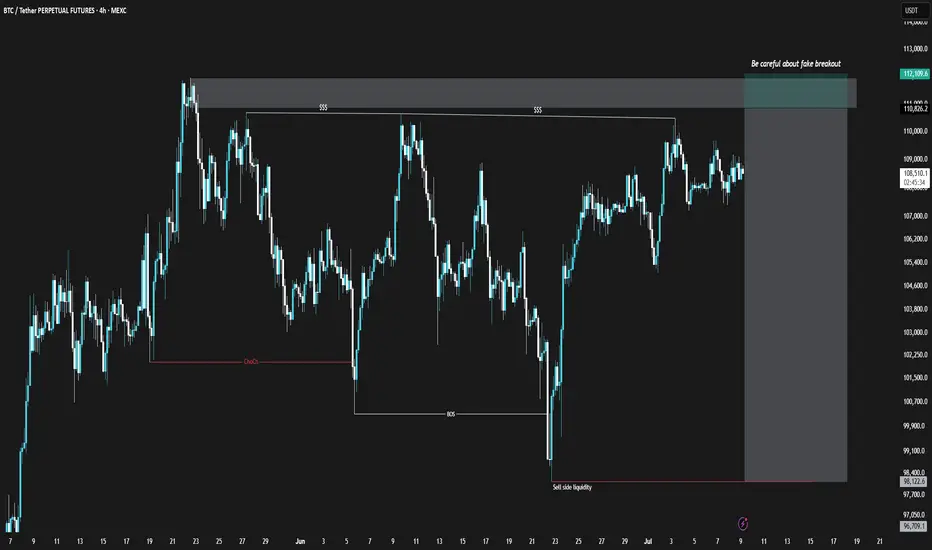
BTCUSDT Short Position (25/Jul/9)Bitcoin, similar to the TOTAL chart, is showing weakness in its bullish momentum. However, unlike TOTAL, the divergence in Bitcoin is clearly noticeable. Additionally, within the marked zone on the Bitcoin chart, there is a possibility of a fake breakout and liquidity grab. I suggest entering only with proper confirmation.
⚠️ This Analysis will be updated ...
👤 Sadegh Ahmadi: GPTradersHub
📅 2025.Jul.9
⚠️(DYOR)
❤️ If you apperciate my work , Please like and comment , It Keeps me motivated to do better
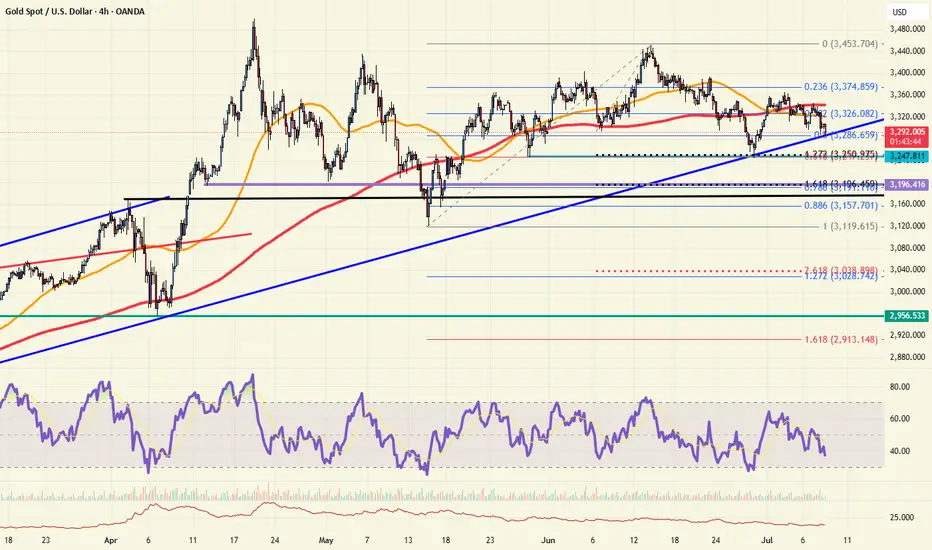
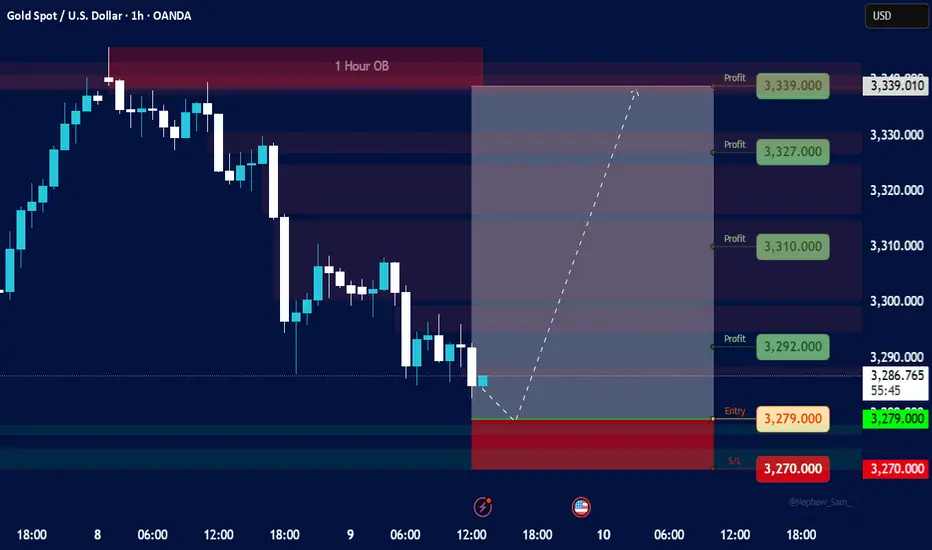
Gold Spot / U.S. Dollar - 1h Analysis (OANDA)Price Overview
Current Price: 3,286,190
24h Change: +15,525 (+0.47%)
Recent High/Low:
High: 18,286,420
Low: 12,284,465
Order Block (OB) Analysis
Profit Targets:
Multiple profit levels are identified, with the highest at 3,339,000 and the lowest at 3,279,000.
The price is currently between the 3,286,190 (current) and 3,279,000 (next profit level), suggesting a potential pullback or consolidation.
Entry & Stop-Loss:
Entry: 3,270,000
Stop-Loss (S/L): 3,270,000 (same as entry, indicating a break-even or tight risk strategy).
Key Levels (USD)
Resistance:
3,350,000 (major)
3,339,000 (immediate)
Support:
3,286,190 (current level)
3,279,000 (next profit target)
3,270,000 (critical support & entry)
Market Sentiment
Bullish Bias: Price is above the entry point (3,270,000) and showing a 0.47% gain.
Caution: Profit-taking may occur near 3,330,000–3,339,000. A break below 3,270,000 could invalidate the bullish setup.
Actionable Insights
If Long: Hold for targets up to 3,339,000, but monitor for rejection at resistance.
If Neutral: Wait for a break above 3,330,000 (confirmation) or below 3,270,000 (reversal signal).
Risk Management: Tight stop-loss at 3,270,000 protects against downside.
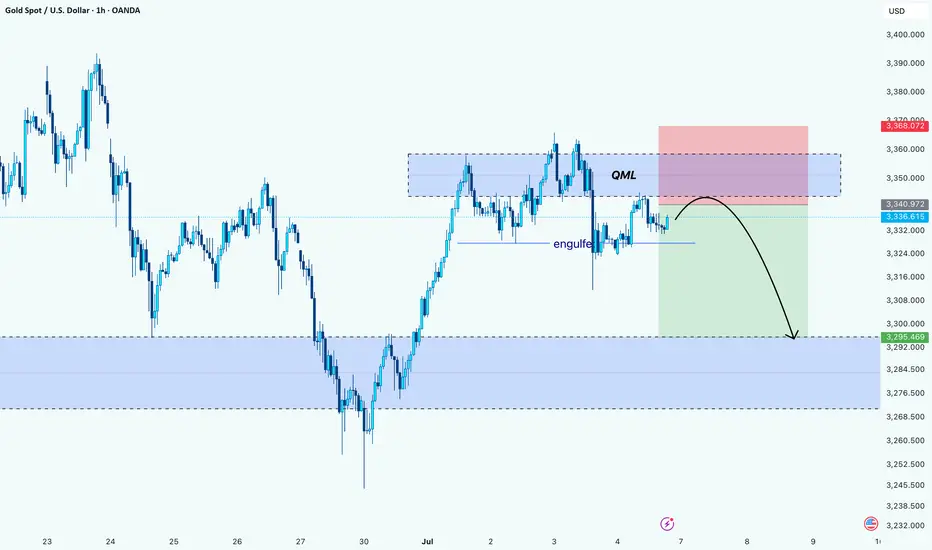
Gold’s Trap Above QML: Bearish Play UnfoldingHello Guys!
Gold appears to be forming a textbook Quasimodo reversal setup after printing a lower high into a key supply zone. Price aggressively tapped into the QML area (around 3,350–3,360), where sellers previously stepped in, and we’re now seeing signs of rejection.
The engulf zone marked earlier confirms bearish intent. It broke structure and flipped momentum. Price is currently retesting below that engulf level, likely as a last attempt to grab liquidity before heading down.
The projected move suggests a drop toward the next significant demand zone around 3,295–3,285, where the price previously found a strong bullish reaction.
Bias: Bearish below QML
Target: 3,295 zone
Invalidation: Above 3,368 (high of supply zone)
Gold (XAU/USD): Playbook in ActionHello guys!
We’ve seen a textbook QML (Quasimodo Level) setup play out beautifully on gold. Price pushed into a key supply zone and formed a QML structure, followed by a clean engulfing of the previous demand. confirming smart money involvement. As expected, the target of that QML has now been hit, tapping into the major demand zone below.
After the deep sweep and reaction from demand, price retraced upward into a potential lower high area. Based on structure and liquidity dynamics, two potential scenarios are in play:
We’re executing a two-step plan here:
Step 1: Short position from the QML + supply area, aiming for the next blue demand zone. Liquidity has been taken above the high, confirming the setup.
If we get a clean reaction near the blue area, that’s our signal to flip long. We expect a pullback toward $3310 area.

Analyzing the Market with Fundamental and Technical AnalysisAnalyzing the Market with Fundamental and Technical Analysis
In addition to technical analysis, it's important to consider fundamental factors that could influence the market. News releases, economic reports, and central bank decisions can significantly impact price movements.
Fundamental Analysis:
Keep an eye on major economic indicators like NFP, CPI, and interest rate decisions. These factors can drive the market and change its trend direction.
Technical Analysis:
Use tools like EMA, Fibonacci, and Price Action to confirm the trend and identify entry points.
For daily updates and comprehensive market analysis, join my MMFLowTrading TradingView channel, where I combine both technical and fundamental analysis to give you the most accurate insights.
Conclusion:
Identifying market trends in one day doesn’t have to be complicated. By using the right tools like EMA, Fibonacci, and Price Action on TradingView, you can make better trading decisions every day. To take your trading to the next level, join my MMFLowTrading TradingView channel for daily updates, real-time trend analysis, and expert trading signals.
Ready to start trading with precision? Join my MMFLowTrading TradingView channel today for daily market insights and trading setups. Stay updated with real-time analysis, get actionable trading signals, and take your trading skills to the next level. Follow me now on TradingView!
Gold 30Min Engaged ( Bearish Entry Detected )
Time Frame: 30-Minute Warfare
Entry Protocol: Only after volume-verified breakout
🩸Bearish Break : 3386
➗ Hanzo Protocol: Volume-Tiered Entry Authority
➕ Zone Activated: Dynamic market pressure detected.
The level isn’t just price — it’s a memory of where they moved size.
Volume is rising beneath the surface — not noise, but preparation.
🔥 Tactical Note:
We wait for the energy signature — when volume betrays intention.
The trap gets set. The weak follow. We execute.
Gold 30Min Engaged ( bearish Entry Detected )

GOLD → Readiness to test the local bottomFX:XAUUSD is under pressure from the rising dollar and uncertainty, breaking through support levels, which opens up a corridor for the market to fall to 3255 - 3246
The price of gold is consolidating around $3300 after falling more than 1% amid expectations of the Fed minutes and news about tariffs.
Investors remain cautious: the dollar is supported by hopes for US trade deals, while the threat of new tariffs from August 1 is holding back gold's growth.
Weak inflation data in China did not support the metal, while expectations that the Fed will not rush to cut rates due to inflationary pressure from tariffs are also limiting interest in gold. Traders are waiting for the Fed minutes and new statements from Trump to determine the further direction.
Technically, the market looks weak (on D1, the price closed below the key level of 3300 on Tuesday) and there is a chance of a further decline.
Resistance levels: 3300, 3311
Support levels: 3295, 3255, 3246
Consolidation below 3295-3300 could trigger a further decline to 3255, from which the market could react with a correction.
Buying can be considered if gold reverses the short scenario, manages to strengthen to 3311, and consolidates above this level. At the moment, the price is in the selling zone...
Best regards, R. Linda!

Gold To The Basement? Week Ahead with Bearish Bias by PhoenixFX🌟 Welcome to Phoenix FX’s Intraday Pulse! 🌟
Hello, Phoenix FX family! 👋 I’m thrilled you’ve joined us for today’s TradingView chart breakdown. Our focus? Intraday opportunities—spotting those high-probability setups you can enter, manage, and leave to run whilst you concentrate on the things you love doing.
Here’s what you’ll find in this analysis:
Key Levels & Zones: Support, resistance, and Fair Value Gaps that matter on the smaller timeframes.
Price-Action Clues: Exact candlestick patterns and momentum signals to watch for your next entry.
Trade Triggers & Targets: Clear criteria for when to get in, where to take profits, and how to manage your risk.
Whether you’re hunting quick scalps or tactical swing moves, our goal is simple: help you trade with confidence, clarity, and community support. Got a different view or a fresh idea? Drop it in the comments—after all, “each one, teach one.” 😉
Let’s dive into the charts and make today’s market moves count! 🚀📈
Donald Trump’s presidency continues to exert outsized influence on gold through three main channels: trade policy uncertainty, fiscal stimulus (and resulting deficits), and shifts in safe-haven demand. Here’s how each factor has played out—and what it could mean for gold going forward:
1. Trade-War Uncertainty
What’s Happening: The Trump administration’s aggressive use of tariffs—including recent 25% duties on goods from Japan and South Korea—has periodically roiled markets and driven investors into gold as a safe haven. On July 7, gold pared losses after tariff news, as traders sought refuge despite a firm dollar.
Looking Ahead: If further tariff escalations or retaliations emerge, expect renewed spikes in gold. Conversely, any de-escalation or trade-deal breakthroughs could sap that safe-haven bid.
2. Fiscal Stimulus & Deficits
What’s Happening: Senate Republicans recently passed a Trump-backed tax‐and‐spending package projected to add $3.3 trillion to the U.S. deficit. Larger deficits—especially when financed by the Fed—tend to stoke inflation expectations, which bolsters gold’s appeal as an inflation hedge.
Looking Ahead: Continued large-scale stimulus or fresh tax cuts without offsetting revenue measures could keep real yields low (or negative), a classic tailwind for gold.
3. Safe-Haven Flows & Investor Positioning
What’s Happening: Despite peaking at record highs earlier this year, gold remains up roughly 30% since November, driven largely by investor fears around Trump’s policy unpredictability and geopolitical tensions.
Looking Ahead: Should Trump-era uncertainty persist—whether around trade, foreign policy, or domestic turmoil—gold is likely to retain its status as a portfolio diversifier and crisis hedge. A sustained drop in U.S. real rates or fresh bouts of market volatility would reinforce that trend.
🎯 Outlook Summary
Bullish Drivers: Ongoing trade-war rhetoric, larger deficits, and any new geopolitical flashpoints.
Bearish Risks: Clear resolution of major trade disputes, a pivot by the Fed toward earlier rate cuts (reducing real‐rate support for gold), or diminished investor fear.
------------------------------------------------------------------------------------------
PhoenixFX price action analysis based on the Daily time frame
🔴 Primary Resistance (Daily)
Zone: $3,348 – $3,400
Why It Matters:
Multiple daily closes have stalled here, leaving a clear Fair-Value Gap (dashed purple). Sellers are likely to defend this range until we see a decisive daily close above $3,400.
📉 Bearish Bias – Short Setups
Short at Resistance
Entry: Bearish daily reversal candle (engulfing, pin-bar) in $3,348–$3,400
Targets:
TP1: $3,290 (50% of Primary Buy Zone)
TP2: $3,250 (Primary Buy Zone low)
TP3: $3,172 (Secondary Buy Zone high)
Stop-Loss: Above $3,420
Breakdown Short
Trigger: Daily close below $3,250 (Primary Buy Zone low)
Entry: On the open of the next daily candle after close below $3,250
Targets:
TP1: $3,172 (Secondary Buy Zone)
TP2: $3,026 (Final Buy Zone 50% level)
Stop-Loss: Above $3,290
🔵 Potential Long Opportunities
Defensive Long (Aggressive)
Entry: Bullish daily rejection candle in $3,250–$3,290
Targets:
TP1: $3,348 (short-term resistance)
TP2: $3,400 (key resistance)
Stop-Loss: Below $3,230
Trend-Reversal Long (Ultra-Conservative)
Trigger: Daily close above $3,400
Entry: Open of the next daily candle after the close above $3,400
Targets:
TP1: $3,450
TP2: $3,500+
Stop-Loss: Below $3,360
📊 Week-Ahead Scenarios
Bearish Scenario (High Probability):
Price remains capped under $3,400.
Look for a bearish signal in $3,348–$3,400 to initiate shorts.
A break below $3,250 extends the move into deeper demand zones ($3,172 → $3,026).
Bullish Counter-Trend (Lower Probability):
Strong daily rejection candle in $3,250–$3,290 could spark a relief rally.
Short-term longs can target $3,348 and $3,400—ideal for quick swing trades.
Only a sustained daily close above $3,400 shifts the bias back to the upside.
Just a Heads-Up:
This is my take on the charts—not gospel, not financial advice, and definitely not a crystal ball 🔮.
Trading is part skill, part patience, and part “what just happened?” 😅
We all see things a little differently, and that’s the beauty of it. So if you’ve got a hot take, wild theory, or just want to drop some chart wisdom—hit the comments!
Let’s grow, learn, and laugh through the madness together. 🚀📈
Each one, teach one.
— Phoenix FX Team 🔥🦅

First Drop to 3307–3289, Then Buy for the Next UptrendOur system has identified a strong short signal across short-term, medium-term, and long-term timeframes as of July 3, 2025, with confidence levels above 89%. All durations are aligned, indicating a synchronized momentum shift.
Entry Point : 3354.43
Short-Term TP : 3334.30
Medium-Term TP : 3320.89
Long-Term TP : 3307.47~ 3289
📉 Based on the current market structure and signal convergence, TeconLab expects XAUUSD to drop into the 3307–3289 range, where a potential reversal zone is likely to form.
🛡️ Safest Entry for Buy: The 3289 level is considered the most favorable area for entering long positions after the expected correction completes.
📈 After reaching this zone, our system anticipates a new uptrend to begin, offering a fresh opportunity for upside movement.
The TP Zigzag path displayed on the chart outlines the projected decline with target steps, preparing for a potential bullish reversal afterward.

GOLD is in bearish conditions, pressured by aggressive tariffsOn Wednesday (July 9) in the Asian market, the spot OANDA:XAUUSD suddenly fell sharply in the short term, and the gold price just fell below 3,290 USD / ounce.
Although US President Trump announced that the first tariff letters had been sent to some US trading partners, the gold price fell below 3,290 USD / ounce due to the weakening demand for safe-haven gold. Trump postponed the tariff deadline to August 1, easing trade tensions.
The recovery in the dollar TVC:DXY and rising US Treasury yields also weighed on gold, sending prices sharply lower after hitting a high of $3,345 an ounce.
The yield on the 10-year US Treasury note TVC:US10Y rose to its highest in more than two weeks, making gold, which does not pay interest, less attractive as an investment.
The yield on the 10-year US Treasury note rose to 4.415%. The US real yield also rose 4 basis points to 2.073%.
TVC:DXY , which tracks the greenback's performance against a basket of currencies, rose 0.20% to 97.70. The rise in the Dollar Index means that gold priced in dollars has become less attractive because they are inversely correlated.
Japan and South Korea said on Tuesday they would try to speed up trade talks with the United States in a bid to soften President Donald Trump's stance on new tariffs set to take effect on August 1.
But optimism about a trade deal boosted market risk appetite, limiting gold's upside.
Traders are awaiting the release of the minutes of the Federal Reserve's latest meeting on Wednesday, followed by data on initial jobless claims for the week ended July 5.
Investors now expect the Fed to cut interest rates by 50 basis points before the end of the year, starting in October.
Technical Outlook Analysis OANDA:XAUUSD
On the daily chart, gold fell below the 3,300USD whole price point and the 0.382% Fibonacci retracement level, which are the initial conditions for gold prices to have a prospect for a bearish trend.
Currently, with the position below 3,300USD, gold may continue to decline with the next target around 3,246USD in the short term, more than the 0.50% Fibonacci retracement level.
The current resistances of gold prices are the pressure from the EMA21 line, followed by the 0.236% Fibonacci retracement. These are also the resistance positions that readers paid attention to in the previous issue.
In addition, the RSI is pointing down from 50, currently 50 is considered the nearest resistance and the fact that the RSI is pointing down is quite far from the oversold zone, indicating that there is still room for a decline ahead.
During the day, although the trend is not yet completely clear, gold is showing conditions that are more inclined towards a decline, along with that, the notable positions will be listed as follows.
Support: 3,292 - 3,246 USD
Resistance: 3,300 - 3,340 - 3,350 USD
SELL XAUUSD PRICE 3346 - 3344⚡️
↠↠ Stop Loss 3350
→Take Profit 1 3338
↨
→Take Profit 2 3332
BUY XAUUSD PRICE 3245 - 3247⚡️
↠↠ Stop Loss 3241
→Take Profit 1 3253
↨
→Take Profit 2 3259

Trump "stirred up" GOLD recovery but limited by USD appreciationSpot CAPITALCOM:GOLD has rebounded strongly from yesterday's lows, currently trading around $3,333/oz. The main reason is that US President Trump announced a 25% tariff on Japan and South Korea starting August 1, which boosted safe-haven demand. However, the strengthening US Dollar has also limited the broader recovery in gold prices.
On Monday local time, US President Trump sent letters to 14 countries including Japan, South Korea and South Africa threatening to impose tariffs. He then signed an executive order to extend the suspension of "reciprocal tariffs" until August 1.
Trump announced that he would impose a 25% tariff on imports from Japan and South Korea, effective August 1. In a letter to the leaders of Japan and South Korea, Trump said the tariffs would be imposed on August 1 because the two countries' trade relationship with the United States is "very unfair".
This is his first letter to major trading partners ahead of the July 9 deadline to reach a trade deal.
Trump said that despite the large trade deficits between the United States and South Korea and Japan, the United States has decided to continue to cooperate with the two countries. However, the United States has decided to move forward on the premise of more balanced and fair trade. Trump said that the trade deficit has posed a major threat to the US economy and even national security, so changes are needed. Starting August 1, 2025, the United States will impose a 25% tariff on all products from South Korea and Japan, regardless of the different tariffs by industry.
Additionally, any attempt to circumvent tariffs by shipping through a third country will also be subject to higher tariffs.
Trump said companies that choose to build factories or manufacture products in the United States will not have to pay the tariffs. Additionally, if South Korea and Japan decide to increase tariffs on the United States, the United States will impose additional tariffs of the same size on top of the current 25% tariff.
Official data released by the People's Bank of China on Monday showed that China's central bank increased its gold reserves in June, marking the eighth consecutive month of increase.
Bank of America said that central banks around the world are buying gold to diversify their foreign exchange reserves, thereby reducing their dependence on the US dollar and protecting against inflation and economic instability, and the trend is expected to continue.
Technical Outlook Analysis CAPITALCOM:GOLD
On the daily chart, gold has recovered from a key technical confluence area, which is the closest support area to note for readers in the weekly publication. The area from $3,292 – $3,300 is the confluence of the 0.382% Fibonacci retracement with the lower edge of the long-term rising price channel. However, the temporary recovery is being limited by the EMA21, the current closest resistance, followed by the 0.236% Fibonacci retracement level.
The recovery momentum is significant, but for gold to have enough technical bullish conditions, it needs to take price action above the EMA21, with a bullish breakout of the 0.236% Fibonacci retracement level then the prospect of a new bullish cycle will be opened.
If gold breaks above the 0.236% Fibonacci retracement level it will have the next target at the raw price point of $3,400 followed by horizontal resistance at $3,430.
During the day, the current gold price should still be assessed as a sideways accumulation trend, when the Relative Strength Index RSI sticks around 50, showing the market's hesitant sentiment.
A strong enough fundamental impact to change the structure will give a more specific technical trend in the coming time, and the notable positions will be listed as follows.
Support: 3,300 - 3,292 USD
Resistance: 3,350 - 3,371 - 3,400 USD
SELL XAUUSD PRICE 3366 - 3364⚡️
↠↠ Stop Loss 3370
→Take Profit 1 3358
↨
→Take Profit 2 3352
BUY XAUUSD PRICE 3294 - 3296⚡️
↠↠ Stop Loss 3290
→Take Profit 1 3302
↨
→Take Profit 2 3308

Gold is at critical support for bullsGold is at a key trend line of support. Most of the world is watching the 3285 level near term, and a break of this level would put the 61.8% Fibonacci retracement at 3248 back in view. A break of this level would target the 3120 level once again. Bulls are nervous, but this key support will be watched carefully into the next trading session.