GOLD ROUTE MAP UPDATEHey Everyone,
Great start to the week with our levels being respected inline with our plans to buy dips.
We started the week with our bearish target 3330 being hit followed with ema5 cross and lock opening 3306 inline with the retracement range. This was hit perfectly completing the retracement range, followed with the weighted level bounce now heading towards 3330.
We still have the market opening bullish gap left at 3358 and will need a challenge and ema5 lock above 3330 to re-confirm this again.
We will keep the above in mind when taking buys from dips. Our updated levels and weighted levels will allow us to track the movement down and then catch bounces up.
We will continue to buy dips using our support levels taking 20 to 40 pips. As stated before each of our level structures give 20 to 40 pip bounces, which is enough for a nice entry and exit. If you back test the levels we shared every week for the past 24 months, you can see how effectively they were used to trade with or against short/mid term swings and trends.
The swing range give bigger bounces then our weighted levels that's the difference between weighted levels and swing ranges.
BULLISH TARGET
3358
EMA5 CROSS AND LOCK ABOVE 3358 WILL OPEN THE FOLLOWING BULLISH TARGETS
3389
EMA5 CROSS AND LOCK ABOVE 3389 WILL OPEN THE FOLLOWING BULLISH TARGET
3416
EMA5 CROSS AND LOCK ABOVE 3416 WILL OPEN THE FOLLOWING BULLISH TARGET
3439
BEARISH TARGETS
3330 - DONE
EMA5 CROSS AND LOCK BELOW 3330 WILL OPEN THE FOLLOWING BEARISH TARGET
3306 - DONE
EMA5 CROSS AND LOCK BELOW 3306 WILL OPEN THE SWING RANGE
3283
3254
As always, we will keep you all updated with regular updates throughout the week and how we manage the active ideas and setups. Thank you all for your likes, comments and follows, we really appreciate it!
Mr Gold
GoldViewFX
Gold

GOLD BUY M15 Gold (XAU/USD) Analysis – 15-Minute Chart
The price is currently showing signs of bullish momentum after forming a Break of Structure (BOS) around the 3297 level, which is also marked as the Stop Loss (SL) area.
After retesting the demand zone (highlighted in purple), the price has started to push upwards, suggesting a potential reversal. A bullish price path is projected, with expectations of higher highs.
Key Levels:
Entry Zone (Support): Around 3297 (SL zone)
Resistance Zones:
First Resistance: 3309
Second Resistance: 3314
Final Target: 3320
If the bullish momentum continues, the price is expected to break above the minor resistance levels and reach the target of 3320.
GOLD: Strong Bullish Sentiment! Long!
My dear friends,
Today we will analyse GOLD together☺️
The price is near a wide key level
and the pair is approaching a significant decision level of 3,317.31 Therefore, a strong bullish reaction here could determine the next move up.We will watch for a confirmation candle, and then target the next key level of 3,309.44.Recommend Stop-loss is beyond the current level.
❤️Sending you lots of Love and Hugs❤️

GOLD The Target Is DOWN! SELL!
My dear friends,
Please, find my technical outlook for GOLD below:
The price is coiling around a solid key level - 3316.4
Bias - Bearish
Technical Indicators: Pivot Points Low anticipates a potential price reversal.
Super trend shows a clear sell, giving a perfect indicators' convergence.
Goal - 3307.9
Safe Stop Loss - 3320.5
About Used Indicators:
The pivot point itself is simply the average of the high, low and closing prices from the previous trading day.
Disclosure: I am part of Trade Nation's Influencer program and receive a monthly fee for using their TradingView charts in my analysis.
———————————
WISH YOU ALL LUCK
/////////////////////////

New tariffs are coming. How should gold respond?📰 News information:
1. 90-day tariffs are about to expire
2. New unilateral tariffs
3. Geopolitical situation
📈 Technical Analysis:
On July 4th local time, there were constant turmoil in American politics and trade. Trump declared that the US government would send letters to trading partners that day to set new unilateral tariff rates, which would most likely take effect on August 1. He also revealed that the new tariff rates could soar to 70%. At the same time, Japan-US trade negotiations encountered obstacles, India planned to impose retaliatory tariffs on the United States, and the China-EU tariff war had also begun. At present, the news seems to be more favorable to the bulls.
From a technical point of view, gold closed higher last week, showing that there is still upward momentum this week. In the short term, we need to pay attention to the pressure in the 3365 and 3375 - 3380 areas, and the 3400 mark is a key position where bulls and bears are fighting fiercely. Before breaking through this position, we must be alert to the risk of falling back after a high rise. Pay attention to the support of 3310-3305 and 3295-3285 below. If effective support is obtained, we can consider going long. If it breaks, it may go to 3270-3260. Gold jumped to 3342 at the opening of the Asian session and then fell back. 3345 is the key in the short term. The news may affect its subsequent trend. In the short term, pay attention to the suppression of 3345 on the upper side, and further to the strong resistance area of 3365-3380. If there is resistance and pressure, you can short at a high level. The impact of recent news is erratic, so enter the market with caution and be sure to set TP and SL strictly.
🎯 Trading Points:
SELL 3330-3345
TP 3320-3310-3295
BUY 3310-3305
TP 3320-3330-3345
In addition to investment, life also includes poetry, distant places, and Allen. Facing the market is actually facing yourself, correcting your shortcomings, confronting your mistakes, and strictly disciplining yourself. I hope my analysis can help you🌐.
TVC:GOLD OANDA:XAUUSD FX:XAUUSD FOREXCOM:XAUUSD PEPPERSTONE:XAUUSD FXOPEN:XAUUSD

NFP continues to ferment, short-term trend dominated by bears📰 News information:
1. 90-day tariffs are about to expire
2. New unilateral tariffs
3. Geopolitical situation
📈 Technical Analysis:
Good morning, bros. From a technical point of view, the overall trend of the daily line is a head and shoulders top. If the bulls do not recover 3360, the bears will still be the medium-term trend. The 4H MACD indicator is dead cross running. The best position for the day to deploy the short position again is 3330-3335, and the 1H chart keeps testing the 3305 first-line support, which may be broken in the short term. At present, 3295-3285 below is a relatively important short-term support. Once it falls below, it is expected to reach 3250, which is also the point I repeatedly emphasized in the morning. The intraday operation suggestion is to rebound shorting as the main, and to go long at lows as the auxiliary. Pay attention to the 3325-3335 support area on the upper side and the 3295-3285 support on the lower side.
🎯 Trading Points:
SELL 3325-3335
TP 3315-3305-3295
BUY 3295-3285
TP 3305-3315-3325
In addition to investment, life also includes poetry, distant places, and Allen. Facing the market is actually facing yourself, correcting your shortcomings, confronting your mistakes, and strictly disciplining yourself. I hope my analysis can help you🌐.
FXOPEN:XAUUSD PEPPERSTONE:XAUUSD FOREXCOM:XAUUSD FX:XAUUSD OANDA:XAUUSD TVC:GOLD

XAU/USD : Get Ready for Another Fall ! (READ THE CAPTION)By analyzing the gold chart on the 4-hour timeframe, we can see that, as expected from our previous analysis, when the price was trading around $3327, it climbed to the supply zone at $3345. After reaching this key level, strong selling pressure emerged, leading to a sharp drop in gold today down to $3296.
This move played out exactly as anticipated, and now, if the price stabilizes below $3330, we could expect further downside pressure on gold.
The Main Analysis :

XAU/USD) order block back up trand Read The captionSMC trading point update
Technical analysis of Gold (XAU/USD) on the 1-hour timeframe, focusing on a potential reversal from a key support/order block zone. Here's a full breakdown
---
Chart Analysis – XAU/USD (1H)
1. Key Zone: Support Level / Order Block (Yellow Box)
The price is currently testing a strong support zone that previously acted as a bullish order block (demand area).
This zone is also near a diagonal trendline and a prior breakout level, adding confluence to the setup.
2. Reversal Anticipation (Black Zigzag Path)
The chart suggests two possible scenarios from the support area:
A bullish bounce leading price up toward:
Target 1: 3,343.05 (near 200 EMA)
Target 2: 3,364.62 (upper resistance)
A break below the yellow support zone, triggering a deeper move toward:
Key support: 3,247.55
3. RSI Oversold Signal
RSI (14) is at 32.66, which is near oversold territory, signaling potential for a bullish reversal if buying pressure steps in.
4. EMA (200 - Blue Line)
EMA at 3,330.95 currently acts as dynamic resistance.
If price bounces from the order block, this EMA may serve as the first reaction level before further upside.
Mr SMC Trading point
---
Summary
Bias: Bullish bounce if price holds above 3,296.04 (order block support).
Entry Zone: Current price near 3,301 or confirmation bounce candle.
Targets:
TP1: 3,343.05
TP2: 3,364.62
Invalidation: Strong break and close below 3,296.04 may open the path to 3,247.55.
RSI: Favoring reversal conditions (near oversold).
---
Please support boost 🚀 this analysis)

XAU/USD) support level back bullish trend Read The captionSMC trading point update
Technical analysis of Gold (XAU/USD) on the 3-hour timeframe, suggesting a long trade idea with a clearly defined support zone and target projection. Here's the detailed breakdown:
---
Chart Breakdown (3H - XAU/USD)
1. Support Zone (Yellow Box):
Price reacted strongly to the 3,244–3,300 area, which is identified as a key support level.
This area has historically seen demand and is now acting as a base for potential bullish continuation.
2. Falling Wedge Breakout:
A falling wedge pattern has been broken to the upside, which is typically a bullish reversal signal.
The breakout indicates a shift from the previous bearish momentum into bullish strength.
3. EMA 200 Confirmation:
Price is now above the 200 EMA (3,333.347), supporting a bullish bias.
This can act as dynamic support going forward.
4. RSI Momentum:
RSI at 62.00, indicating growing bullish momentum without being overbought.
The RSI has also broken above a previous local high, confirming strength.
5. Target Projection:
The projected move (blue arrowed box) suggests a potential rally of +105.305 points (3.20%), targeting the 3,394.503 level.
This level aligns with previous price structure and acts as the next major resistance.
6. Anticipated Price Path (Black Zigzag Line):
Price is expected to pull back slightly, retesting the wedge breakout or support zone.
After this retest, a bullish continuation toward the target point is projected.
Mr SMC Trading point
---
Summary:
Bias: Bullish
Pattern: Falling wedge breakout + support retest
Entry Zone: Around 3,300–3,320 on a retest
Target: 3,394.503
Invalidation: Strong break and close below 3,244.166
Confirmation: Bullish price action near support + sustained RSI strength
Please support boost 🚀 this analysis)

XAUUSD: Market analysis and strategy on July 7Gold technical analysis
Daily chart resistance 3360, support 3270
4-hour chart resistance 3345, support 3280
1-hour chart resistance 3325, support 3300.
3300 is now the short-term long-short dividing line. If it falls below, it will enter a new shock zone. Please pay attention to the 3300 support level before the NY market today! (The resistance level is 3320~3325). From the fundamentals, although the gold market has experienced a technical correction in the short term, gold will continue to maintain its status as a safe-haven asset under the continued uncertainty of US trade policy and complex geopolitical tensions. As Trump's tariff deadline (July 9) approaches, we should pay close attention to the development of US trade policy around August 1 (if the tariff policy is delayed to ease the demand for safe-haven assets, combined with the technical bearish information, gold will continue to find support below 3,300).
SELL: 3300
SELL: 3325

Gold corrective pullback support at 3268The Gold remains in a bullish trend, with recent price action showing signs of a corrective pullback within the broader uptrend.
Support Zone: 3268 – a key level from previous consolidation. Price is currently testing or approaching this level.
A bullish rebound from 3268 would confirm ongoing upside momentum, with potential targets at:
3345 – initial resistance
3365 – psychological and structural level
3386 – extended resistance on the longer-term chart
Bearish Scenario:
A confirmed break and daily close below 3268 would weaken the bullish outlook and suggest deeper downside risk toward:
3250 – minor support
3225 – stronger support and potential demand zone
Outlook:
Bullish bias remains intact while the Gold holds above 3268. A sustained break below this level could shift momentum to the downside in the short term.
This communication is for informational purposes only and should not be viewed as any form of recommendation as to a particular course of action or as investment advice. It is not intended as an offer or solicitation for the purchase or sale of any financial instrument or as an official confirmation of any transaction. Opinions, estimates and assumptions expressed herein are made as of the date of this communication and are subject to change without notice. This communication has been prepared based upon information, including market prices, data and other information, believed to be reliable; however, Trade Nation does not warrant its completeness or accuracy. All market prices and market data contained in or attached to this communication are indicative and subject to change without notice.

H4 Gold AnalysisThis is my set up,
this is what i look.
always DYOR
always protect your equity and use a risk management

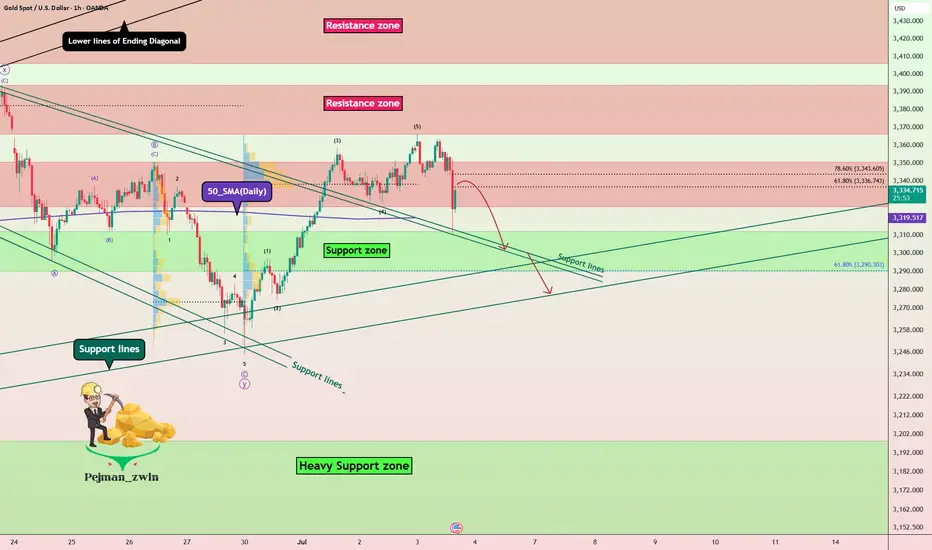
Gold Under Pressure After NFP Beat – More Downside Ahead?Moments ago, the US Non-Farm Payrolls surprised to the upside at 147K (vs 111K forecast), while the Unemployment Rate dropped to 4.1% (vs 4.3% expected) .
This stronger-than-expected labor market data reinforces the idea that the Fed has no immediate reason to cut rates. As a result, the USD( TVC:DXY ) strengthened, and gold came under renewed selling pressure.
If the dollar momentum continues, Gold ( OANDA:XAUUSD ) may face further downside in the short term.
In terms of Technical Analysis , Gold fell below the Resistance zone($3,350-$3,326) again after the announcement of US indices and is currently moving near the Support lines and 50_SMA(Daily) .
In terms of Elliott wave theory , it seems that Gold has completed 5 impulsive waves in the one-hour time frame, and we should now wait for corrective waves .
I expect Gold to fall again after the upward correction , and the Support zone($3,312-$3,290) could be the target.
Note: Stop Loss (SL) = $3,365
Gold Analyze (XAUUSD), 1-hour time frame.
Be sure to follow the updated ideas.
Do not forget to put a Stop loss for your positions (For every position you want to open).
Please follow your strategy; this is just my idea, and I will gladly see your ideas in this post.
Please do not forget the ✅ ' like ' ✅ button 🙏😊 & Share it with your friends; thanks, and Trade safe.
On Swing Traders’ Radar: Gold Pattern Alert on the Daily Chart!Dear Traders,
In my daily gold analysis, I’m observing a Head and Shoulders pattern nearing completion. The neckline is currently positioned around the 3,247.00 level.
If this neckline breaks to the downside, gold could potentially drop toward the 3,150.00 area.
Since this is a one-day analysis—aligned with a swing trading style—it may take some time for the setup to fully play out.
I meticulously prepare these analyses for you, and I sincerely appreciate your support through likes. Every like from you is my biggest motivation to continue sharing my analyses.
I’m truly grateful for each of you—love to all my followers💙💙💙

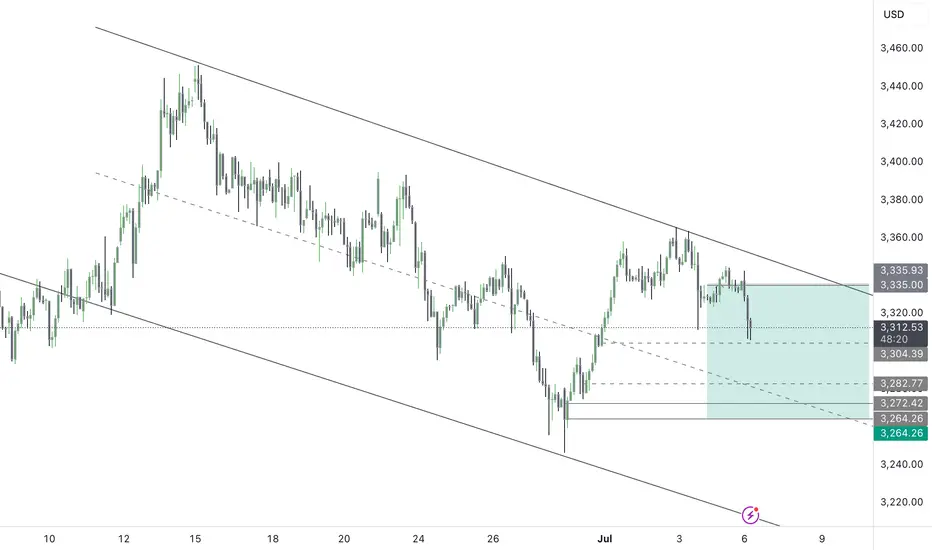
DeGRAM | GOLD formed a declining peak📊 Technical Analysis
● Price has slipped back beneath the inner rising-channel median and is now riding a fresh descending channel; repeated failures at 3 355 have carved a lower-high sequence.
● A clean hourly close under 3 308 would confirm loss of the late-June support shelf and open the next structural pivots at 3 248 (mid-May swing) and 3 202 (channel base / former demand).
💡 Fundamental Analysis
● Firmer US payroll headline and another uptick in 2-yr real yields revived the dollar, while CFTC data show a second week of long liquidation in COMEX gold—dampening bid strength.
✨ Summary
Sell rallies ≤3 330; sustained trade below 3 308 targets 3 248 → 3 202. Bias void on an H4 close above 3 355.
-------------------
Share your opinion in the comments and support the idea with a like. Thanks for your support!

XAUUSD Below 3300 – Buying Opportunity or Trap? Gold Breaks Below 3300 – A Buying Opportunity or Sign of Deeper Correction?
🧭 Weekly Kickoff: Is the Sell-off Really That Dangerous?
At the start of the week, gold experienced a sharp drop to 3306 USD, breaking through the psychological 3300 support level and testing the 329x region. However, this isn't necessarily a sign of a sustainable downtrend — it's more likely a liquidity sweep before the market consolidates again for a bigger move.
🌐 Macro Updates Impacting Gold:
US inflation continues to ease, providing space for the Fed to loosen policy if needed.
FOMC minutes due soon — markets will be closely watching for clues about possible rate cuts.
Tensions in Gaza de-escalate temporarily, leading to a slight reduction in demand for safe-haven assets.
Trump's new tax bill has been passed, adding pressure to US public debt.
US–China trade war may be delayed — reducing short-term geopolitical pressure.
In summary, we are in a consolidation phase, with a high probability of a breakout in the coming days.
📉 Technical Analysis – CP Pattern in Focus
We are seeing a Continuation Pattern (CP), which generally signals that the current correction is a pause before the trend continues.
After rejecting resistance at 3336, gold fell, breaking through the 3323 support and quickly testing the 3303 zone, a key short-term support.
If gold breaks below 3293, the next target will be the 3278 USD liquidity zone, where strong buying could emerge.
📌 Key Trading Plan – 04 July
🔵 BUY ZONE
3294 – 3292
Stop Loss: 3288
Take Profit: 3298 → 3302 → 3306 → 3310 → 3315 → 3320 → 3330
🔴 SELL SCALP
3324 – 3326
Stop Loss: 3330
Take Profit: 3320 → 3316 → 3312 → 3308 → 3304 → 3300
🔴 SELL ZONE
3350 – 3352
Stop Loss: 3356
Take Profit: 3346 → 3340 → 3335 → 3330 → 3320
🧠 Market Sentiment Today
The market is currently in a consolidation phase, likely trading sideways between 3320 and 3340. A breakout seems likely once the liquidity from the US holiday subsides.
✅ Primary Bias: Look to buy dips into support zones.
⚠️ Alternative View: Only consider selling if price clearly rejects key resistance levels.
💬 What’s Your View on Gold Today?
Do you think gold will break through 3390 soon, or is there more room for a deeper correction towards 3270?
👇 Share your thoughts and analysis in the comments below!
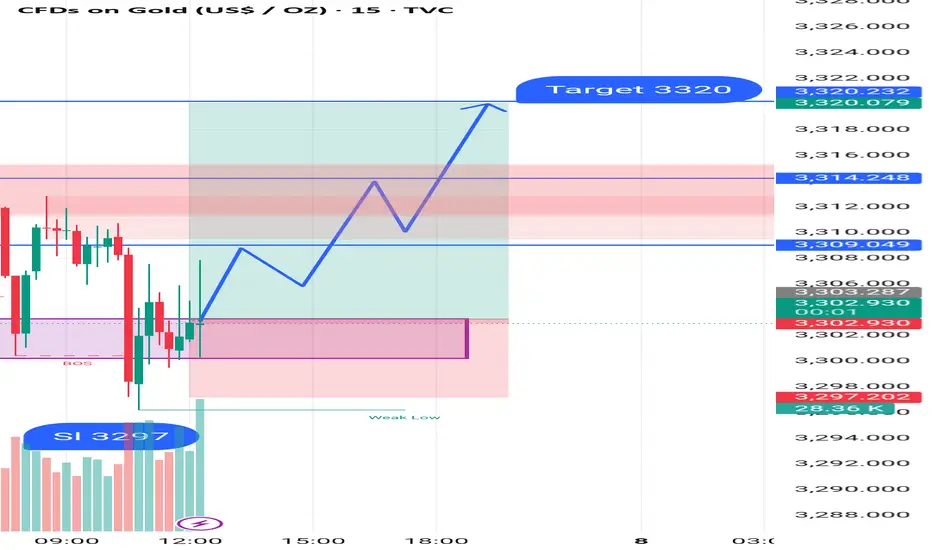
GOLD BUY M15 Gold (XAU/USD) 15-Minute Chart Analysis – July 7, 2025
Trade Setup: The chart shows a bullish trade setup based on a potential reversal from a "Weak Low" support area around 3304. After forming a BOS (Break of Structure) and a small consolidation (highlighted box), price is expected to move higher.
Entry:
Long position initiated slightly above the consolidation zone.
Stop Loss (SL):
Set at 3304, just below the recent weak low support.
Target (TP):
Final target at 3326, where a key resistance level lies.
Key Levels:
Support Zone: 3304 (Weak Low)
Resistance Levels:
3317.5
3222.9
3326.2 (Final Target)
Market Structure Notes:
CHoCH (Change of Character) indicates potential shift to bullish momentum.
Price is expected to form higher highs and higher lows on its way to the target.

GOLD BEST PLACE TO BUY FROM|LONG
GOLD SIGNAL
Trade Direction: long
Entry Level: 3,312.57
Target Level: 3,353.45
Stop Loss: 3,285.24
RISK PROFILE
Risk level: medium
Suggested risk: 1%
Timeframe: 4h
Disclosure: I am part of Trade Nation's Influencer program and receive a monthly fee for using their TradingView charts in my analysis.
✅LIKE AND COMMENT MY IDEAS✅

Bearish reversal off pullback resistance?XAU/USD is rising towards the resistance level which is a pullback resistance that is slightly below the 38.2% Fibonacci retracement and could drop from this level too ur take profit.
Entry: 3,324.16
Why we like it:
There is a pullback resistance level that is slightly below the38.2% Fibonacci retracement.
Stop loss: 3,344.28
Why we like it:
There is an overlap resistance level that aligns with the 61.8% Fibonacci retracement.
Takeprofit: 3,295.40
Why we like it:
There is a pullback support level that aligns with the 61.8% Fibonacci retracement.
Enjoying your TradingView experience? Review us!
Please be advised that the information presented on TradingView is provided to Vantage (‘Vantage Global Limited’, ‘we’) by a third-party provider (‘Everest Fortune Group’). Please be reminded that you are solely responsible for the trading decisions on your account. There is a very high degree of risk involved in trading. Any information and/or content is intended entirely for research, educational and informational purposes only and does not constitute investment or consultation advice or investment strategy. The information is not tailored to the investment needs of any specific person and therefore does not involve a consideration of any of the investment objectives, financial situation or needs of any viewer that may receive it. Kindly also note that past performance is not a reliable indicator of future results. Actual results may differ materially from those anticipated in forward-looking or past performance statements. We assume no liability as to the accuracy or completeness of any of the information and/or content provided herein and the Company cannot be held responsible for any omission, mistake nor for any loss or damage including without limitation to any loss of profit which may arise from reliance on any information supplied by Everest Fortune Group.

GOLD BEARS GOLD has been showing a bearish. sentiment as July candle hedges around its formation.
Note that this bearish setup is merely a monthly retracement as gold is still bullish on the long term overview .The path of this bearish pullback leads to the 3200's as we're curreently at the 3310's and if we break past 3304 zone, we go for more lower liquidity.
POI- 3304, 3280, 3260
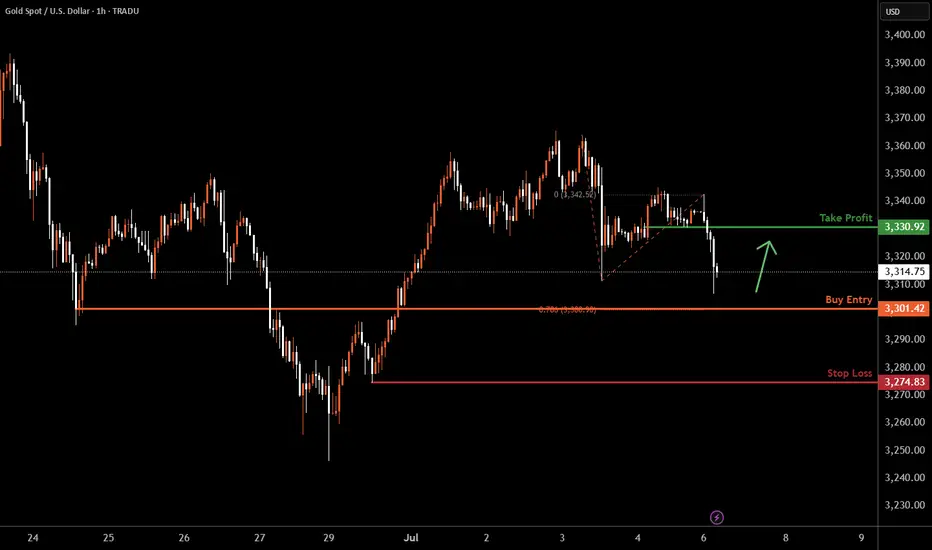
XAUUSD H1 I Bullish Bounce Off Based on the H1 chart analysis, the price is falling toward our buy entry level at 3301.42, a pullback support that aligns with the 78.6% Fib projection.
Our take profit is set at 3330.92, a pullback resistance.
The stop loss is placed at 3274.83, a swing low support.
High Risk Investment Warning
Trading Forex/CFDs on margin carries a high level of risk and may not be suitable for all investors. Leverage can work against you.
Stratos Markets Limited (tradu.com ):
CFDs are complex instruments and come with a high risk of losing money rapidly due to leverage. 63% of retail investor accounts lose money when trading CFDs with this provider. You should consider whether you understand how CFDs work and whether you can afford to take the high risk of losing your money.
Stratos Europe Ltd (tradu.com ):
CFDs are complex instruments and come with a high risk of losing money rapidly due to leverage. 63% of retail investor accounts lose money when trading CFDs with this provider. You should consider whether you understand how CFDs work and whether you can afford to take the high risk of losing your money.
Stratos Global LLC (tradu.com ):
Losses can exceed deposits.
Please be advised that the information presented on TradingView is provided to Tradu (‘Company’, ‘we’) by a third-party provider (‘TFA Global Pte Ltd’). Please be reminded that you are solely responsible for the trading decisions on your account. There is a very high degree of risk involved in trading. Any information and/or content is intended entirely for research, educational and informational purposes only and does not constitute investment or consultation advice or investment strategy. The information is not tailored to the investment needs of any specific person and therefore does not involve a consideration of any of the investment objectives, financial situation or needs of any viewer that may receive it. Kindly also note that past performance is not a reliable indicator of future results. Actual results may differ materially from those anticipated in forward-looking or past performance statements. We assume no liability as to the accuracy or completeness of any of the information and/or content provided herein and the Company cannot be held responsible for any omission, mistake nor for any loss or damage including without limitation to any loss of profit which may arise from reliance on any information supplied by TFA Global Pte Ltd.
The speaker(s) is neither an employee, agent nor representative of Tradu and is therefore acting independently. The opinions given are their own, constitute general market commentary, and do not constitute the opinion or advice of Tradu or any form of personal or investment advice. Tradu neither endorses nor guarantees offerings of third-party speakers, nor is Tradu responsible for the content, veracity or opinions of third-party speakers, presenters or participants.
Will The new Week kick off more bullish Pressure for GOLD?looking for more bullish activity this week but need to sit on my hands for now to see if they establish a Low for the week first. Once we see that and start to see HH's made then we can consider a entry to get in on the move. I cant rush it though. Have to be patient.

GOLD Short From Resistance! Sell!
Hello,Traders!
GOLD is weaker than we
Expected and failed to break
The key horizontal level
Around 3360$ and we are
Now seeing a bearish rejection
So we are locally bearish biased
And we will be expecting a
Further bearish move down
Sell!
Comment and subscribe to help us grow!
Check out other forecasts below too!
Disclosure: I am part of Trade Nation's Influencer program and receive a monthly fee for using their TradingView charts in my analysis.
