GOLD Will Go Higher! Long!
Here is our detailed technical review for GOLD.
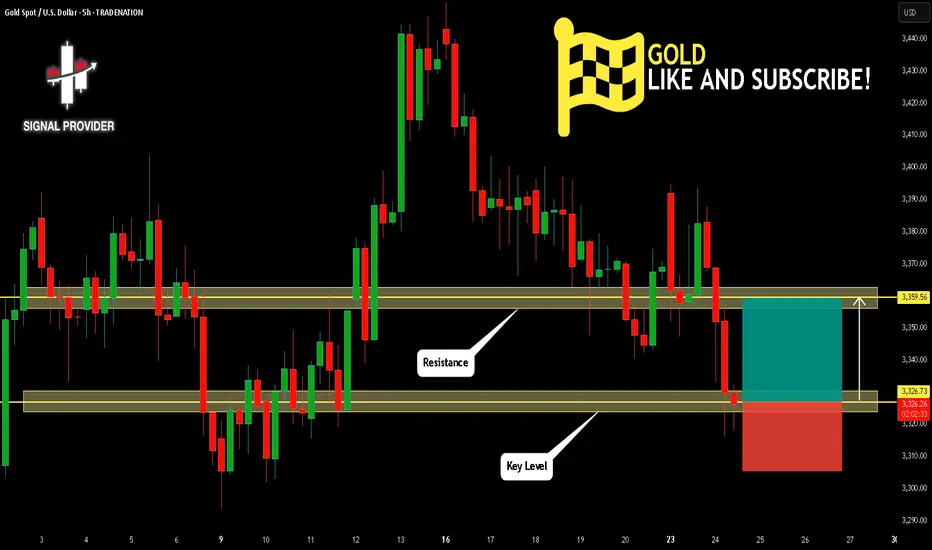
Time Frame: 5h
Current Trend: Bullish
Sentiment: Oversold (based on 7-period RSI)
Forecast: Bullish
The market is trading around a solid horizontal structure 3,326.73.
The above observations make me that the market will inevitably achieve 3,359.56 level.
P.S
We determine oversold/overbought condition with RSI indicator.
When it drops below 30 - the market is considered to be oversold.
When it bounces above 70 - the market is considered to be overbought.
Disclosure: I am part of Trade Nation's Influencer program and receive a monthly fee for using their TradingView charts in my analysis.
Like and subscribe and comment my ideas if you enjoy them!
Gold
Weakness continues, continue to short the bear market📰 Impact of news:
1. Pay attention to Powell's speech in New York
2. Pay attention to geopolitical influence
📈 Market analysis:
Gold opened lower and showed a weak situation. The 1H moving average was arranged downward. In the short term, bears still occupied the main trend. From the 4-hour analysis of gold, the bulls still had repeated resistance before breaking down. Once it breaks down, the market will go further bearish. Pay attention to 3330 below. 3400 is still the key above in the short term. Only by breaking through the bulls can the rebound continue. In terms of operation, high-altitude and low-long are temporarily maintained. Pay attention to the short-term resistance of 3355-3365 above, and the support of 3340-3330 below. Pay attention to the breakthrough! Pay attention to Powell's speech in the New York session.
🏅 Trading strategies:
SELL 3370-3365-3355
TP 3340-3330
BUY 3340-3335-3320
TP 3345-3355-3365
If you agree with this view, or have a better idea, please leave a message in the comment area. I look forward to hearing different voices.
TVC:GOLD FXOPEN:XAUUSD FOREXCOM:XAUUSD FX:XAUUSD OANDA:XAUUSD

XAUUSD: Key Reversal Zone or Deeper Correction Ahead?XAUUSD: Key Reversal Zone or Deeper Correction Ahead?
Gold enters the new trading week balancing on a technical and macroeconomic knife’s edge. After a steep decline, prices are testing critical liquidity zones — just as geopolitical tensions and US economic uncertainty intensify.
🌍 Macro & Fundamental Outlook
📰 Middle East Tensions Rising Again: Israel has signaled potential strikes on Tehran after Iran allegedly violated a ceasefire agreement. Such developments usually support gold as a safe-haven asset.
📊 US Economic Signals Are Mixed: Last week’s PMI and housing data point toward an economic slowdown. If this week’s Core PCE data softens, expectations for a Fed rate cut in September will grow — likely weakening the USD and lifting gold.
🏦 Global Demand for Gold Still Strong: Central banks, particularly from China and India, are continuing their gold accumulation, reinforcing long-term bullish fundamentals.
📉 Technical Analysis (H1–H4)
Gold is still trading within a downward channel but is now approaching a strong demand zone around 3276, a level that has triggered rebounds in the past.
EMA 34 – 89 – 200 indicate bearish momentum, but RSI is showing bullish divergence — hinting at a possible reversal or short-term bounce.
Price action around key support and resistance levels will be crucial this week.
✅ XAUUSD Trade Setup
BUY ZONE: 3278 - 3276 | SL: 3270 | TP: 3282 - 3286 - 3290 - 3294 - 3298 - 3302 - 3305 - 3310
SELL ZONE: 3367 - 3369 | SL: 3375 | TP: 3364 - 3360 - 3356 - 3352 - 3348 - 3344 - 3340 - 3330 - 3320
📌 The Buy Zone lies within a historical liquidity pocket — ideal for a potential rebound if geopolitical risks rise or USD weakens.
📌 The Sell Zone is near a key Fair Value Gap (FVG) and local resistance — strong confluence for short opportunities on a bounce.
🧭 Final Thoughts
XAUUSD is facing a pivotal moment. With both geopolitical events and major US economic data on the horizon, traders should prepare for volatility. Patience, technical discipline, and proper SL/TP management will be key to navigating this environment successfully.

Gold: Breakout and Potential retraceHey Traders, in today's trading session we are monitoring XAUUSD for a selling opportunity around 3,340 zone, Gold was trading in an uptrend and successfully managed to break it out. Currently is in a correction phase in which it is approaching the retrace area at 3,340 support and resistance area.
Trade safe, Joe.

Gold GC1! heading to $3,476 next with a 4.15R long trade TVC:GOLD Gold/ COMEX:GC1! hit the 0.705 fib level right between the 0.618 and 0.786 what I like to call the sweet spot for fibonacci tools. If it misses the 0.618 then the 0.705 is just as good, signals are showing a bottom forming and slowly but sure the rsi is about to cross up over 50, it should pump hard this time
-4.15R trade
-1.5% capital risk
-as soon as gold starts to move, we'll drag our stop loss to or even past break even if it really pops up hard...

XAUUSD Technical Analysis – June 24, 2025On June 24, 2025, XAUUSD (spot gold) continues to face significant bearish pressure after failing to hold above the key resistance zone around 3,383 – 3,400 USD/oz. This area marks a confluence of the 0.5–0.618 Fibonacci retracement levels and a high-volume distribution zone, signaling strong supply dominance in the short term.
Technical Structure and Fibonacci Analysis
- The recent swing high was established at 3,451 USD, completing a bullish wave from the low of 3,223 USD.
- Price was unable to break through the 0.618 Fibonacci retracement at 3,399 USD, leading to a sharp pullback.
- The current structure suggests the formation of a potential head and shoulders pattern, which would confirm if the market breaks below the 3,300 USD support zone.
Key Support and Resistance Levels
- Major resistance: 3,383 – 3,400 USD (Fibonacci 0.5–0.618 zone, high-volume area)
- Immediate support: 3,300 – 3,310 USD (historical reaction zone and 0.618 retracement of the recent bullish leg)
- Deeper support: 3,223 USD – previous swing low and a key target if the bearish trend confirms
Potential Scenarios
- Bearish scenario: If the price sustains below 3,350 USD and decisively breaks 3,300 USD, it may signal the start of a medium-term downtrend, with targets near 3,200 USD or even lower.
- Bullish scenario: A bounce from the 3,300 USD support could trigger a short-term recovery, but traders should closely watch the reaction near the 3,383 – 3,400 USD resistance zone to assess supply pressure.
RSI and Momentum Indicators
- The 14-period RSI is trading below the 50 level and pointing downward, indicating that bearish momentum remains dominant.
- The RSI has also crossed below its moving average, reinforcing the negative outlook.
Ps: XAUUSD is currently in a critical phase as it tests the 3,300 USD support level. A break below this level could confirm further downside and strengthen the bearish trend. Traders are advised to remain cautious, wait for clear price action confirmation, and apply strict risk management as volatility increases.


Hanzo / Gold 15 min - ( most accurate Reversals Levels ) 🔥 Gold – 15 Min Scalping Analysis
⚡️ Objective: Precision Reversal Execution
Time Frame: 15 -Minute Warfare
Entry Mode: Only after verified Reversals
👌Bullish Reversal : 3333
Price must break liquidity with high volume to confirm the move.
👌Bearish Reversal : 3346
Price must break liquidity with high volume to confirm the move.
👌Bearish Reversal : 3396
Price must break liquidity with high volume to confirm the move.
☄️ Hanzo Protocol: Dual-Direction Entry Intel
➕ Zone Activated: Strategic liquidity layer detected — mapped through refined supply/demand mechanics. Volatility now rising. This isn’t noise — this is bait for the untrained. We're not them.
🦸♂️ Tactical Note:
The kill shot only comes after the trap is exposed and volume betrays their position.
5
Hanzo / Gold 15 min - most accurate Reversals ( Zones )

Gold (XAU/USD) Analysis - 24 June 2025📊 4-Hour Chart: Supply & Demand Structure
1. 📐 Market Structure & Bias
Gold has bounced off the $3,340–3,350 demand area multiple times—confirming a strong support structure on the 4H timeframe .
Following this bounce, gold made a higher-low, reinforcing a bullish trend.
Overall bias remains bullish, as long as prices hold above the $3,340 region. A break below this zone may bring deeper correction.
2. 🔍 Demand Zones (Buy Areas)
Zone A – $3,340 to $3,350
Comes with trendline support and prior consolidation.
Volume and price action confirm institutional buying interest.
Zone B – $3,300 to $3,310
A more significant base zone for deeper pullbacks or additional liquidity running.
3. ⚠️ Supply Zones (Sell Areas)
Zone C – $3,380 to $3,390
Shallow zone where recent rallies have stalled—ideal for supply fade strategies.
Zone D – $3,400 to $3,410
Major resistance zone—historical retracement area with institutional selling.
🔍 1-Hour Chart: Intraday Entry Zones (Aligned with 4H Bias)
Below are premium-level intraday buy setups made for quick execution within the bullish structure:
Entry Type Zone ($) Description
1. Buy the Dip 3,340 – 3,345 Touches 4H demand + trendline — watch for bullish rejection wicks or volume pickup.
2. Quick Dip Buy 3,350 – 3,355 Opportunistic entry higher in demand zone — quicker reentries with lighter pullback.
3. Deep Bounce 3,300 – 3,310 For deeper intraday swings only—requires strong confirmation from lower timeframes.
(Optional) Sell Supply Fade 3,380 – 3,390 Aggressive fade only if strong price rejection appears—caution advised.
Tips for Entry Confirmation:
Look for bullish pin bars, engulfing candles, volume confirmation, or trendline bounces within these zones. Only trade entries with clear price action confirmation.

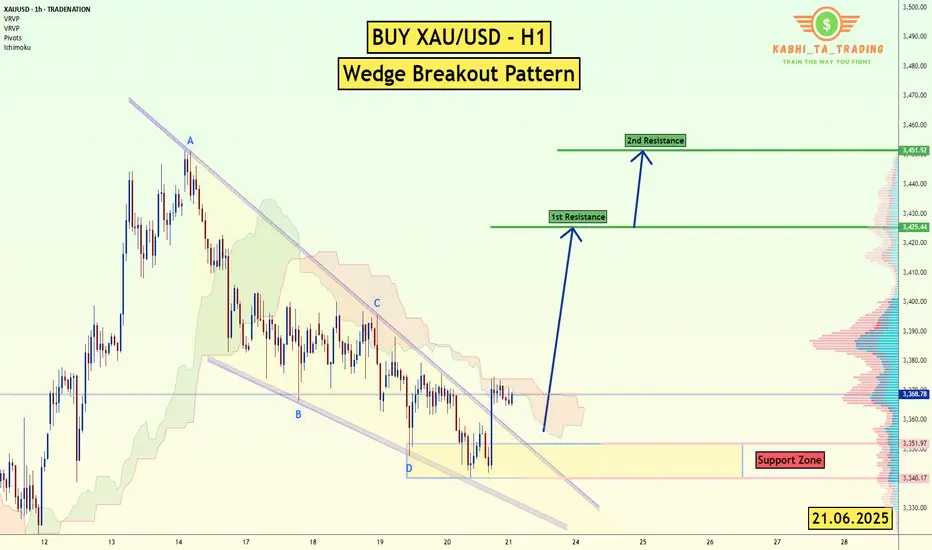
XAU/USD (Gold) - H1 - Wedge Breakout (21.06.2025)The XAU/USD pair on the H1 timeframe presents a Potential Buying Opportunity due to a recent Formation of a Wedge Breakout Pattern. This suggests a shift in momentum towards the upside and a higher likelihood of further advances in the coming Days.
Possible Long Trade:
Entry: Consider Entering A Long Position around Trendline Of The Pattern.
Target Levels:
1st Resistance – 3425
2nd Resistance – 3451
🎁 Please hit the like button and
🎁 Leave a comment to support for My Post !
Your likes and comments are incredibly motivating and will encourage me to share more analysis with you.
Best Regards, KABHI_TA_TRADING
Thank you.
Disclosure: I am part of Trade Nation's Influencer program and receive a monthly fee for using their TradingView charts in my analysis.
XAUUSD Sideways – Breakout Setup FormingGold is currently in a clear consolidation phase on the 4-hour chart, moving within the range of 3,320 to 3,393. After a pullback from the 3,460 peak, the price has repeatedly formed ParSE and ParLE patterns, indicating a strong tug-of-war between buyers and sellers. This suggests that the market is building pressure for a potential breakout in the coming sessions.
Technically, the 3,393 – 3,400 zone remains a key resistance as price has been rejected multiple times there.
Meanwhile, the 3,320 – 3,330 area is holding as solid support, showing strong bullish reactions in previous touches.
The 3,342 – 3,350 range is acting as a neutral zone where price is accumulating before making its next move.
There are two optimal trading strategies at this stage.
The first is range trading: look to buy near 3,320 – 3,330 and target profits at 3,350 – 3,370; conversely, consider selling around 3,390 – 3,393 with take-profit targets back at 3,350 – 3,365. The second is breakout trading: if the price closes a 4H candle above 3,393 with strong volume, it opens up long opportunities targeting 3,420 – 3,445.
On the flip side, a clear break below 3,320 may lead to further downside toward 3,285 – 3,260.
From a macroeconomic perspective, traders should closely monitor US inflation data and upcoming Fed policy signals. Any hints of easing from the Fed could act as a strong bullish catalyst for gold. Additionally, geopolitical developments and USD trends remain crucial as they directly influence safe-haven flows into gold.
In summary, this is a key phase to observe and prepare for decisive action when the market breaks out of consolidation. Patience, disciplined entries, and strict risk management are essential in the current environment.
Follow for daily updates and actionable strategies as the setup unfolds.

Gold Trading Strategy June 23The last two D1 candles have continuously drawn out the wicks. The Sellers may no longer be interested in dominating the market.
Currently, Gold is moving sideways in a wide range. 3345 and 3375 are the two Breakout zones of the gold price in today's trading day. When breaking out of the breakout zone, the price will continue its strong trend. Limit trading against the trend when the price breaks out.
Trading signals may also appear if there is confirmation from the candle that does not break out of this breakout zone.
Resistance and support zones remain the same as last week.
Resistance 3400-3415-3443
Support 3322-3296
Break out: 3375-3345
Recommended good trading signals
SELL 3399-3401 Stoploss 3405
BUY 3322-3320 Stoploss 3306

XAUUSD H1 I Bearish Reversal Based on the H1 chart, the price is approaching our sell entry level at 3359.79, a pullback resistance that aligns with the 38.2% Fib retracement.
Our take profit is set at 3328.25, a pullback support that aligns with the 78.6% Fib retracement and the 127.2% Fib extension.
The stop loss is set at 3377.59, a pullback resistance.
High Risk Investment Warning
Trading Forex/CFDs on margin carries a high level of risk and may not be suitable for all investors. Leverage can work against you.
Stratos Markets Limited (tradu.com ):
CFDs are complex instruments and come with a high risk of losing money rapidly due to leverage. 63% of retail investor accounts lose money when trading CFDs with this provider. You should consider whether you understand how CFDs work and whether you can afford to take the high risk of losing your money.
Stratos Europe Ltd (tradu.com ):
CFDs are complex instruments and come with a high risk of losing money rapidly due to leverage. 63% of retail investor accounts lose money when trading CFDs with this provider. You should consider whether you understand how CFDs work and whether you can afford to take the high risk of losing your money.
Stratos Global LLC (tradu.com ):
Losses can exceed deposits.
Please be advised that the information presented on TradingView is provided to Tradu (‘Company’, ‘we’) by a third-party provider (‘TFA Global Pte Ltd’). Please be reminded that you are solely responsible for the trading decisions on your account. There is a very high degree of risk involved in trading. Any information and/or content is intended entirely for research, educational and informational purposes only and does not constitute investment or consultation advice or investment strategy. The information is not tailored to the investment needs of any specific person and therefore does not involve a consideration of any of the investment objectives, financial situation or needs of any viewer that may receive it. Kindly also note that past performance is not a reliable indicator of future results. Actual results may differ materially from those anticipated in forward-looking or past performance statements. We assume no liability as to the accuracy or completeness of any of the information and/or content provided herein and the Company cannot be held responsible for any omission, mistake nor for any loss or damage including without limitation to any loss of profit which may arise from reliance on any information supplied by TFA Global Pte Ltd.
The speaker(s) is neither an employee, agent nor representative of Tradu and is therefore acting independently. The opinions given are their own, constitute general market commentary, and do not constitute the opinion or advice of Tradu or any form of personal or investment advice. Tradu neither endorses nor guarantees offerings of third-party speakers, nor is Tradu responsible for the content, veracity or opinions of third-party speakers, presenters or participants.

Gold eased slightly as Middle East risk receded
Safe-haven demand for gold eased slightly as geopolitical risks in the Middle East subsided. However, the downside was limited by a weaker dollar. Market sentiment around a potential escalation in regional tensions also softened, particularly as the likelihood of a Strait of Hormuz blockade declined despite preemptive US strikes. Looking ahead, gold prices may exhibit heightened volatility depending on Fed Chair Powell’s upcoming congressional testimony and the release of the May PCE inflation data.
XAUUSD failed to reenter the ascending channel and retreated below 3360. EMA21 is narrowing its gap with EMA78, signaling a potential shift toward a bearish structure. If XAUUSD breaks below the support at 3320, the price may decline further to 3280. Conversely, if XAUUSD reenters the channel, the price could gain upward momentum toward the resistance at 3400.

Gold: Breakout and Potential Retrace!!Hey Traders, in today's trading session we are monitoring XAUUSD for a selling opportunity around 3,390 zone, Gold was trading in an uptrend and successfully managed to break it out. Currently is in a correction phase in which it is approaching the retrace area at 3,390 support and resistance zone.
Trade safe, Joe.

Have we made a Low for the Week yet on Gold???Im looking for price to sweep Monday's low before deciding what it wants to do. I want to see everything line up inside of the killzone to take advantage. Just have to be patient. We still have a lil time so sitting on my hands until it all looks clear to proceed with the move.

Hanzo / Gold 15 min - 0 draw down tactical Reversal Entrys🔥 Gold – 15 Min Scalping Analysis
⚡️ Objective: Precision Reversal Execution
Time Frame: 15 -Minute Warfare
Entry Mode: Only after verified Reversals
👌Bullish Reversal : 3375
Price must break liquidity with high volume to confirm the move.
👌Bearish Reversal : 3390
Price must break liquidity with high volume to confirm the move.
👌Bearish Reversal : 3396
Price must break liquidity with high volume to confirm the move.
☄️ Hanzo Protocol: Dual-Direction Entry Intel
➕ Zone Activated: Strategic liquidity layer detected — mapped through refined supply/demand mechanics. Volatility now rising. This isn’t noise — this is bait for the untrained. We're not them.
🦸♂️ Tactical Note:
The kill shot only comes after the trap is exposed and volume betrays their position.

SPY/QQQ Plan Your Trade For 6-23 : Afternoon UpdateWhat happened to the CRUSH pattern?
Everyone wants to know why the CRUSH pattern didn't show up today. Well, I keep telling all of you these SPY Cycle Patterns are based on GANN, Tesla and Fibonacci price structures. They do not take into consideration news, global events, or anything outside of PRICE.
They are predictive - meaning they attempt to predict potential price shapes/patterns weeks, months, and years in advance.
The markets, obviously, are seeking some normalcy after the Iran conflict. I thought the CRUSH pattern would have been a perfect fit for today - but obviously the markets didn't agree.
If you have been following my videos, you know I keep saying the US stock market is acting as a global hedge for risks. Traders are pouring capital into the US stock market as a way to avoid global risk factors.
Traders are also pouring capital into Gold/Silver. Demand for physical metals is through the roof right now.
Time will tell if my Excess Phase Peak pattern plays out as I expect or if we rally to new ATHs.
Obviously, this sideways rollover topping pattern could present a breakaway in either direction.
Again, my patterns are not correlated based on news or other events. They are strictly price-based.
Get some...
#trading #research #investing #tradingalgos #tradingsignals #cycles #fibonacci #elliotwave #modelingsystems #stocks #bitcoin #btcusd #cryptos #spy #gold #nq #investing #trading #spytrading #spymarket #tradingmarket #stockmarket #silver

Gold bottoms out and tests resistance, long positions at night📰 Impact of news:
1. Bowman hinted at a July rate cut
2. Fed Governor Kugler and FOMC permanent voting member and New York Fed President Williams hosted the "Fed Listening" event.
📈 Market analysis:
Gold will maintain a short-term volatile trend. Although the United States intervenes in the conflict between Iran and Israel, the geopolitical situation will affect the market trend to a certain extent. However, the remarks of Federal Reserve Board member Bowman hinting at a rate cut in July have eased market volatility to a certain extent. Gold maintains a narrow range of fluctuations at the 4H level, and the technical pattern is gradually adjusted. The K-line stands firmly on the short-term moving average. The short-term trend shows that it is necessary to observe the second opportunity for pull-up after the confirmation of the retracement. At the hourly level, the short-term moving average diverges upward, and the short-term volatile and strong pattern is maintained. In the evening, pay attention to the upper resistance area of 3395-3405, focus on the suppression of the 3405 line, pay attention to 3375-3365 below, and further pay attention to the 3345 support line if it breaks through.
🏅 Trading strategies:
SELL 3385-3395-3405
TP 3370-3365-3345
BUY 3375-3365-3355
TP 3390-3400-3405
If you agree with this view, or have a better idea, please leave a message in the comment area. I look forward to hearing different voices.
TVC:GOLD FXOPEN:XAUUSD FOREXCOM:XAUUSD FX:XAUUSD OANDA:XAUUSD

XAUUSD (GOLD), bullish setup activeXAUUSD (GOLD), bullish setup active. 1H timeframe has given me the confirmation for a bullish setup. If you want to have higher R:R, wait for the pullback to be completed and then enter around 3351-56. Also look at my yesterdays setup in 5-15m timeframe.
Cheers
XAU/USD Double Bottom Breakout Bullish Momentum Incoming!XAU/USD Double Bottom Breakout 💥 | 🚀 Bullish Momentum Incoming!
Analysis:
🟡 Double Bottom Pattern: Two clear lows have formed around the $3,340 support, signaling a potential reversal.
🟦 Accumulation Zone: The price consolidated in a range, indicating strong buying interest before the breakout.
🟣 Bullish Momentum: Recent aggressive bullish candles show strong buying pressure.
📈 Breakout & Retest Zone: If the price holds above $3,370, a bullish continuation toward $3,409 and possibly $3,445 is expected.
🧭 Target Area: Marked with a blue box, the upside potential is clearly projected.
Conclusion:
A successful retest of the breakout level may lead to a strong bullish run. Keep an eye on $3,370 as the pivot zone. 🎯

Bullish Momentum Expected Next Week, With Geopolitical tensions 🌍 Fundamental Catalyst – Middle East Tensions Driving Gold Higher
Gold is gaining strong safe-haven demand due to escalating geopolitical tensions between Iran and Israel, further amplified by a recent U.S. military strike on Iran. These developments have sparked fears of a broader regional conflict, pushing investors to seek the stability that gold traditionally offers during periods of uncertainty. We may again see an All-Time New High of gold because things are getting closer to a new WWIII, which we never want, so these tensions will boost the gold prices.
Key Fundamentals Supporting Bullish Gold:
🛡️ Safe-Haven Demand: Gold historically rallies during military conflict and political instability.
💥 Risk-Off Sentiment: Equities may weaken while commodities like gold attract capital inflow.
🔐 Market Uncertainty: Any further escalation will likely trigger another wave of buying pressure in gold.
With this level of geopolitical uncertainty, we may soon witness a new all-time high (ATH) in gold prices. If further military actions occur, we could potentially see an explosive move of 600 to 1000 pips as early as tomorrow.
At the same time, while we analyze the market and act accordingly, our hope remains that peace will soon prevail. These conflicts are deeply painful and harmful to humanity. Let’s all hope for de-escalation and the return of stability — not just for the markets, but for the well-being of people across the world.
Technical Overview:
> The chart shows a descending channel pattern, which is still valid, but the thing is now gold will follow fundamental, not technical levels.
> Don't need to wait for the breakout of this channel, you can enter to buy a trade from here once the market opens.
> Regarding the targets we mentioned below.
>> TP1: 3400 <<
>> Final Target Zone: 3445–3450 <<
: NOTE
Given the geopolitical backdrop and historical behavior of gold in such environments, a bullish trend is expected in the coming sessions. Traders and investors should monitor developments closely, as any further escalation may act as a strong catalyst for gold to surge.
Thank you traders, for reading our idea. If any of you want to suggest something, must comment here as we can explore more. If you agreed with my idea, so must support us for more updates.

GOLD Growth Ahead! Buy!
Hello,Traders!
GOLD is trading along the
Rising support and is already
Making a bullish rebound so
As we are bullish biased due
To the strong uptrend we
Will be expecting a further
Bullish move up on Gold
Buy!
Comment and subscribe to help us grow!
Check out other forecasts below too!
Disclosure: I am part of Trade Nation's Influencer program and receive a monthly fee for using their TradingView charts in my analysis.
