Bullish continuation?The Gold (XAU/USD) is falling towards the pivot and could bounce to the 1st resistance.
Pivot: 3,390.13
1st Support: 3,356.66
1st Resistance: 3,491.05
Risk Warning:
Trading Forex and CFDs carries a high level of risk to your capital and you should only trade with money you can afford to lose. Trading Forex and CFDs may not be suitable for all investors, so please ensure that you fully understand the risks involved and seek independent advice if necessary.
Disclaimer:
The above opinions given constitute general market commentary, and do not constitute the opinion or advice of IC Markets or any form of personal or investment advice.
Any opinions, news, research, analyses, prices, other information, or links to third-party sites contained on this website are provided on an "as-is" basis, are intended only to be informative, is not an advice nor a recommendation, nor research, or a record of our trading prices, or an offer of, or solicitation for a transaction in any financial instrument and thus should not be treated as such. The information provided does not involve any specific investment objectives, financial situation and needs of any specific person who may receive it. Please be aware, that past performance is not a reliable indicator of future performance and/or results. Past Performance or Forward-looking scenarios based upon the reasonable beliefs of the third-party provider are not a guarantee of future performance. Actual results may differ materially from those anticipated in forward-looking or past performance statements. IC Markets makes no representation or warranty and assumes no liability as to the accuracy or completeness of the information provided, nor any loss arising from any investment based on a recommendation, forecast or any information supplied by any third-party.
Gold

DeGRAM | GOLD above the resistance📊 Technical Analysis
● Five successive rebounds (green arrows) from the 4-month rising‐channel base at 3 293 keep the primary up-trend intact while turning the former wedge roof into support.
● Price is compressing inside a 4-day ascending triangle whose ceiling sits at 3 366; a break projects 1 : 1 to the March top/outer channel rail at 3 435.
💡 Fundamental Analysis
● FXStreet notes bullion ETF holdings rose for a second week as softer US PMI prices dragged 2-yr real yields back to early-July lows, trimming the dollar bid.
✨ Summary
Buy 3 345-3 355; triangle breakout >3 366 opens 3 389 then 3 435. Long bias void on an H4 close below 3 293.
-------------------
Share your opinion in the comments and support the idea with a like. Thanks for your support!

Hellena | GOLD (4H): LONG to resistance area of 3498 (Wave 3).The price continues to move in a bullish direction, and I believe that now is the time to pay attention to the medium-term wave “3.” It is actively developing, and I believe that the target should be set at the maximum area of the higher-order wave “3” — the resistance area of 3498.
This is the nearest target, which carries significant weight.
Overall, the upward five-wave movement is developing according to the old scenario.
Manage your capital correctly and competently! Only enter trades based on reliable patterns!

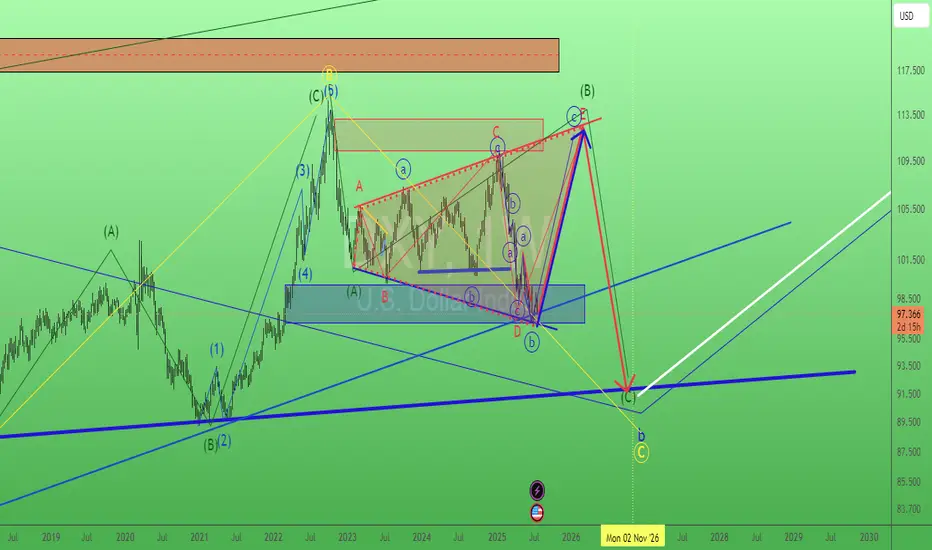
Dollar. When King of cash said : I'm still the king. 23/July/25DXY. when Dollar = the king of cash said : "Cash is King!" AND as a King of cash I'm RECLAIMING MY CROWN.. What will happen to "all equities market? e.g Stocks, Gold or even Bitcoin?
Gold Surges to Five-Week High Amid Growing UncertaintyHello everyone! Let’s take a closer look at XAUUSD today.
Gold prices have rallied strongly, breaking above the 3,400 USD level and currently hovering around 3,420 USD — up 1.2% in the past 24 hours, equivalent to a gain of 34.7 USD.
This surge marks the highest level in five weeks, driven by heightened uncertainty surrounding U.S. President Donald Trump's looming August 1 tariff deadline. With tensions rising, gold is likely to remain on an upward trajectory. The immediate resistance stands at 3,420 USD per ounce, while support is seen near 3,350 USD.
Investors are also eyeing next week’s Federal Reserve policy meeting, where rates are expected to stay unchanged — but a rate cut could come as early as October. Meanwhile, the U.S. dollar continues to face renewed pressure heading into August, a factor that may further boost gold’s appeal.
Do you think gold will keep rising from here? Drop your thoughts in the comments — and good luck with your trades!

People don't like the truth! Let's be honest, people don't like honesty. They prefer ideas that affirm their own beliefs.
When I read articles and posts from newer traders, it's often from a place of "all in" diamond hands and the notion that things go up forever.
I've been a trader for over 25 years now, and the game isn't about making a quick buck, it's about making money over and over again. This got me thinking, the issue is when you deal with a small account you require leverage, small timeframes and of course the "shit" or bust mindset. If you lose a thousand dollars, $10,000 even $100,000 - what does it matter? That's no different than a game of poker in Vegas.
The idea of being 80% in drawdown, is alien to me. The idea of one trade and one win is also a crazy notion.
Instead of playing with the future, there is an easier way to work. This isn't about slow and boring, it's about psychology and discipline. 10% returns on a million-dollar account isn't all that difficult. Instead of aiming for 300x returns on an alt coin (due to the account size being tiny) You can make less of a percentage gain with a larger account size.
In terms of psychology - the word " HOPE " is used, way too often, it's used when you hope a stock or the price of Bitcoin goes up, it's used when you hope the position comes back in your favour, it's used when you want your 10,000 bucks to double.
This isn't trading, it's gambling.
The truth is, it's not the winners that make you a good trader. It's the way you deal with the losses.
Once you learn proper risk management, a downtrend in a market move is a 1-2% loss coupled with a new opportunity to reverse the bias.
As a disciplined trader, the game is played differently.
Let's assume you don't have $100k spare - prop firms are a great option, OPM = other people's money.
Remove the risk and increase the leverage, all whilst trading with discipline.
The market goes through many phases, cycles and crashes.
You don't always need something as catastrophic to take place, but if you are all in on a position. You need to understand that losses can be severe and long-lasting.
When everyone sees an oasis in the desert, it's often a mirage.
You only have to look at the Japanese lesson in 1989, when the Nikkei was unstoppable-until it wasn't. For that short space in time, everyone was a day trader, housewives to taxi drivers.
Everyone's a genius in a Bull market.
Then comes the crash. The recovery time on that crash?
34-years!!!
I have covered several aspects of psychology here on TradingView;
When it comes to trading, if you are able to keep playing. It's a worthwhile game. If you are gambling, it's a game whereby the house often wins.
Right now, stocks are worth more than their earnings. Gold is up near all-time highs, crypto, indices the same.
All I am saying is if you are all in. Be careful!
Disclaimer
This idea does not constitute as financial advice. It is for educational purposes only, our principal trader has over 25 years' experience in stocks, ETF's, and Forex. Hence each trade setup might have different hold times, entry or exit conditions, and will vary from the post/idea shared here. You can use the information from this post to make your own trading plan for the instrument discussed. Trading carries a risk; a high percentage of retail traders lose money. Please keep this in mind when entering any trade. Stay safe.
GOLD Will Go Up! Buy!
Please, check our technical outlook for GOLD.
Time Frame: 2h
Current Trend: Bullish
Sentiment: Oversold (based on 7-period RSI)
Forecast: Bullish
The market is trading around a solid horizontal structure 3,427.91.
The above observations make me that the market will inevitably achieve 3,460.54 level.
P.S
We determine oversold/overbought condition with RSI indicator.
When it drops below 30 - the market is considered to be oversold.
When it bounces above 70 - the market is considered to be overbought.
Disclosure: I am part of Trade Nation's Influencer program and receive a monthly fee for using their TradingView charts in my analysis.
Like and subscribe and comment my ideas if you enjoy them!

Euro Surges as Dollar Falters Amid Political TensionsThe EUR/USD pair is experiencing a strong rally, breaking above the 1.1760 level — its highest point in two weeks as of Tuesday. This sharp move not only signals the Euro’s recovery strength but also highlights the impact of heavy selling pressure on the US dollar.
The driving force? Ongoing trade tensions, coupled with rising uncertainty surrounding the escalating feud between President Trump and Fed Chair Jerome Powell, are shaking investor confidence in the stability of US monetary policy.
As a result, the dollar is losing its safe-haven appeal, paving the way for EUR/USD to climb higher. If this bullish momentum holds, the next key target for the pair could be around 1.1800.

Gold Approaches Key Resistance Within Bullish Channel – BreakoutCurrent Price Action:
Gold is currently trading at around $3,442, nearing the upper boundary of a well-defined upward-sloping channel. The latest candle shows bullish momentum with a strong close near the daily high, indicating continued buying pressure.
Key Observations:
Trend Structure:
The overall trend remains bullish, with higher highs and higher lows clearly visible.
Price is approaching a critical Fibonacci extension level (1.618), which could act as resistance.
Channel Dynamics:
Price is within a parallel ascending channel.
It is currently testing the upper channel boundary, which may either lead to a breakout or a rejection.
Support & Resistance Levels:
Immediate resistance: $3,442 (Fibonacci extension & channel resistance).
Major resistance: $3,500 (ATH - All-Time High).
Key support levels: $3,275, $3,114, and $3,057 (marked horizontal levels, also align with Fibonacci retracement zones).
Rejection Zones:
Historically, price has reversed at similar extension levels.
If rejection occurs, a pullback to the midline or lower channel boundary is likely.
Forecast:
If the current bullish momentum continues and price breaks above the channel resistance, we could see a move toward the ATH at $3,500 and potentially higher.
However, if the price faces resistance and fails to break above $3,442–$3,450, a short-term pullback to around $3,275–$3,114 is possible. This would offer a healthier correction within the broader uptrend.
The bullish structure remains valid as long as price stays above $3,057.
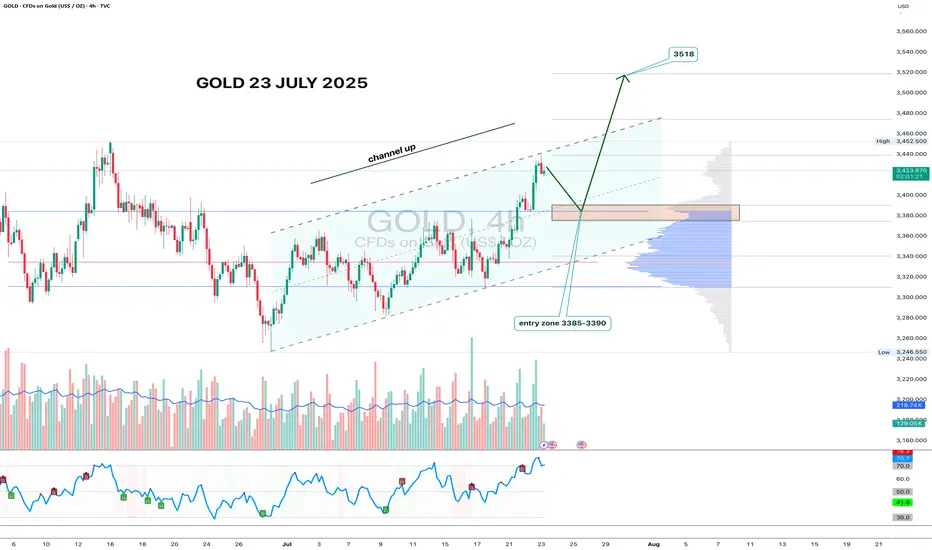
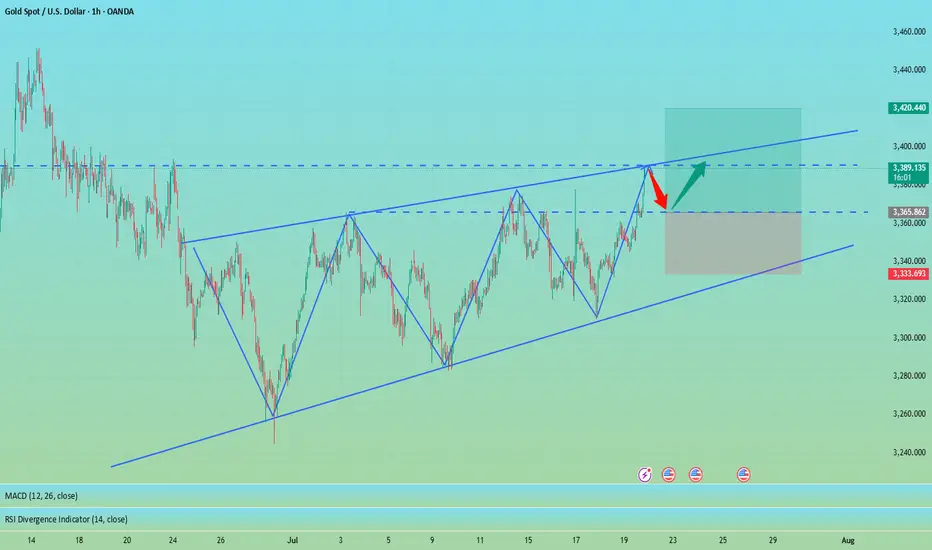
Gold 4H - channel breakout, looking for 3518 nextGold has formed a clean ascending channel on the 4H chart, broke out above resistance, and is now pulling back into the 3385–3390 zone. This area aligns with volume clusters - a perfect entry zone for bulls waiting on the sidelines.
If price holds this zone and prints a reversal candle with volume, the upside target remains at 3518 - the 1.618 Fibonacci extension and historical resistance. Volume increased during the breakout move, confirming interest. RSI still has room to go higher, supporting the bullish continuation.
Fundamentally, gold remains a safe-haven asset amid geopolitical tension, USD weakness, and potential Fed easing. Central bank accumulation further supports the bullish case.
Tactical setup:
— Entry zone: 3385–3390
— Trigger: candle confirmation + volume
— Target: 3518
— Invalidation: break below 3360 without buyer volume
If the plan plays out — gold might shine bright while bears squint in disbelief.
Gold (XAU/USD) 4‑Hour Technical Analysis: July 23, 2025Gold continues to trade in a bullish structure on the 4‑hour timeframe, holding above $3,420 after a steady advance from early July lows. At the time of writing, XAU/USD stands at $3,423.8, confirmed by Investing.com. This analysis employs a comprehensive blend of globally‑recognized technical tools — ranging from price action and classical indicators to institutional concepts — to identify the most probable trading zones and a high‑conviction setup.
Current Price Structure and Trend
On the 4‑hour chart, gold maintains a clear bullish market structure, consistently printing higher highs and higher lows since early July. The current price action unfolds within a well‑defined rising channel, bounded approximately between $3,400 on the lower side and $3,450 on the upper. Twice in the past week, price has tested and respected the channel’s lower boundary, confirming its validity.
Support and resistance levels are evident: immediate support lies at $3,410, coinciding with the 50% Fibonacci retracement of the July impulse wave. Below that, $3,390–$3,395 offers secondary support at the channel’s base and a longer‑term Fibonacci cluster. Resistance is concentrated at $3,445–$3,450, aligning with the channel top, upper Bollinger Band, and prior swing highs, while a secondary ceiling may emerge near $3,468–$3,470, corresponding to an Elliott Wave 3 extension target.
Candlestick, Volume, and Momentum
Recent price action has been supported by bullish candlestick formations. Notably, a strong bullish engulfing bar formed at $3,410 earlier this week, affirming institutional demand at that level. Volume profile analysis shows the heaviest transaction cluster between $3,410–$3,420, confirming this area as a smart money accumulation zone.
Volume‑weighted average price (VWAP ) currently runs near $3,418, with price holding above it, reflecting institutional positioning in favor of the bulls. Momentum indicators support the trend: MACD on the 4‑hour has just crossed bullish, RSI prints at 60 — strong but not overbought — and ADX climbs to 24, indicating a trend strengthening phase.
Indicators, Patterns, and Institutional Concepts
Trend indicators reinforce the bullish view. The 50‑ and 100‑period exponential moving averages converge around $3,415–$3,420, providing dynamic support. Ichimoku analysis shows price well above the Kumo (cloud), with a bullish Tenkan‑Kijun configuration. Bollinger Bands are widening, and price is leaning toward the upper band — a classic signal of volatility expansion in trend direction.
Classical and harmonic patterns offer further evidence. The current consolidation resembles a bull flag, suggesting continuation. Elliott Wave analysis points to a third wave in progress, with an upside projection into the $3,448–$3,468 area. Smart money concepts confirm that the recent break above $3,420 constituted a bullish break of structure (BOS), with price now retracing into a favorable gap (FVG) and a 4‑hour bullish order block anchored around $3,410–$3,415.
Liquidity and stop‑clusters likely sit above $3,445 and $3,468, making these logical targets for bullish campaigns.
Market Context and Sentiment
Gold is benefiting from a softening US dollar and a drop in volatility indexes. Seasonal tendencies also lean bullish into late summer. Sentiment on professional platforms aligns with this view: TradingView top authors and FXStreet analysts favor buying pullbacks into $3,410–$3,415 and targeting $3,450–$3,468, which harmonizes with this analysis. No major divergence from consensus is noted, adding to confidence.
Identified Trading Zones
Two strong buy zones emerge on the 4‑hour chart. The most immediate and highest‑confidence zone is $3,410–$3,415, supported by channel support, Fibonacci retracement, VWAP, moving averages, and an order block. Below this lies a secondary buy zone at $3,390–$3,395, tied to deeper Fibonacci support and the rising channel’s lower boundary.
On the other hand, clear sell zones are defined at $3,445–$3,450, where upper channel resistance, Bollinger bands, and prior highs converge, and a secondary zone at $3,468–$3,470, aligned with wave targets and round‑number psychological resistance. These areas are likely to attract profit‑taking and potential reversals.
The Golden Setup
Among the findings, one trade stands out as the highest‑conviction setup:
A long position at $3,415, with a stop loss at $3,405 and a take profit at $3,450.
This trade is backed by strong confluence: price pulling back into a well‑defined demand zone ($3,410–$3,415) that features order block support, Fibonacci retracement, VWAP alignment, EMA cluster support, and a rising channel boundary. The target sits just below the first significant resistance band ($3,445–$3,450), offering a favorable risk‑to‑reward ratio. The confidence level on this setup is rated at 8/10, given the multi‑method alignment and consistent sentiment from professional sources.
Summary Table
Category Levels / Details
Buy Zones $3,410–$3,415, $3,390–$3,395
Sell Zones $3,445–$3,450, $3,468–$3,470
Golden Setup Long @ $3,415 / SL $3,405 / TP $3,450 (Confidence: 8/10)
In conclusion, gold maintains a constructive technical outlook on the 4‑hour timeframe. The prevailing bullish structure, reinforced by classical and institutional methodologies, supports a continuation toward the $3,450–$3,468 region. The suggested Golden Setup provides a disciplined, high‑probability entry at a key inflection zone, consistent with both technical evidence and prevailing market sentiment.

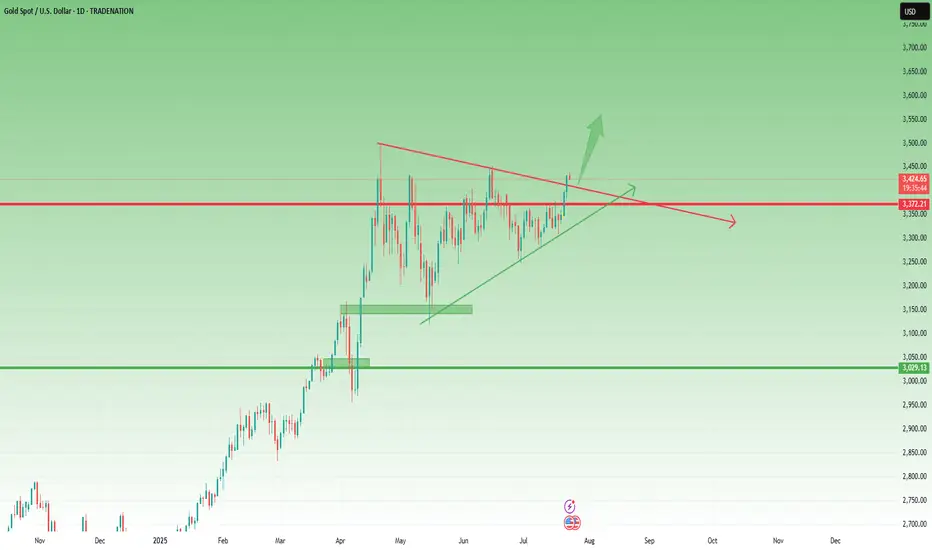
Gold Update – Strong Breaks, Strong BullsYesterday, after the break of the key 3370 resistance, Gold corrected slightly toward 3383, then consolidated briefly in that area. From there, it launched into a strong new leg up, closing the day once more near the highs, around 3430.
📌 What’s important here is that the price did not even come back to retest the broken resistance — now turned support. Combined with the strong daily close near the high of the range, this gives us a clear message:
➡️ Bulls are in full control.
________________________________________
🔍 This Week – Three Key Breaks
So far this week, Gold has delivered three major breakouts:
• ✅ A clean breakout from the box consolidation that kept price stuck and indecisive last week
• ✅ A decisive break above the 3400 psychological figure
• ✅ A breakout above the symmetrical triangle resistance, which had been forming since late April
Each of these is significant on its own. Together, they suggest a shift toward a more aggressive bullish scenario.
________________________________________
🔮 What’s Next?
All these breakouts point to the potential for more gains ahead.
In fact, the next logical step could be an attempt to mark a new All-Time High.
My view remains the same:
Buying dips remains the strategy of choice, with a focus on the 3400 zone as a key support area, and a swing target around 3500.
Disclosure: I am part of TradeNation's Influencer program and receive a monthly fee for using their TradingView charts in my analyses and educational articles.
GOLD SHORT FROM RESISTANCE|
✅GOLD is set to retest a
Strong resistance level above at 3450$
After trading in an uptrend for some time
Which makes a bearish pullback a likely scenario
With the target being a local support below at 3414$
SHORT🔥
✅Like and subscribe to never miss a new idea!✅
Disclosure: I am part of Trade Nation's Influencer program and receive a monthly fee for using their TradingView charts in my analysis.

Gold Market Update – Key Zones for the Next MoveHey gold lovers! As the NY session wraps up, the chart is a painting of tension: gold boxed tight between major structure — and the real action is only about to start.
Bias:
At this stage, gold remains in a short-term bullish structure as long as price holds above the 3421–3428 decision area. A break and hold below this zone would shift the bias to neutral or bearish for the next sessions.
🎨 What’s drawn on the chart?
🟥 3472–3478 Supply Zone:
The ceiling, still untouched — this is where every failed breakout has left a “scar” on the chart. If we finally reach this zone, watch for wicks, rejections, or that rare, clean breakout candle. Sellers and patient bulls are both watching for “the drawing” to be complete.
🟩 3383–3390 Demand Zone:
The real floor. On your chart, it’s the base built by strong bounces and those long wicks buyers left behind. If price falls here, it’s not just a line: it’s a zone where new rallies are born and the market might “paint” a major reversal.
🟦 The Middle is Just Noise
Price is coiling, painting confusion in the center — but the edge zones are where structure and opportunity live.
Don’t be the trader who gets erased in the chop. Let price draw the story at supply or demand before making your move.
💡 Plan for Tonight
Wait for price to reach 🟥 supply or 🟩 demand.
Watch the “drawing” — will you see a wick, a rejection, or a true breakout?
Only trade once the story is clear at the edges.
Drop your best chart art or scenario below!
like🚀🚀🚀and 🔔 Follow for real structure updates & daily market stories — let’s turn trading into a masterpiece, together.
GoldFxMinds

GOLD Will Keep Growing!
HI,Traders !
#GOLD keep trading in
An uptrend along the rising support
So as the pair is approaching
A the support we will be
Expecting a bullish rebound !
Comment and subscribe to help us grow !

Gold 1H Intra-Day Chart 22.07.2025Option 1: Gold rejects from CMP & drops towards $3,260.
Option 2: Gold buyers hold around $3,260 and push price back up.
Which scenario do you find more likely?

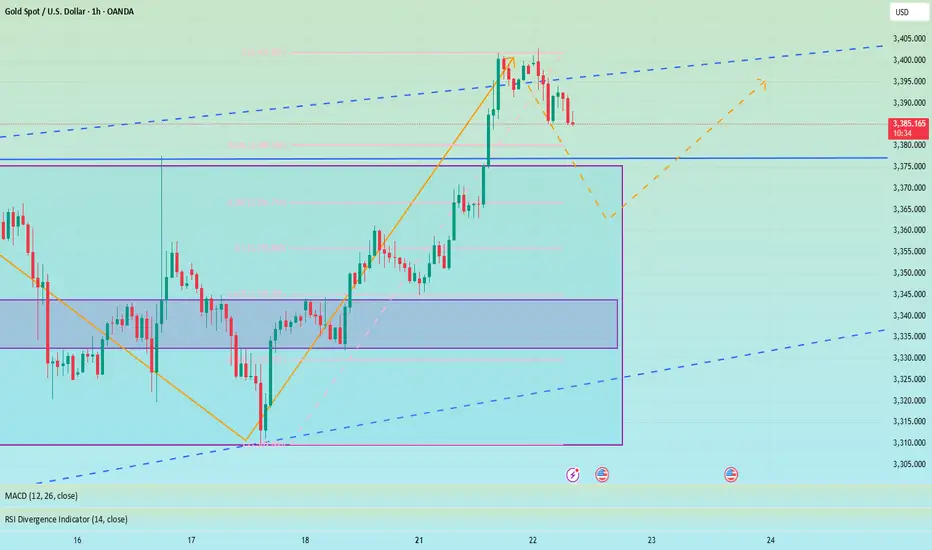
GOLD → Correction before continuing the rally to 3450FX:XAUUSD updates its local maximum to 3401.5 and enters a consolidation phase ahead of news. The dollar correction gives speculators a chance...
The price of gold is correcting from 3400. The reason is profit-taking ahead of Powell's speech at 12:30 GMT and waiting for clarity on US trade negotiations with the EU and Japan before August 1.
Gold remains sensitive to the progress of negotiations and the dynamics of the dollar, which is weakening amid political uncertainty, declining yields, and pressure on the Fed from Trump.
Technically, after exiting consolidation and retesting 3400, the price is entering a local consolidation phase.
Focus on key levels: 3401, 3382, 3375. A false breakdown of support could trigger a recovery phase.
Resistance levels: 3402, 3393
Support levels: 3382, 3375, 3362.75
The distribution phase has been halted by resistance, and the price has moved into a countertrend correction due to uncertainty. Markets are waiting for positive signals from the Fed. Local and global trends are bullish, which may support the price overall...
Best regards, R. Linda!

Bulls are still the main theme, 3400 is not the high point📰 News information:
1. Fed Chairman Powell delivers a welcome speech at a regulatory conference
2. The tariff deadline is approaching
📈 Technical Analysis:
Today's opening high reached around 3402, and did not effectively break through the upper resistance of 3405-3415. As I said yesterday, a decline and return to the moving average is an inevitable result. The tariff issue is still there, with the deadline on August 1, and the daily MACD indicator still shows a golden cross. The general direction of short-term bullishness has not changed, but from a technical point of view, gold still has room to fall to correct the overbought part.
Below the day, we first focus on the top and bottom conversion position of 3377-3375. As time goes by, the 4H middle track will probably resonate with the 50% position of the Fibonacci line at 3355, which is also a good long position I expect. Therefore, if the price falls back to 3380-3375 for the first time during the day, you can consider going long. If the price continues to fall, pay attention to the second opportunity to go long at 3355, with the target at 3390-3410.
🎯 Trading Points:
BUY 3380-3375
TP 3390-3410
BUY 3360-3350
TP 3370-3380
In addition to investment, life also includes poetry, distant places, and Allen. Facing the market is actually facing yourself, correcting your shortcomings, facing your mistakes, and exercising strict self-discipline. I share free trading strategies and analysis ideas every day for reference by brothers. I hope my analysis can help you.
TVC:GOLD PEPPERSTONE:XAUUSD FOREXCOM:XAUUSD FX:XAUUSD OANDA:XAUUSD FXOPEN:XAUUSD
GOLD - SHORT TO $2,800 (UPDATE)Price has pushed up as expected back into the $3,400 zone, where we had a lot of pending liquidity that needed to be wiped out. Now that liquidity is collected I am patiently waiting for some form of 'distribution price action' to play out, before I consider selling. Until then I'm sitting on the sideline.
If Gold takes out Wave 2 high ($3,451) then bearish structure is invalidated & we can start looking at buy trades.

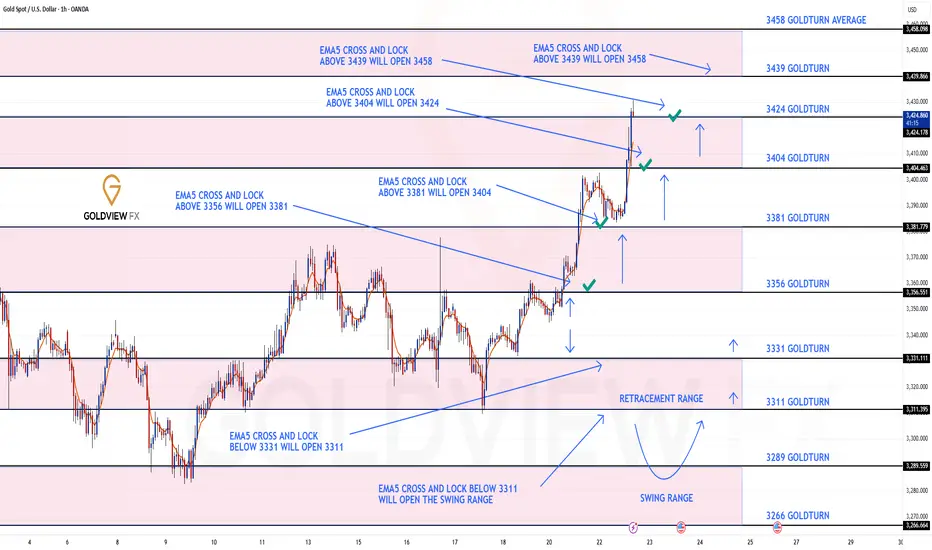
GOLD ROUTE MAP UPDATEHey Everyone,
Another great day on the charts today with our analysis playing out perfectly like we analysed.
As a follow up from yesterday, after completing 3356, we noted that EMA5 cross and lock opening 3404, which was hit perfectly today as analysed. With strong momentum, we also cleared the 3424 Bullish Target.
We will now look for an EMA5 lock above 3424 to open the next bullish level at 3439. Alternatively, a rejection here may see lower Goldtruns tested for support and bounce.
We will keep the above in mind when taking buys from dips. Our updated levels and weighted levels will allow us to track the movement down and then catch bounces up.
We will continue to buy dips using our support levels, taking 20 to 40 pips. As stated before, each of our level structures gives 20 to 40 pip bounces, which is enough for a nice entry and exit. If you backtest the levels we’ve shared every week for the past 24 months, you’ll see how effectively they were used to trade with or against short/mid-term swings and trends.
The swing ranges give bigger bounces than our weighted levels, that’s the difference between the two.
BULLISH TARGET
3356 - DONE
EMA5 CROSS AND LOCK ABOVE 3356 WILL OPEN THE FOLLOWING BULLISH TARGETS
3381 - DONE
EMA5 CROSS AND LOCK ABOVE 3381 WILL OPEN THE FOLLOWING BULLISH TARGET
3404 - DONE
EMA5 CROSS AND LOCK ABOVE 3404 WILL OPEN THE FOLLOWING BULLISH TARGET
3424 - DONE
EMA5 CROSS AND LOCK ABOVE 3424 WILL OPEN THE FOLLOWING BULLISH TARGET
3458
BEARISH TARGETS
3331
EMA5 CROSS AND LOCK BELOW 3331 WILL OPEN THE FOLLOWING BEARISH TARGET
3311
EMA5 CROSS AND LOCK BELOW 3311 WILL OPEN THE SWING RANGE
3289
3266
As always, we will keep you all updated with regular updates throughout the week and how we manage the active ideas and setups. Thank you all for your likes, comments and follows, we really appreciate it!
Mr Gold
GoldViewFX
Don't chase the bullish trend,wait for the short position layout#XAUUSD
The tariff policy recently announced by the US government is undoubtedly the focus of the current gold market. Trump also tied the tariffs to the trial of former Brazilian President Jair Bolsonaro, adding to policy uncertainty. ⚖️
The implementation of the tariff policy may push up commodity prices, thereby exacerbating inflationary pressure, which is both an opportunity and a challenge for gold📊. On the one hand, rising inflation expectations may enhance the attractiveness of gold as an anti-inflation asset; on the other hand, the strengthening of the US dollar and US Treasury yields may offset this positive. 💡
At present, the lower support has moved up to the 3375-3365 area, where a top-bottom conversion position will be formed. The upper short-term resistance level is 3387-3393, the previous high. If the market touches this for the first time, you can try to see a double top fall.
🚀SELL 3385-3390
🚀TP 3365-3355
GOLD: Bearish Continuation & Short Trade
GOLD
- Classic bearish formation
- Our team expects fall
SUGGESTED TRADE:
Swing Trade
Sell GOLD
Entry Level -3422.5
Sl - 3428.1
Tp - 3408.4
Our Risk - 1%
Start protection of your profits from lower levels
Disclosure: I am part of Trade Nation's Influencer program and receive a monthly fee for using their TradingView charts in my analysis.
❤️ Please, support our work with like & comment! ❤️

XAU/USD | Get Ready for Another Bullrun, $3500 is Coming!By analyzing the gold chart on the 4-hour timeframe, we can see that on Friday, the price finally closed at $3350. After the market opened today, we saw an initial correction down to $3339 (exactly as expected), followed by another strong bullish wave, pushing gold above $3400 just moments ago. If the price stabilizes below $3398 within the next 4 hours, I expect a potential rejection toward $3388 and $3377. However, if gold holds above $3400, the next target will be $3409. Key demand zones are $3365–$3375, and levels $3355, $3344, and $3336.
Please support me with your likes and comments to motivate me to share more analysis with you and share your opinion about the possible trend of this chart with me !
Best Regards , Arman Shaban
