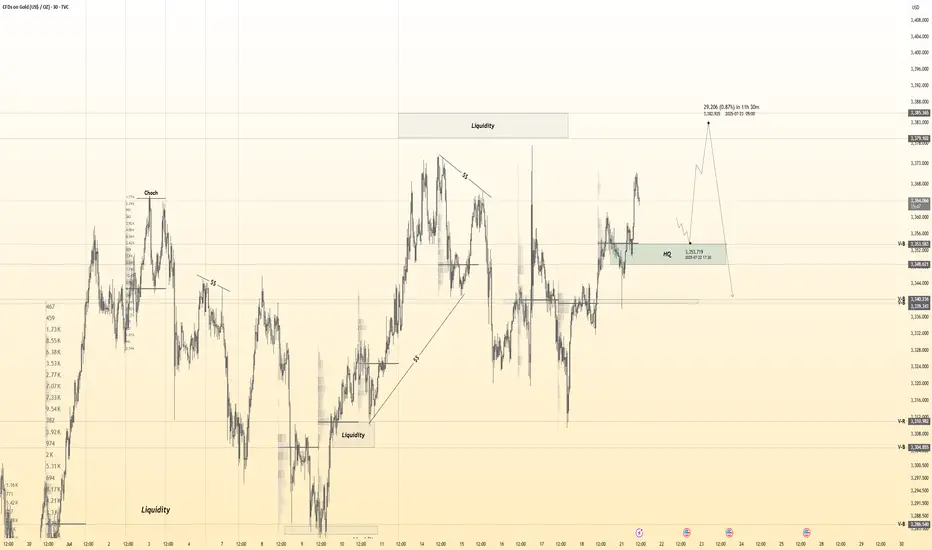
XAU/USD Start July 20251. i start after XAU/USD break previous High and correction (fibbo 32.0) respected. based on elliot wave strategy we can targeting end of wave 3 at 3353 area and than correction wave 4 (target at fibbo 32.0 - 50.0). after target correction, continue wave 5 at target 3403 area.
2. fundamentally speaking, new months new quarter. there ins't new catalist and sentiment. Macro Economic this week focus on labour market at US and FED projection to cut rate.
3. War at Iran and Israel, Russia and Ukraine, India and Pakistan, Trade War case, etc,.
4. Will be update
Gold

GOLD - Price can rise to resistance line of wedgeHi guys, this is my overview for XAUUSD, feel free to check it and write your feedback in comments👊
The price has been trading within a large ascending wedge for an extended period.
The asset found significant support near the lower trendline of this formation, specifically in the 3205 - 3187 price area.
From that support, the price initiated a sustained upward movement back towards the upper parts of the structure.
Currently, XAU is facing a key horizontal resistance zone located between 3375 and 3390 points.
The price is actively attempting to break through this area, which has historically served as a critical pivot point.
I expect that once the price firmly breaks and consolidates above this resistance, it will continue its growth towards the upper boundary of the wedge, targeting the $3475 level.
If this post is useful to you, you can support me with like/boost and advice in comments❤️
Disclaimer: As part of ThinkMarkets’ Influencer Program, I am sponsored to share and publish their charts in my analysis.

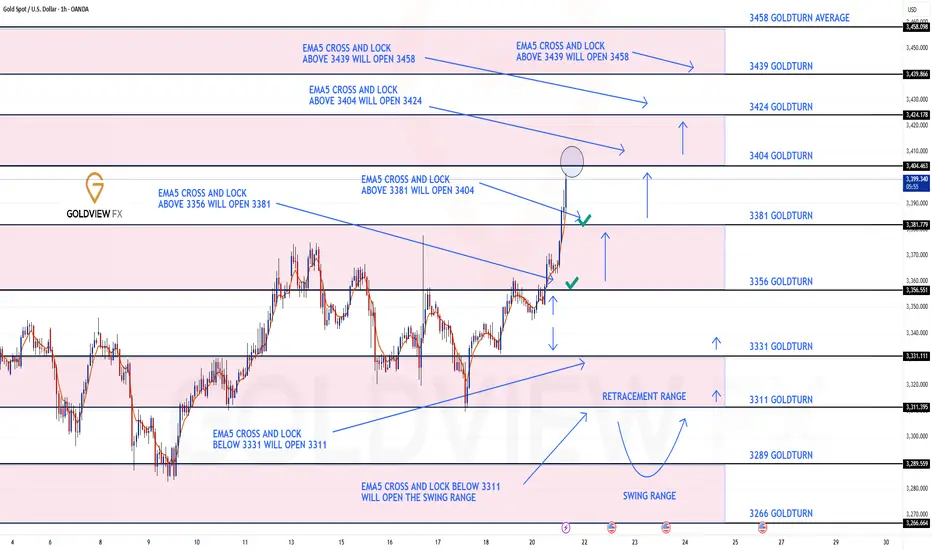
GOLD ROUTE MAP UPDATEHey Everyone,
Great start to the week with our chart idea playing out, as analysed.
We started with our Bullish target 3356 hit, followed with ema5 cross and lock above 3356 opening 3381. This was also hit perfectly completing this target. We now have a further ema5 cross and lock above 3381 leaving 3404 open with already a nice push up, just short of the full gap.
We will keep the above in mind when taking buys from dips. Our updated levels and weighted levels will allow us to track the movement down and then catch bounces up.
We will continue to buy dips using our support levels taking 20 to 40 pips. As stated before each of our level structures give 20 to 40 pip bounces, which is enough for a nice entry and exit. If you back test the levels we shared every week for the past 24 months, you can see how effectively they were used to trade with or against short/mid term swings and trends.
The swing range give bigger bounces then our weighted levels that's the difference between weighted levels and swing ranges.
BULLISH TARGET
3356 - DONE
EMA5 CROSS AND LOCK ABOVE 3356 WILL OPEN THE FOLLOWING BULLISH TARGETS
3381 - DONE
EMA5 CROSS AND LOCK ABOVE 3381 WILL OPEN THE FOLLOWING BULLISH TARGET
3404
EMA5 CROSS AND LOCK ABOVE 3404 WILL OPEN THE FOLLOWING BULLISH TARGET
3424
EMA5 CROSS AND LOCK ABOVE 3424 WILL OPEN THE FOLLOWING BULLISH TARGET
3458
BEARISH TARGETS
3331
EMA5 CROSS AND LOCK BELOW 3331 WILL OPEN THE FOLLOWING BEARISH TARGET
3311
EMA5 CROSS AND LOCK BELOW 3311 WILL OPEN THE SWING RANGE
3289
3266
As always, we will keep you all updated with regular updates throughout the week and how we manage the active ideas and setups. Thank you all for your likes, comments and follows, we really appreciate it!
Mr Gold
GoldViewFX
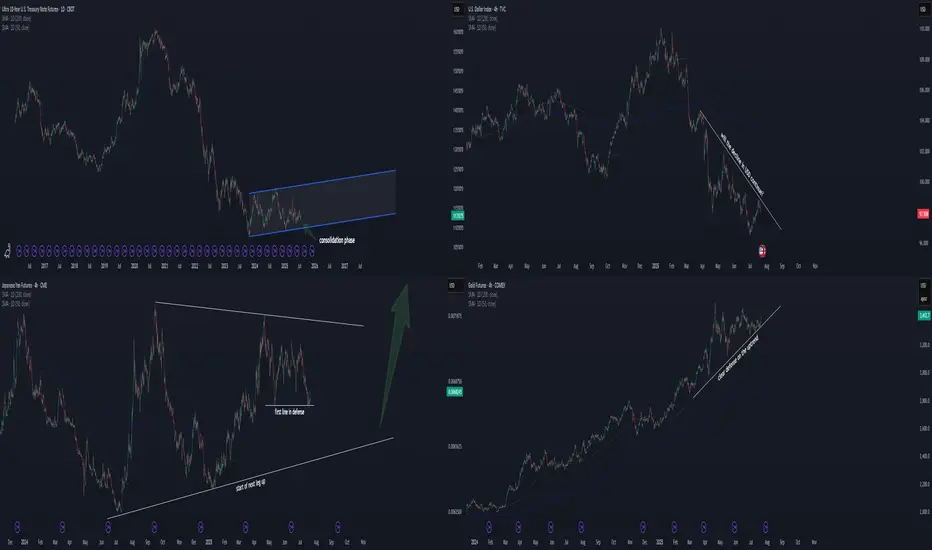
Time to invest in JPY and TN/bond? Hello FX/futures traders!
Market is at a pivotal point. Not in a bad way, but in a good way!
Chart 2: TVC:DXY
Let's start with the US Dollar . A declining USD was just well defended the last few days. If this is true, then the stock up, dollar down scenario is likely to continue. This is good for equities.
Chart 4: COMEX:GC1!
Gold defends its trendline as well. It seems like gold wants to go up more. A raising gold in the current scenario suggests declining USD TVC:DXY . This isn't always true, but we have to look at the current correlation and makes the best educated guess on this.
Logical Deduction 1:
Chart 1: CBOT:TN1!
A consolidation phase has been going on for almost 2 years now. This is definitely
a good sign to long bond, as at least we know the likely bottom for stoploss. With dollar leaning down and gold up, I think TN will defend its current level around 110-113.
Logical Deduction 2:
Chart 3: CME:6J1!
JPY is defending its first key level since May 2025. A wedge is forming, and the breakout is about to take place later this year. Likely the consolidation phase will take more time (with likelihood to breakout to either side). But with a declining USD side by side, I consider now a good entry point to long JPY with controllable risk.
Let me know what you think!
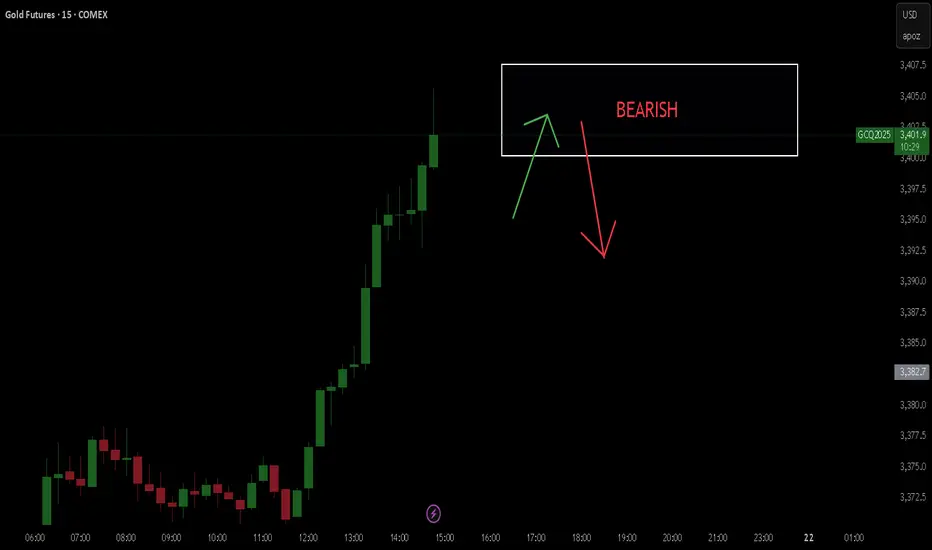
High probability that gold will fallHello,
I hope you're doing well. Here, I'm sharing my analysis of the gold futures market.
Now I see that there's a good chance, about 80%, that it will fall.
Gold 30Min Engaged ( Bullish & Bearish Reversal Entry's Detected————-
➕ Objective: Precision Volume Execution
Time Frame: 30-Minute Warfare
Entry Protocol: Only after volume-verified breakout
🩸 Bullish reversal : 3354.5
🩸 Bearish Reversal : 3379
➗ Hanzo Protocol: Volume-Tiered Entry Authority
➕ Zone Activated: Dynamic market pressure detected.
The level isn’t just price — it’s a memory of where they moved size.
Volume is rising beneath the surface — not noise, but preparation.
🔥 Tactical Note:
We wait for the energy signature — when volume betrays intention.
The trap gets set. The weak follow. We execute.
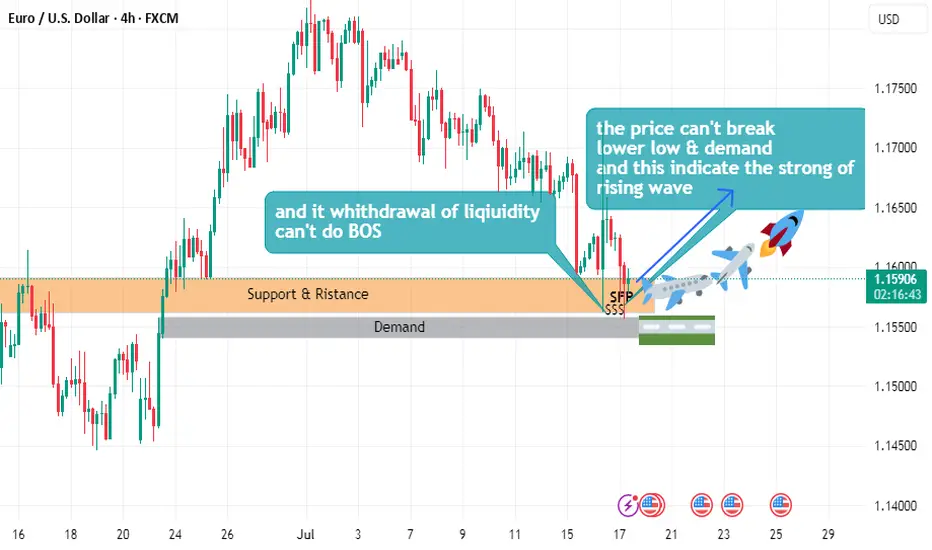
EURUSD buy plane Setuphello
the price can't break lower low
and can't demand
and this indicate the strong of uptrend wave
and it withdrawal of liquidity
and can't do beak of structure
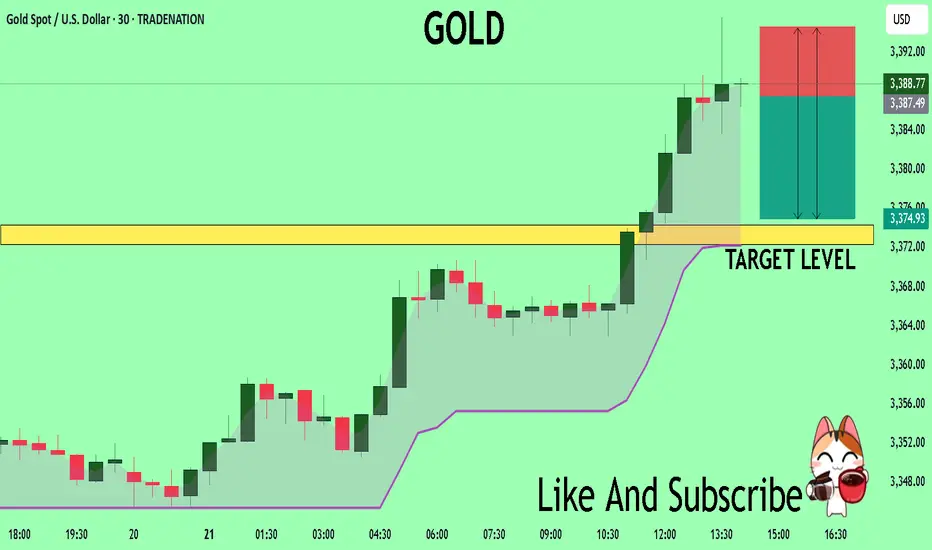
GOLD Technical Analysis! SELL!
My dear subscribers,
This is my opinion on the GOLD next move:
The instrument tests an important psychological level 3387.7
Bias - Bearish
Technical Indicators: Supper Trend gives a precise Bearish signal, while Pivot Point HL predicts price changes and potential reversals in the market.
Target - 3374.3
My Stop Loss - 3394.5
About Used Indicators:
On the subsequent day, trading above the pivot point is thought to indicate ongoing bullish sentiment, while trading below the pivot point indicates bearish sentiment.
Disclosure: I am part of Trade Nation's Influencer program and receive a monthly fee for using their TradingView charts in my analysis.
———————————
WISH YOU ALL LUCK
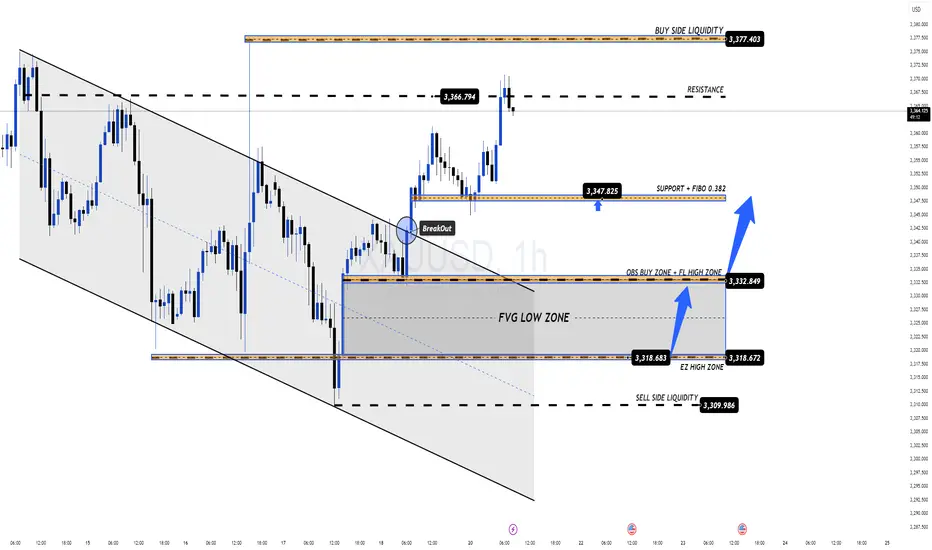
QUIET START TO THE WEEK, WATCH OUT FOR KEY RESISTANCE!🔔 GOLD PLAN 21/07 – QUIET START TO THE WEEK, WATCH OUT FOR KEY RESISTANCE!
🌍 Market Overview
Gold has bounced back strongly following a brief pullback late last week. The move comes as geopolitical tensions and global conflicts continue to escalate.
While this week may not feature high-impact economic data, macroeconomic risks and global uncertainty remain the primary drivers of price action.
📊 Technical Outlook
Price is currently approaching a strong resistance zone between 3377–3380, which aligns with a Buy Side Liquidity region.
💡 Sellers may step in here to push the price lower, aiming to fill FVG zones (Fair Value Gaps) left behind during the previous bullish rally.
⚠️ Entering SELL positions at this level is risky — only act upon confirmed reversal signals (candlestick rejection or volume-based confirmation).
🎯 Trade Setup
🟢 BUY ZONE: 3331 – 3329
Stop Loss: 3325
Take Profits:
3335 → 3340 → 3344 → 3348 → 3352 → 3358 → 3364 → 3370
🔴 SELL ZONE (confirmation required): 3377 – 3379
Stop Loss: 3383
Take Profits:
3372 → 3368 → 3364 → 3360 → 3350
📌 Key Notes
The 3347 zone acts as short-term support for bulls. If this level breaks, a move toward lower FVG liquidity zones becomes more likely.
Keep an eye on EU session volume for clearer short-term direction and better trade timing.
✅ Final Thoughts
Discipline is key. Stick to your TP/SL strategy to manage risk effectively during early-week volatility.
🛡️ Wishing everyone a successful start to the week. Stay patient, stay focused.
GOD BLESS ALL!
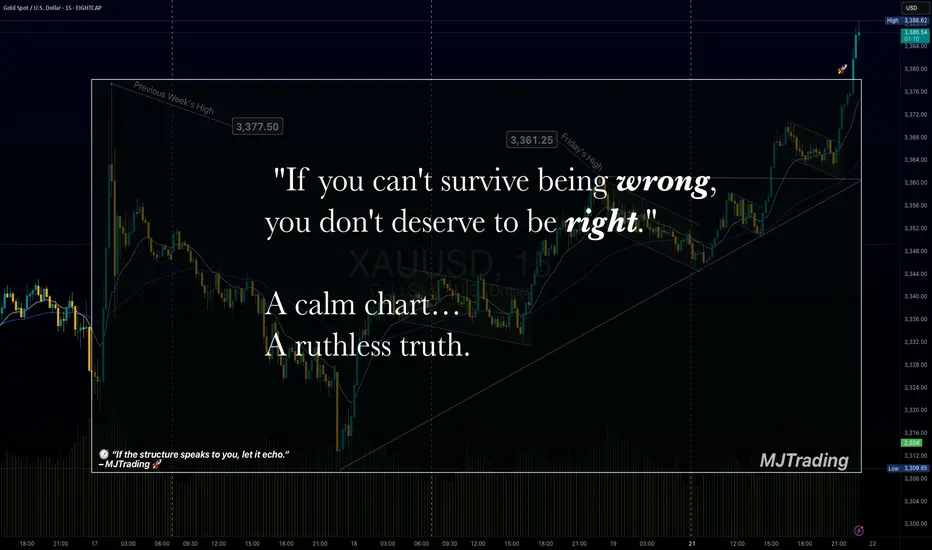
Survive first. Thrive later.🧠 Trading Psychology x Risk Management
"If you can't survive being wrong, you don't deserve to be right."
💬 A calm chart…
A ruthless truth.
Most traders obsess over being right.
But the market only rewards those who manage being wrong.
Risk control isn’t just technical — it’s emotional.
Survive first. Thrive later.
— MJTrading
Psychology Always Matters:
Click on them for notes in the caption...
#MJTrading #ChartDesigner #TradingPsychology #RiskManagement #MindfulTrading #CapitalPreservation #SmartMoney #XAUUSD #ForexDiscipline #15minChart #GoldAnalysis #MentalEdge #Gold
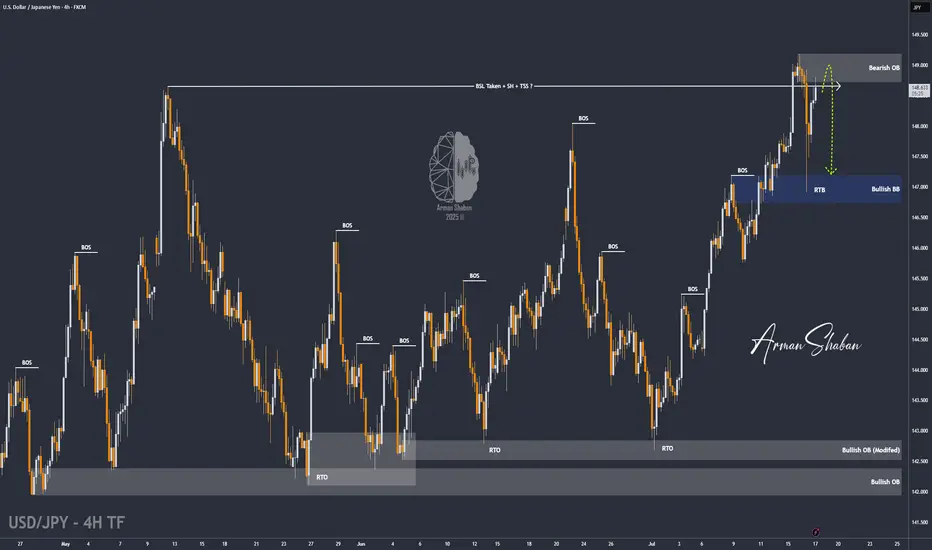
USD/JPY : Get Ready for another Fall ! (READ THE CAPTION)By analyzing the USDJPY chart on the 4-hour timeframe, we can see that after our last daily timeframe analysis, the price started its rally from the 144 zone and, as expected, hit all three targets at 145.5, 147.35, and 148.65, delivering over 500 pips in returns — even reaching as high as 149.2! Once the price broke above 148.65 and swept the liquidity above this level, it faced selling pressure and dropped to 146.9. Currently trading around 148.65, if USDJPY manages to hold below the supply zone between 148.65 and 149.2, we can expect further downside movement. This analysis will be updated with your support!
THE DAILY ANALYSIS :
Please support me with your likes and comments to motivate me to share more analysis with you and share your opinion about the possible trend of this chart with me !
Best Regards , Arman Shaban
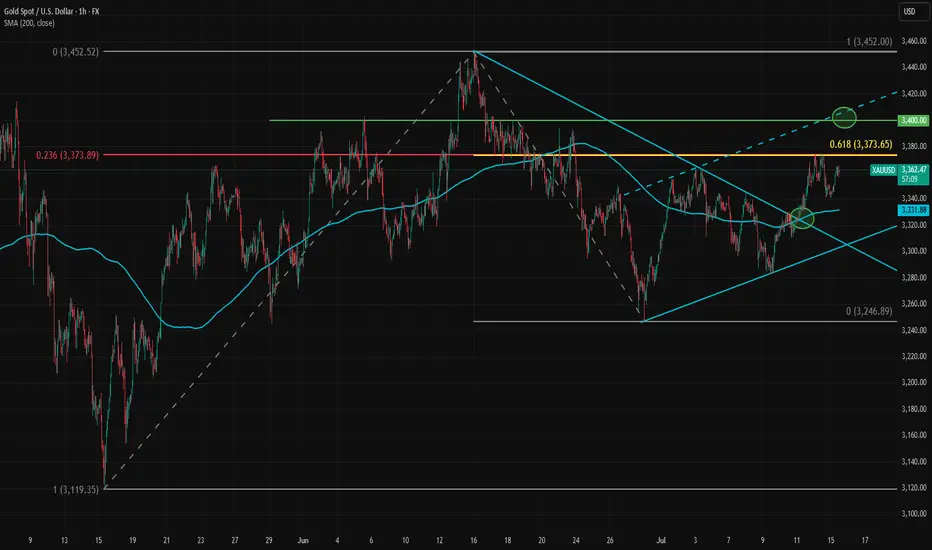
Two Retracement Levels Converge, Creating Strong ResistanceGold is hovering near 3370 amid a wave of tariff-related headlines over the past few days. After Trump’s threats toward Mexico, Canada, and the European Union, gold has been pushing toward higher levels. The latest warning came over the weekend, targeting both the EU and Mexico with a 30% tariff unless an agreement is reached by August 1. The EU trade commissioner described the proposed tariff as “absolutely unacceptable.”
So far, markets remain calm due to ongoing delays in the actual implementation of these tariffs. However, that could change as the August deadline approaches. Trump may view it as politically damaging to issue repeated threats without following through.
Meanwhile, the EU is preparing countermeasures in case the deadline passes without an agreement and the U.S. enforces the 30% tariffs. The EU’s plan targets $84 billion worth of goods, including automobiles, aircraft, wine, bourbon, agricultural and chemical products, plastics, and electrical equipment. The outcome of U.S.-EU negotiations could be a major driver for gold in July.
Another factor to watch is the recent surge in bond yields in Japan. The rising probability that Japan’s ruling coalition may lose its majority is creating uncertainty, especially since opposition parties favor tax cuts and increased government spending. Higher Japanese yields could trigger a reversal in carry trade flows, which might also push up yields in Europe and the U.S.
Gold pushed higher, breaking out of the bearish trendline drawn from the July 13 top, and reached the 3370–3375 area. So far, this zone has provided strong short-term resistance. The 3374 is significant, as it marks both the 23.6% Fibonacci retracement level of the May–June rally and the 61.8% retracement of the June 16–30 pullback. This confluence could make it a key pivot point for gold this week.
If this level is broken, gold could gain further momentum and move above 3400. On the downside, 3342 has been acting as a support level for now.
GOLD: Pre-market PrepSo for gold today, I see a lot of confluence around the prior week's high, prior day's high, and the prior value area high. We also had a poor high last Friday that we've clearly broken through.
Right now, we're in balance up above these key levels. My immediate plan is to continue going long up to the prior month's value area high. If we get a pullback to the confluence area, I want to take it up from there.
If the market opens and we accept back into the previous area, I'll be looking to go short from that area and take it down. That's my main analysis for gold today. Let’s trade smart, peace!

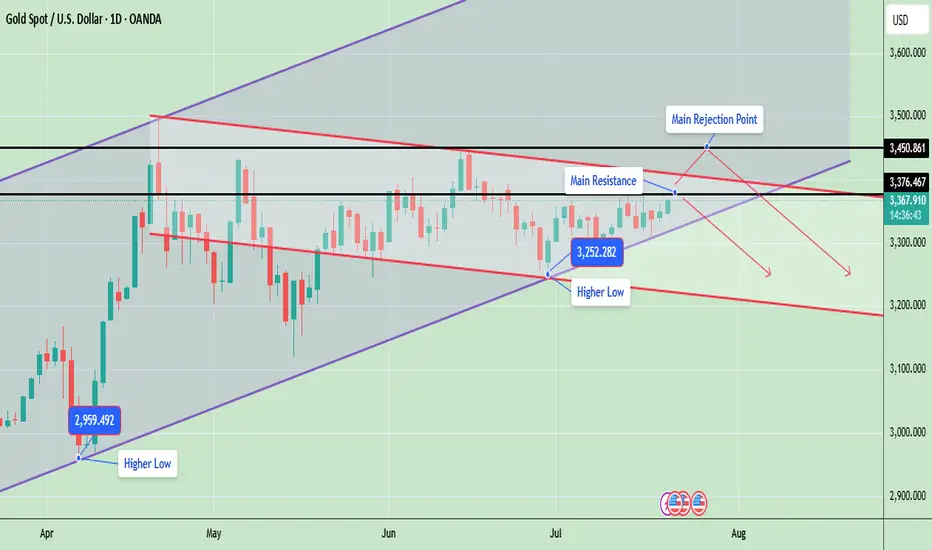
Gold Price Update – Testing Key ResistanceGold is currently trading around 3367, showing strong bullish momentum as it continues to form higher lows, which indicates an ongoing uptrend. The market structure is developing inside a rising wedge pattern, with the price consistently respecting both the ascending support and resistance lines.
Gold is now testing a key resistance zone between 3376 and 3450, an area that previously acted as a major supply zone and caused sharp rejections. A successful breakout and close above 3450 will likely confirm a bullish continuation and may open the door for a rally toward 3500 and possibly 3580. However, if gold fails to break this level, it could retrace back to the 3300 or 3250 support zones, especially if a rejection candle forms in the daily timeframe.
📊 Key Technical Highlights:
- Price has approached the upper resistance boundary of the wedge.
- Daily candle is bullish, indicating strong buying momentum.
- However, unless price closes above 3,376–3,450, there’s still a risk of rejection from the top channel and a pullback toward 3,300–3,250.
🔑 Key levels to watch:
- Gold is currently trading around $3,367, just below a crucial horizontal resistance at $3,376
- A strong breakout above $3,376, and especially above $3,450, could open the door for further bullish movement toward the $3,500–$3,600 range, following the upper trendline of the ascending channel.
- On the downside, if price fails to hold the higher low at $3,252, a drop toward $3,200 or even $3,100 is possible aligning with the downward red trendline.
- The structure remains bullish overall, as price is still making higher lows and staying within the rising channel
📊 Weekly Gold Chart Analysis
Gold is currently trading around $3,368, forming a symmetrical triangle pattern on the weekly timeframe. This pattern typically indicates a period of consolidation before a potential breakout in either direction. The price is getting squeezed between lower highs and higher lows, which is a sign of decreasing volatility and approaching breakout.
🔑 Key Technical Insights:
- ✅ Current Structure: Price has been consolidating within a triangle since April 2025 after a strong upward move. It is now near the apex of the triangle, suggesting a breakout is imminent—most likely in the next 1–2 weeks.
🔼 Bullish Breakout:
- If gold breaks above the triangle resistance (~$3,385–$3,393), it could trigger a sharp rally.
- Upside targets post-breakout: $3,450, $3,500, $3,600+ (if momentum continues)
🔽 Bearish Breakdown:
- A break below the triangle support (~$3,335–$3,325) may lead to a deeper correction.
- Downside targets post-breakdown: $3,285, $3,200
- Possibly $3,100–$3,050 if bearish sentiment intensifies
📉 Volume Drop:
As typical with triangles, volume has likely decreased, signaling indecision. Once volume returns, it will likely confirm the breakout direction.
Note
Please risk management in trading is a Key so use your money accordingly. If you like the idea then please like and boost. Thank you and Good Luck!
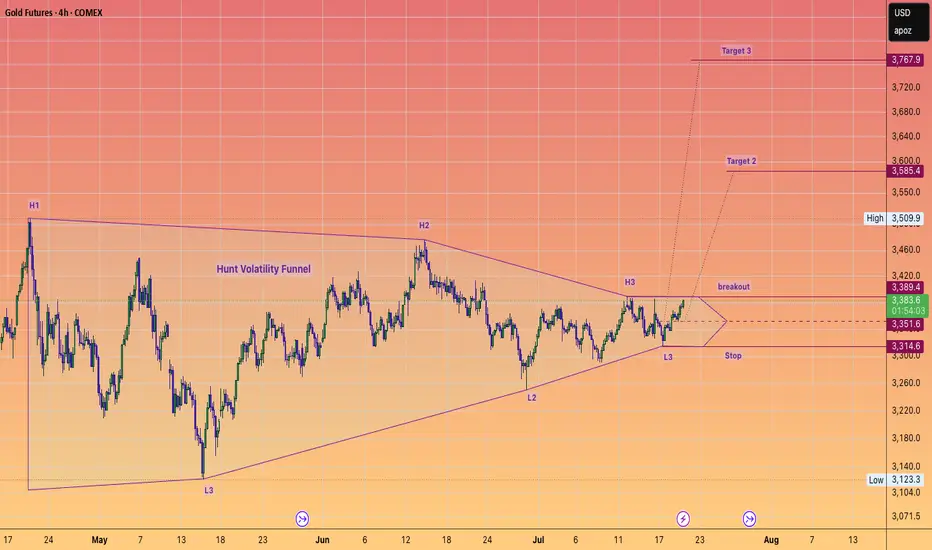
Trade Alert! GOLD to $3800 SOON.#HuntVolatilityFunnel setup which is about to trigger to the upside.
This setup should take gold to or very close to $4K IMHO
#GC
#GOLD
#SILVER
#METALS
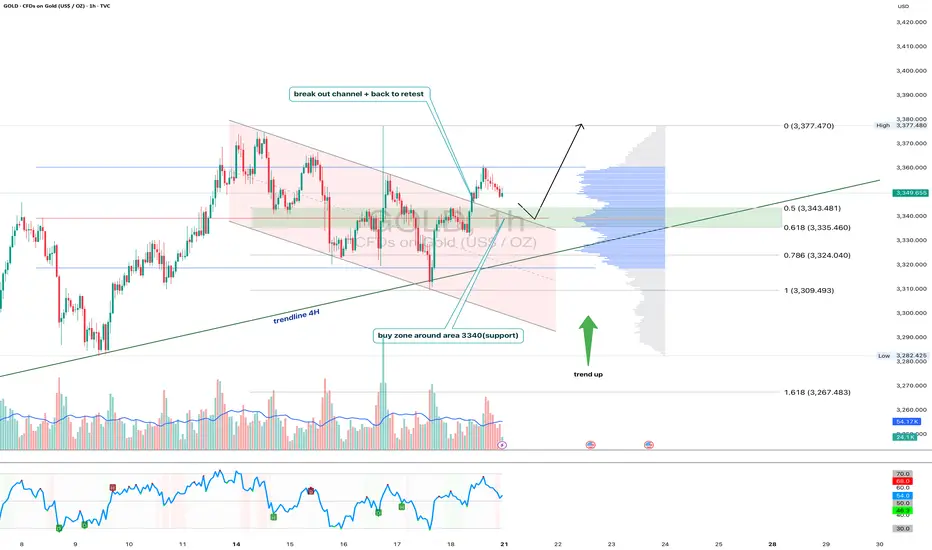
Gold 1H - Retest of channel & support zone at 3340After breaking out of the falling channel, gold is currently retesting its upper boundary — now acting as support. The 3340 zone is particularly important as it aligns with the 0.618 Fibonacci level and high volume node on the visible range volume profile. The price action suggests a potential bullish rejection from this area. With both the 50 and 200 EMA below price on the 1H, the short-term trend remains bullish. The 4H trendline further supports this setup. RSI is cooling off near the neutral zone, leaving room for another leg higher toward the 3377 resistance zone. If 3340 fails, 3324 (0.786 Fibo) becomes the next line of defense. Until then, the structure remains bullish following the successful breakout and retest of the channel.
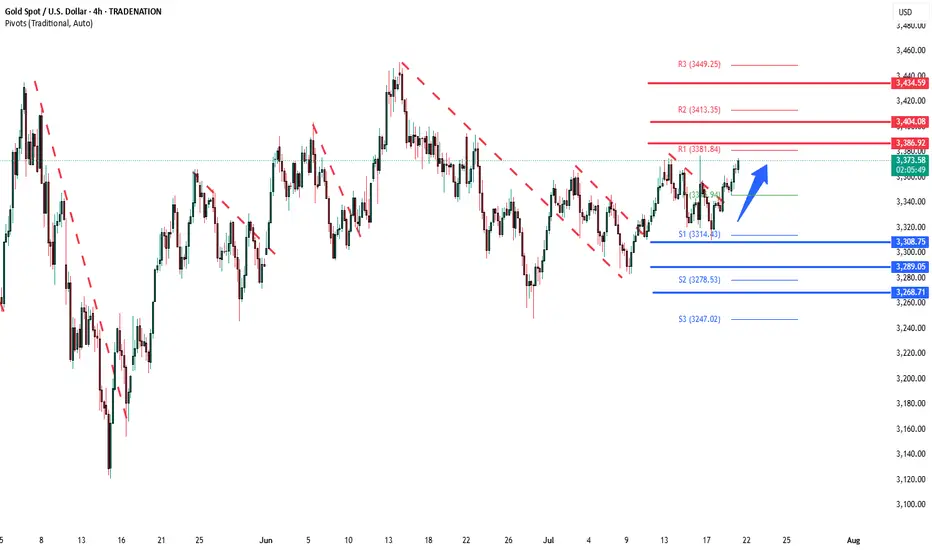
Gold bullish run continuation supported at 3308The Gold remains in a bullish trend, with recent price action showing signs of a continuation breakout within the broader uptrend.
Support Zone: 3308 – a key level from previous consolidation. Price is currently testing or approaching this level.
A bullish rebound from 3308 would confirm ongoing upside momentum, with potential targets at:
3387 – initial resistance
3400 – psychological and structural level
3435 – extended resistance on the longer-term chart
Bearish Scenario:
A confirmed break and daily close below 3308 would weaken the bullish outlook and suggest deeper downside risk toward:
3290 – minor support
3268 – stronger support and potential demand zone
Outlook:
Bullish bias remains intact while the Gold holds above 3308. A sustained break below this level could shift momentum to the downside in the short term.
This communication is for informational purposes only and should not be viewed as any form of recommendation as to a particular course of action or as investment advice. It is not intended as an offer or solicitation for the purchase or sale of any financial instrument or as an official confirmation of any transaction. Opinions, estimates and assumptions expressed herein are made as of the date of this communication and are subject to change without notice. This communication has been prepared based upon information, including market prices, data and other information, believed to be reliable; however, Trade Nation does not warrant its completeness or accuracy. All market prices and market data contained in or attached to this communication are indicative and subject to change without notice.
Gold is rising steadily.Gold technical analysis
Daily chart resistance: 3400, support: 3320
Four-hour chart resistance: 3390, support: 3340
One-hour chart resistance: 3375, support: 3348.
After bottoming out last Thursday, gold began to fluctuate upward on Friday, and the 1-hour bottom structure reappeared, which indicates that a new bullish opportunity has appeared again! It is worth noting that after breaking through 3344 on Friday, it continued to rise to around 3360. Today, after retreating to 3444 in the Asian session, it rose again. 3344 has become the top and bottom conversion position, so we can buy on dips based on the support of 3344. The second is the support at 3331.
In terms of intraday operations, the support below is 3344 and 3331, and it may not fall to around 3344. It is probably waiting to buy in the 3350-55 area. Pay attention to the key resistance around 3377 above. After the 15-minute top pattern appears, sell near this area.
Sell: 3375near
Buy: 3355near

Gold Nears $3,350 as Tariff Risks PersistGold rose to around $3,350 per ounce on Monday, extending its gains for a second session amid concerns over Trump’s tariff strategy. Commerce Secretary Howard Lutnick said a deal with the EU is likely but confirmed the August 1 tariff deadline. He also suggested smaller countries could face at least a 10% tariff, with some rates reaching 40%. Strong US data last week reduced expectations for an immediate Fed rate cut, capping gold’s gains. Markets now await comments from Fed Chair Powell and Governor Bowman for policy signals.
Gold faces resistance at 3380, with additional barriers at 3400 and 3430. Support levels are positioned at 3330, followed by 3295 and extending down to 3250.

Gold is waiting for a pullback to break through 3400In the short term, gold is stuck in a sideways trend near 3365. It is not recommended to enter this point regardless of long or short positions. It is expected that there will be certain variables in the NY period. If gold retreats and falls in the short term as we expect, it may first touch around 3361. If it falls below 3361, it is expected to touch around 3353, which is also the point I gave this morning to see support.
Judging from the market, our focus on the upper side is still the 3375-3385 resistance area. If it can be effectively broken through, it is expected to hit the 3400-3420 mark. Although the daily MACD is oscillating near the zero axis, the 4H market shows that the oscillation is strong. Our trading strategy remains unchanged in the short term. The pullback in the NY period provides an opportunity, and we can consider going long. If there is new news during the day that requires adjustment, I will notify you immediately. Bros, please be patient and wait for trading opportunities.
OANDA:XAUUSD

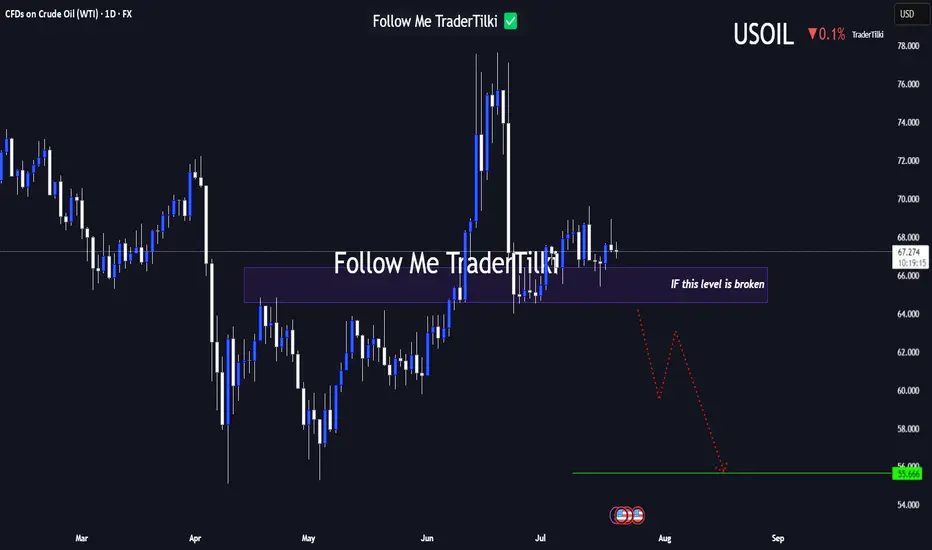
USOIL Under Technical Pressure: 1D Timeframe Breakdown Hey Guys,
The 66.584 level currently stands as the strongest support zone for USOIL. If this level breaks with a candle close, the next major target could drop to 55.666.
This setup is based on the 1-day timeframe. I highly recommend keeping a close watch on that key level.
Every like from you is my biggest motivation to keep sharing these insights. Thanks so much to everyone who’s showing support!
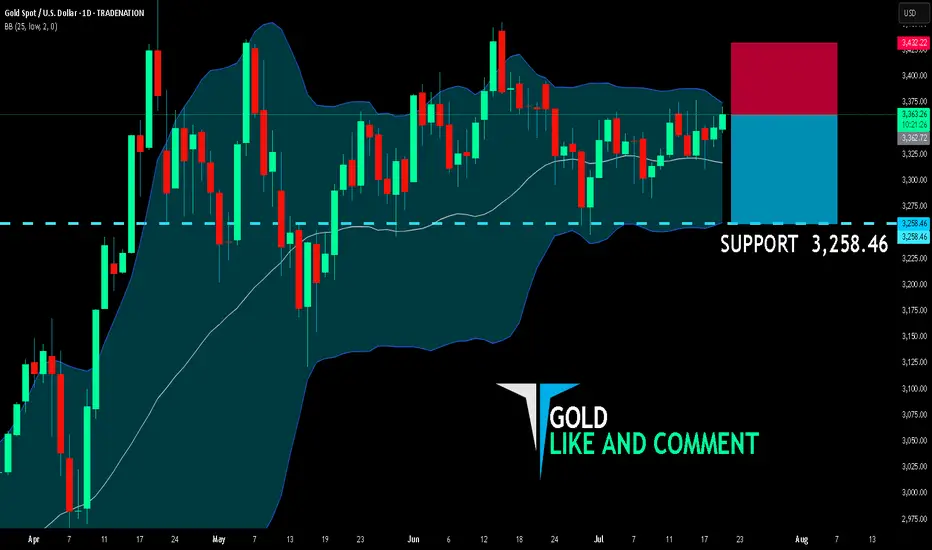
GOLD BEARS ARE GAINING STRENGTH|SHORT
GOLD SIGNAL
Trade Direction: short
Entry Level: 3,362.72
Target Level: 3,258.46
Stop Loss: 3,432.22
RISK PROFILE
Risk level: medium
Suggested risk: 1%
Timeframe: 1D
Disclosure: I am part of Trade Nation's Influencer program and receive a monthly fee for using their TradingView charts in my analysis.
✅LIKE AND COMMENT MY IDEAS✅
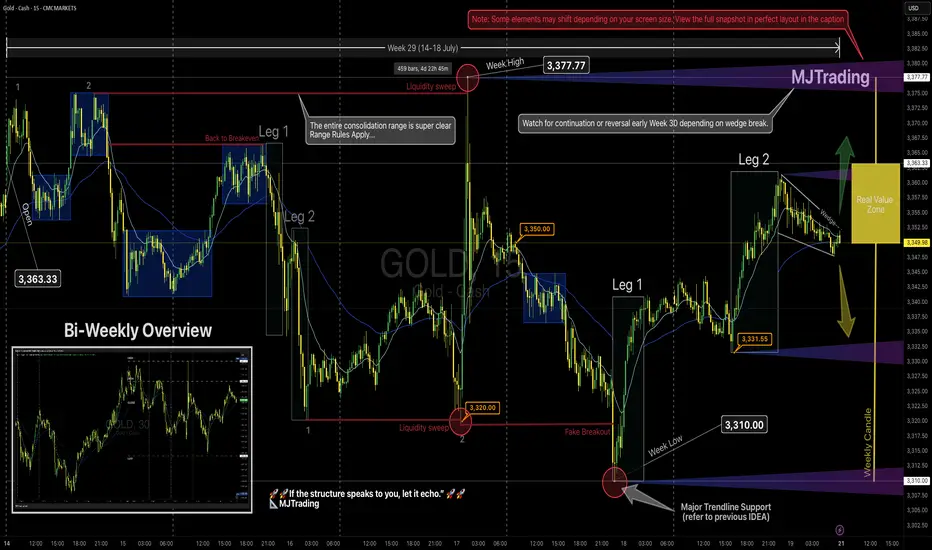
GOLD Weekly Recap (Week 29) – MJTrading View📸 Viewing Tip:
🛠️ Some layout elements may shift depending on your screen size.
🔗 View the fixed high-resolution chart here:
Now that you have got the perfect layout let's dive in...
📈 GOLD Weekly Recap (Week 29) – MJTrading View
🕰 Timeframe: 15min chart with bi-weekly perspective
📅 Period Covered: July 14–18 (Week 29)
🎯 Visual Framework: Leg structure, range boundaries, liquidity sweeps, trendline holds, and Real Value Zone.
🔹 Weekly Summary
Open: 3,363.33
High: 3,377.77 (🔴 sweep: trapped buyers)
Low: 3,310.00 (🔴 sweep into key demand + touching the main ascending trendline )
Close: 3,349.98~3350 (lovely round level)
Structure: Entire week played inside a broad consolidation range, with sharp but failed breakouts on both extremes.
Range rules applied: traps, sweeps, compression — everything aligned for responsive trading.
📌 Key Observations
Early Week:
A double-top structure led to rejection from ~3,375 → slid into 3,350.
Price returned to breakeven but then flushed hard toward 3,320 via a clean 2-leg drop.
Midweek:
After forming a double bottom, price created a tiny liquidity sweep, then exploded to the weekly high.
The move above 3,377.77 was a textbook liquidity grab, immediately rejected.
This led to a slide toward the weekly low, tagging both the trendline and consolidation floor — forming a false breakout + reversal.
Late Week:
The low at 3,310 was swept cleanly (🔴), followed by a leg-based reversal:
Leg 1: Up to 3,331
Leg 2: Extended to ~3,360 before fading back inside the range.
Compression:
Price closed inside the Real Value Zone (weekly candle body) — just under the open, forming a tight wedge, hinting at breakout conditions for Week 30.
🟨 Weekly Candle Body
Open → Close of weekly candle reflects Real Value Zone .
Highs and lows were swept, but real commitment stayed within the body.
🧭 Key Levels to Watch – Week 30
Level Role
3,377.77 Weekly High / Liquidity Sweep (🔴 rejection)
3,363.33 Weekly Open (break & hold = bullish bias) / Previous Weekly High
3,350.00 Micro resistance / Mid-structure cap / Round Level
3,331-3 Leg 2 low & first reaction zone / Round Level
3,320.00 Breakdown support / Flush origin
3,310.00 Weekly Low / Major Demand (🔴 sweep)
3,400.00 Next possible main target
3,282.00 Previous Weekly Low
Dynamics: Both Uptrend and Downtrend Lines...
🧠 MJTrading Notes
Bias remains neutral inside the range.
A break & acceptance above 3,363 could trigger a re-test of the sweep zone (3,377+).
A breakdown below 3,331 puts 3,320 → 3,310 back on the map then 3,282.
Don’t force direction — let expansion confirm itself.
🧭 “If the structure speaks to you, let it echo.”
– MJTrading 🚀
#MJTrading #ChartDesigner #GOLD #LiquiditySweep #PriceAction #StructureTrading #Weekly #Chart #Consolidation #2legs
🧠 Psychology always matters: