XAU/USD 16 July 2025 Intraday AnalysisH4 Analysis:
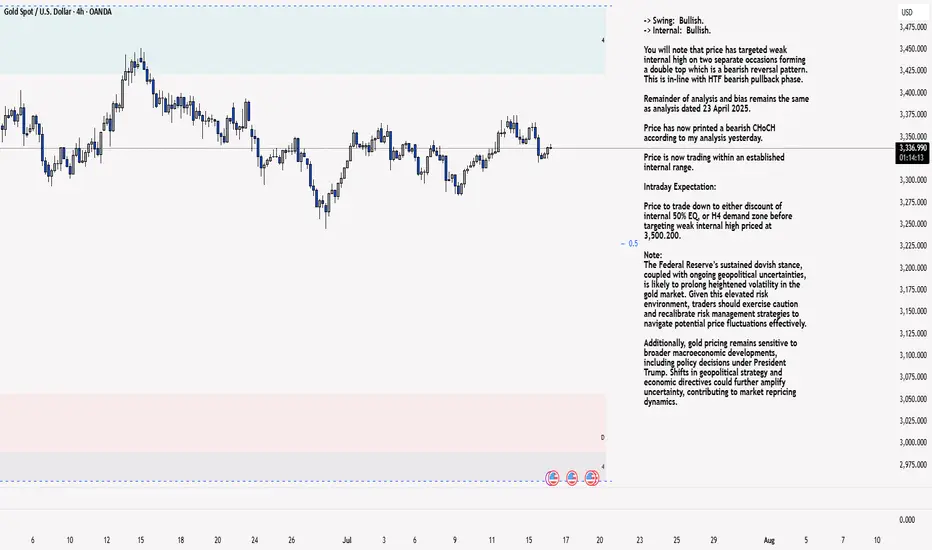
-> Swing: Bullish.
-> Internal: Bullish.
You will note that price has targeted weak internal high on two separate occasions forming a double top which is a bearish reversal pattern. This is in-line with HTF bearish pullback phase.
Remainder of analysis and bias remains the same as analysis dated 23 April 2025.
Price has now printed a bearish CHoCH according to my analysis yesterday.
Price is now trading within an established internal range.
Intraday Expectation:
Price to trade down to either discount of internal 50% EQ, or H4 demand zone before targeting weak internal high priced at 3,500.200.
Note:
The Federal Reserve’s sustained dovish stance, coupled with ongoing geopolitical uncertainties, is likely to prolong heightened volatility in the gold market. Given this elevated risk environment, traders should exercise caution and recalibrate risk management strategies to navigate potential price fluctuations effectively.
Additionally, gold pricing remains sensitive to broader macroeconomic developments, including policy decisions under President Trump. Shifts in geopolitical strategy and economic directives could further amplify uncertainty, contributing to market repricing dynamics.
H4 Chart:
M15 Analysis:
-> Swing: Bullish.
-> Internal: Bullish.
H4 Timeframe - Price has failed to target weak internal high, therefore, it would not be unrealistic if price printed a bearish iBOS.
The remainder of my analysis shall remain the same as analysis dated 13 June 2025, apart from target price.
As per my analysis dated 22 May 2025 whereby I mentioned price can be seen to be reacting at discount of 50% EQ on H4 timeframe, therefore, it is a viable alternative that price could potentially print a bullish iBOS on M15 timeframe despite internal structure being bearish.
Price has printed a bullish iBOS followed by a bearish CHoCH, which indicates, but does not confirm, bearish pullback phase initiation. I will however continue to monitor, with respect to depth of pullback.
Intraday Expectation:
Price to continue bearish, react at either M15 supply zone, or discount of 50% internal EQ before targeting weak internal high priced at 3,451.375.
Note:
Gold remains highly volatile amid the Federal Reserve's continued dovish stance, persistent and escalating geopolitical uncertainties. Traders should implement robust risk management strategies and remain vigilant, as price swings may become more pronounced in this elevated volatility environment.
Additionally, President Trump’s recent tariff announcements are expected to further amplify market turbulence, potentially triggering sharp price fluctuations and whipsaws.
M15 Chart:
Goldanalaysis
Gold Possible Retest of $3,365 Before Downside MoveGold is currently trading around $3,335, approaching a critical resistance level at $3,365, which has been marked as a “Main Resistance” on the chart. The recent price movement shows a strong bullish rebound from the $3,293–$3,300 support zone, breaking above two key trendlines labeled "Breakout."
The chart suggests a potential “retest” of the $3,365 resistance before another downward move, as marked by the annotation "Possible Retest and Then Down." This idea is reinforced by the broader descending channel pattern visible from late June, indicating that the larger structure still favors bearish continuation unless a strong breakout occurs above $3,365.
⚠️ Bearish Confluence
Price is inside a corrective channel, repeatedly failing to sustain above prior highs
$3,365 has held firm multiple times as resistance — a strong horizontal and trendline convergence zone
Price is still well below the swing high at $3,392
🟩 Bullish Scenario (If Invalidation Occurs)
If price breaks and closes above $3,365, it would invalidate the current bearish structure and open the door for upside targets like:
$3,392 (previous high)
$3,412
Possibly $3,434, which is a longer-term diagonal trendline resistance
At present, gold is in a corrective upward move within a broader bearish channel. The zone between $3,337–$3,365 will be key. A bearish rejection here would confirm downside continuation, with price potentially targeting $3,265–$3,220. However, a bullish breakout above $3,365 could invalidate the bearish view and suggest strength returning toward $3,392 and above.
Note
Please risk management in trading is a Key so use your money accordingly. If you like the idea then please like and boost. Thank you and Good Luck!

XAU/USD 06 June 2025 Intraday AnalysisH4 Analysis:
-> Swing: Bullish.
-> Internal: Bullish.
Analysis and bias remains the same as analysis dated 23 April 2025
Price has now printed a bearish CHoCH according to my analysis yesterday.
Price is now trading within an established internal range.
Intraday Expectation:
Price to trade down to either discount of internal 50% EQ, or H4 demand zone before targeting weak internal high priced at 3,500.200.
Note:
The Federal Reserve’s sustained dovish stance, coupled with ongoing geopolitical uncertainties, is likely to prolong heightened volatility in the gold market. Given this elevated risk environment, traders should exercise caution and recalibrate risk management strategies to navigate potential price fluctuations effectively.
Additionally, gold pricing remains sensitive to broader macroeconomic developments, including policy decisions under President Trump. Shifts in geopolitical strategy and economic directives could further amplify uncertainty, contributing to market repricing dynamics.
M4 Chart:
M15 Analysis:
-> Swing: Bullish.
-> Internal: Bearish.
Analysis and bias remains the same as analysis dated 22 May 2025.
In my analysis from 12 May 2025, I noted that price had yet to target the weak internal high, including on the H4 timeframe. This aligns with the ongoing corrective bearish pullback across higher timeframes, so a bearish internal Break of Structure (iBOS) was a likely outcome.
As anticipated, price targeted strong internal low, confirming a bearish iBOS.
Price has remained within the internal range for an extended period and has yet to target the weak internal low. A contributing factor could be the bullish nature of the H4 timeframe's internal range, which has reacted from a discounted level at 50% of the internal equilibrium (EQ).
Intraday Expectation:
Technically price to continue bullish, react at either premium of internal 50% EQ or M15 demand zone before targeting weak internal low priced at 3,120.765.
Alternative scenario:
Price can be seen to be reacting at discount of 50% EQ on H4 timeframe, therefore, it is a viable alternative that price could potentially print a bullish iBOS on M15 timeframe.
Note:
Gold remains highly volatile amid the Federal Reserve's continued dovish stance and persistent geopolitical uncertainties. Traders should implement robust risk management strategies and remain vigilant, as price swings may become more pronounced in this elevated volatility environment.
Additionally, President Trump’s recent tariff announcements are expected to further amplify market turbulence, potentially triggering sharp price fluctuations and whipsaws.
M15 Chart:

XAU/USD 03 June 2025 Intraday AnalysisH4 Analysis:
-> Swing: Bullish.
-> Internal: Bullish.
Analysis and bias remains the same as analysis dated 23 April 2025
Price has now printed a bearish CHoCH according to my analysis yesterday.
Price is now trading within an established internal range.
Intraday Expectation:
Price to trade down to either discount of internal 50% EQ, or H4 demand zone before targeting weak internal high priced at 3,500.200.
Note:
The Federal Reserve’s sustained dovish stance, coupled with ongoing geopolitical uncertainties, is likely to prolong heightened volatility in the gold market. Given this elevated risk environment, traders should exercise caution and recalibrate risk management strategies to navigate potential price fluctuations effectively.
Additionally, gold pricing remains sensitive to broader macroeconomic developments, including policy decisions under President Trump. Shifts in geopolitical strategy and economic directives could further amplify uncertainty, contributing to market repricing dynamics.
H4 Chart:
M15 Analysis:
-> Swing: Bullish.
-> Internal: Bearish.
Analysis and bias remains the same as analysis dated 22 May 2025.
In my analysis from 12 May 2025, I noted that price had yet to target the weak internal high, including on the H4 timeframe. This aligns with the ongoing corrective bearish pullback across higher timeframes, so a bearish internal Break of Structure (iBOS) was a likely outcome.
As anticipated, price targeted strong internal low, confirming a bearish iBOS.
Price has remained within the internal range for an extended period and has yet to target the weak internal low. A contributing factor could be the bullish nature of the H4 timeframe's internal range, which has reacted from a discounted level at 50% of the internal equilibrium (EQ).
Intraday Expectation:
Technically price to continue bullish, react at either premium of internal 50% EQ or M15 demand zone before targeting weak internal low priced at 3,120.765.
Alternative scenario:
Price can be seen to be reacting at discount of 50% EQ on H4 timeframe, therefore, it is a viable alternative that price could potentially print a bullish iBOS on M15 timeframe.
Note:
Gold remains highly volatile amid the Federal Reserve's continued dovish stance and persistent geopolitical uncertainties. Traders should implement robust risk management strategies and remain vigilant, as price swings may become more pronounced in this elevated volatility environment.
Additionally, President Trump’s recent tariff announcements are expected to further amplify market turbulence, potentially triggering sharp price fluctuations and whipsaws.
M15 Chart:

Gold Price Forecast: Bullish Channel Points to $3,388 TargetGold (XAU/USD) is trading in a strong ascending channel on the 45-minute chart, currently at $3,357.51 (+1.91%). Repeated bullish bounces off the channel’s lower boundary (highlighted in orange) reinforce the uptrend. With support from a green trailing indicator and recent breakout momentum, the next target is projected near $3,388.88. Watch for continued strength above the $3,330 zone for confirmation.
Chart Analysis: Gold (XAU/USD) – 45-Minute Timeframe
Trend Structure:
The price is moving within a well-defined ascending channel, indicating a strong bullish trend.
Higher highs and higher lows are consistently formed, respecting both the upper and lower bounds of the channel.
Key Observations:
1. Support Validation:
Multiple successful retests of the lower trendline (highlighted with orange circles) show solid demand and trend continuation behavior.
These retests occur with minimal drawdown, suggesting buyers are stepping in confidently at channel support.
2. Bullish Momentum:
The recent price breakout above consolidation (seen around May 24-25) shows renewed bullish interest.
The price is also supported by a trailing green indicator (likely an EMA or a dynamic support line), which the price remains above — a further bullish confirmation.
3. Short-Term Target:
Projected target of $3,388.878 aligns with the upper bound of the ascending channel, making it a logical resistance level.
If this level is breached with strong volume, it could open the door for continuation toward $3,400+.

GOLD 4H CHART ROUTE MAP UPDATE Hey Everyone,
Another productive session on the charts, with our strategy of buying dips delivering solid results once again.
This is a follow up on our 4-hour chart setup. The week began with our initial bearish targets being achieved, each confirmed by decisive candle body closures. Additionally, momentum conditions allowed for EMA5 lock confirmations at key levels, reinforcing the validity of the moves.
Today, price action tested the secondary swing range following a confirmed break and EMA5 lock below the primary swing zone. This led to a clean retracement and a reaction from the secondary swing range, with price covering the full range of the swing, a strong technical sign of structure respecting prior levels.
Looking ahead, we are closely monitoring for one of two scenarios:
1. Primary swing range completion – If price continues its upward momentum and completes the move back to the primary range, this could set the stage for a potential breakout.
2. Rejection at current zone – Should price fail to reclaim the primary swing range, we anticipate a retest of the lower Goldturn zones as support. A successful hold and bounce from this level would reinforce the broader range dynamics and offer renewed long opportunities.
We'll remain reactive to price structure and momentum alignment, especially in relation to key support/resistance levels.
Mr Gold
GOLDVIEWFX

XAU/USD 17 April 2025 Intraday AnalysisH4 Analysis:
-> Swing: Bullish.
-> Internal: Bullish.
Analysis and bias remains the same as analysis dated 16 April 2025. You will note that CHoCH positioning has been brought closer to current price.
Price has printed according to analysis dated 14 April 2025, however, as I mentioned in my analysis yesterday whereby I stated that price has printed a bearish CHoCH and I would continue to monitor price.
Price has printed very minimal pullback and continued its bullish trajectory, therefore, I will again apply discretion and not classify a bullish iBOS. I have however marked this in red as a guide.
Intraday Expectation:
Await for price to print bearish CHoCH to indicate bearish pullback initiation phase. Bearish CHoCH positioning is denoted with a blue dotted line.
Note:
With the Federal Reserve's dovish stance and persisting geopolitical uncertainties, heightened volatility in Gold is expected to continue. Traders should proceed with caution and adjust risk management strategies in this high-volatility environment.
Price could also be driven by President Trump's policies, geopolitical moves and economic decisions which are sparking uncertainty.
H4 Chart:
M15 Analysis:
-> Swing: Bullish.
-> Internal: Bullish.
Price printed according to yesterday's analysis by targeting weak internal high and printing a bullish iBOS.
Price subsequently printed a bearish CHoCH to indicate bearish pullback phase initiation.
Price is now trading within an established internal structure.
Intraday Expectation:
Price to trade down to either discount of 50% internal EQ, or M15 demand zone before targeting weak internal high priced at 3, 357.775.
Alternative Scenario:
As we await for price to print a bearish CHoCH on H4 TF is would be necessary for price to print a bearish iBOS on M15 TF (this is the fractal nature of markets) therefore, it should not come as a surprise is price printed a brearish iBOS.
Note:
With the Federal Reserve maintaining a dovish stance and ongoing geopolitical tensions, volatility in Gold prices is expected to remain elevated. Traders should exercise caution, adjust risk management strategies, and stay prepared for potential price whipsaws in this high-volatility environment.
Trump's tariff announcement will most likely cause considerably increased volatility and whipsaws.
M15 Chart:

XAUUSD Monthly Outlook – April 2025🎯 Market Context: Gold is currently trading in uncharted territory — sitting at all-time highs, right inside a Monthly Premium zone, just above the previous BOS level from 2011. This is significant institutional terrain.
📌 Key Monthly Levels:
🧊 Major Resistance Zone: 3,135–3,168 → This is a premium zone where price is likely to face profit-taking or distribution.
🔵 Monthly Fair Value Gap (FVG): Between 2,750–2,900 remains unfilled.
🪙 Last CHoCH and BOS: Confirmed bullish structure. Market has broken all historical ceilings.
⚖️ Equilibrium Zone: Around 2,400–2,500 → could act as a magnet in long-term pullbacks.
💎 Unmitigated OBs and Strong Lows: Still open way below 2,000 — long-term reversion zones if a macro bearish cycle begins.
🧠 Market Psychology:
We are clearly in the euphoria/distribution stage.
Monthly RSI is likely overbought (to be confirmed on chart), making bulls cautious for the first time in months.
Smart Money might be unloading positions subtly or looking to trap late longs.

XAU/USD 02 April 2025 Intraday AnalysisH4 Analysis:
-> Swing: Bullish.
-> Internal: Bullish.
Since last analysis price has continued extremely bullish. This is most likely due to market jitters caused by Trump's tariff policy which is driving up the price of gold.
This solidifies gold as a safe haven asset and could lead to repricing.
Price has printed a bearish CHoCH indicating, but not confirming bearish pullback phase initiation.
Price is now contained within an established internal structure. I will however continue to monitor price to evaluate depth of pullback.
Intraday Expectation:
Price to trade down to either discount of internal 50% EQ or H4 demand zone before targeting weak internal high priced at 3,149.090.
Note:
With the Federal Reserve's dovish stance and persisting geopolitical uncertainties, heightened volatility in Gold is expected to continue. Traders should proceed with caution and adjust risk management strategies in this high-volatility environment.
Price could also be driven by President Trump's policies, geopolitical moves and economic decisions which are sparking uncertainty.
H4 Chart:
M15 Analysis:
-> Swing: Bullish.
-> Internal: Bullish.
Analysis and bias remains the same as yesterday's analysis dated 01 April 2025
Since last analysis price has continued extremely bullish. This is most likely due to market jitters caused by the trump tariffs.
This solidifies gold as a safe haven asset and could lead to repricing.
You will note price has printed a bearish CHoCH which indicates, but does not confirm, bearish pullback phase initiation. I will however continue to monitor price.
Intraday Expectation:
Price to trade down to either discount of 50% internal EQ or M15 demand zone before targeting weak internal high, priced at 3,149.090.
Note:
With the Federal Reserve maintaining a dovish stance and ongoing geopolitical tensions, volatility in Gold prices is expected to remain elevated. Traders should exercise caution, adjust risk management strategies, and stay prepared for potential price whipsaws in this high-volatility environment.
M15 Chart:

Gold (XAU/USD) Trade Setup & Analysis – March 28, 2025Gold (XAU/USD) Trade Analysis – March 28, 2025
Current Market Overview:
Price: $3,073.77
Recent High: $3,074.00
Recent Low: $3,070.29
EMA (30): $3,073.71 (Short-term trend)
EMA (200): $3,047.40 (Long-term trend)
Technical Analysis:
Support & Demand Zone:
The highlighted purple area represents a strong support zone around $3,050 - $3,058, where buyers may step in.
The price is currently pulling back into this area, indicating a potential bullish reversal opportunity.
Bullish Projection:
The chart suggests a retracement to the demand zone, followed by a strong bullish continuation.
A breakout from the minor resistance zone around $3,073 - $3,075 would confirm the uptrend.
Target & Stop Loss:
Entry Zone: Around $3,058.86 (near the demand zone).
Stop Loss: Below $3,047.40 (under the key support and EMA 200).
Target: $3,109.54 (significant resistance level and profit-taking point).
Trade Strategy:
Wait for confirmation of a bullish rejection at the support zone before entering.
If price breaks above the minor resistance, it could indicate momentum toward the target.
Risk-to-reward ratio looks favorable with a potential upside move of +50 points if the trend continues.
Conclusion:
The setup favors a bullish continuation after a pullback.
Key Levels to Watch: $3,058 (entry), $3,047 (stop loss), and $3,109 (target).
Traders should monitor price action at the demand zone before entering a long position.

GOLD ROUTE MAP UPDATEHey Everyone,
Another awesome finish to the week with our charts idea playing out to perfection!!!
After completing our 3050 target yesterday, we got our cross and lock above 3050 opening 3065, followed with a further cross and lock above 3065 opening 3080, Both 3065 and 3080 were completed today for a perfect finish.
We will now need a cross and lock above 3080 for a continuation into the next Goldturn or failure to lock will see rejections into the lower Goldturns.
BULLISH TARGET
3032 - DONE
EMA5 CROSS AND LOCK ABOVE 3032 WILL OPEN THE FOLLOWING BULLISH TARGET
3050 - DONE
EMA5 CROSS AND LOCK ABOVE 3050 WILL OPEN THE FOLLOWING BULLISH TARGET
3065 - DONE
EMA5 CROSS AND LOCK ABOVE 3065 WILL OPEN THE FOLLOWING BULLISH TARGET
3080 - DONE
EMA5 CROSS AND LOCK ABOVE 3080 WILL OPEN THE FOLLOWING BULLISH TARGET
3097
BEARISH TARGETS
3015 - DONE
We will now come back Sunday with our updated Multi time-frame analysis, Gold route map and trading plans for the week ahead and also a new Daily chart long term chart idea, now that this one is complete.
Have a smashing weekend!! And once again, thank you all for your likes, comments and follows, we really appreciate it!
Mr Gold
GoldViewFX

GOLD DAILY CHART MID/LONG TERM UPDATEGOLD Daily Chart Update: Precision Analysis for Confident Trading (10th Feb 2024)
Hello Traders,
Here’s the latest update on the GOLD daily chart that we’ve been meticulously tracking and trading. Below, we provide an enhanced breakdown of recent movements, updated key levels, and actionable insights for the days ahead.
Recap of Recent Success in our previous chart:
Our recent analysis delivered remarkable accuracy:
* ENTRY LEVEL 2744: ✅ DONE
* TARGET TP1 (2807): ✅ DONE
* TARGET TP2 (2870): ✅ DONE
* EMA5 crossed and held above both Entry Level (2744) and TP1 (2807), confirming bullish momentum toward TP2 (2870). ✅ DONE
* The FVG zone at 2790 acted as strong support, facilitating upward momentum. ✅ DONE
* EMA5 correction at 2839 was completed successfully. ✅ DONE
* GOLD achieved a new ATH at 2886 after hitting TP2 (2870). ✅DONE
What’s Next for GOLD?
The price is now oscillating between critical weighted levels, with gaps both above and below 2870.
Key Levels to Watch:
Resistance Level: 2870
* A daily candle close above 2870 will confirm bullish momentum, with potential targets toward higher levels.
* Failure to close above this level may trigger a short-term reversal.
EMA5 Behavior:
* Or If EMA5 crosses and locks above 2870, it strengthens the bullish case.
* If EMA5 fails to hold, expect a pullback to key GOLDTURN levels.
Updated Support Levels (GOLDTURN Zones):
2801
2744
2671
2595
Key Scenarios:
* A bullish scenario could see the price retesting 2870 as resistance before pushing higher.
* A bearish scenario may unfold if the price fails to sustain above 2870, leading to a retest of
Recommendations:
* Capitalize on Dip Opportunities: Use smaller timeframes (1H, 4H) to trade around GOLDTURN levels, targeting 30–40 pips per trade.
* Stay focused on shorter trades in this range-bound market to manage volatility effectively.
Long-Term Bias:
Maintain a bullish outlook while viewing pullbacks as buying opportunities.
Accumulate positions near key support levels for a safer approach instead of chasing highs.
Final Note:
Trade with confidence and precision. Our analysis ensures you’re well-prepared to navigate the evolving market landscape. Stay updated with our daily insights across multiple timeframes for deeper clarity.
Thank you for your continued trust! Don’t forget to like, share, and comment to support our work.
Best regards,
The Quantum Trading Mastery Team

Gold (XAU/USD) Bearish Setup – Potential Drop to $2,991This is a trading setup for Gold (XAU/USD) on the 30-minute timeframe, showing a potential bearish move.
Analysis:
Key Indicators:
200 EMA (blue line) at 3,019.55: Acting as a resistance level.
30 EMA (red line) at 3,017.45: Providing short-term trend guidance.
Price Action & Structure:
The price previously rejected from a resistance zone (purple area) and started forming lower highs.
Repeated bearish patterns suggest another potential drop.
The chart highlights measured moves of previous declines (-30.62, -24.75), indicating a possible repeat of the pattern.
Trade Setup:
Bearish Outlook: Price is expected to drop towards the target point at 2,991.43.
Entry: Near the break of the lower trendline in the ascending wedge.
Target: 2,991.43 (marked as "TARGET POINT").
Risk Management: Ensure proper stop-loss placement above recent highs.
Conclusion:
If price respects the pattern, a downward move is likely.
A confirmed break below support could accelerate the drop.

XAU/USD 25 March 2025 Intraday AnalysisH4 Analysis:
-> Swing: Bullish.
-> Internal: Bullish.
Bias and analysis remains the same as analysis dated 23 March 2025.
Price has printed a bearish CHoCH following printing further all time highs.
Price is now trading within an established internal range. I will however continue to monitor price.
Intraday Expectation:
Price to trade down to either discount of internal 50% EQ, or nested Daily and H4 demand levels before targeting weak internal high priced at 3,057.590.
Note:
With the Federal Reserve's dovish stance and persisting geopolitical uncertainties, heightened volatility in Gold is expected to continue. Traders should proceed with caution and adjust risk management strategies in this high-volatility environment.
Price could also be driven by President Trump's policies, geopolitical moves and economic decisions which are sparking uncertainty.
H4 Chart:
M15 Analysis:
-> Swing: Bullish.
-> Internal: Bearish.
Analysis and bias remains the same as yesterday's analysis dated 24 March 2025.
As per analysis dated 19 March 2025 whereby I mentioned as an alternative scenario that internal range has significantly narrowed. All HTF's require a pullback, therefore, it would be completely viable if price printed a bearish iBOS.
This is how price printed, by printing a bearish iBOS.
Price has yet to print a bullish CHoCH to indicate bullish pullback phase initiation, however, price has traded into premium of 50% internal EQ, therefore, I am happy to confirm internal range.
Intraday Expectation:
Price has traded in to premium of 50% EQ and has mitigated M15 supply zone.
Technically, price to target weak internal low priced at 2,999.465.
Note:
With the Federal Reserve maintaining a dovish stance and ongoing geopolitical tensions, volatility in Gold prices is expected to remain elevated. Traders should exercise caution, adjust risk management strategies, and stay prepared for potential price whipsaws in this high-volatility environment.
M15 Chart:

"XAU/USD (Gold) Potential Reversal Setup — Bullish Recovery or FAlright! Let's break down the chart analysis for XAU/USD (Gold vs. USD) 📊💛:
Structure & Trend:
The market is in a corrective phase after a clear downtrend. The trendline break shows potential bullish momentum.
Zone Analysis:
The gray box represents a supply zone (strong resistance). Price may struggle to break above this area.
The target points (TP1 and TP2) are likely support levels where price might react if it drops.
Trade Setup:
The blue box indicates the potential buy zone with a stop loss slightly below it.
The stop loss is set around 3,030.71 - 3,031.00, aiming to minimize risk.
TP1: 3,014.58 — Short-term target.
TP2: 3,005.69 — A more conservative, safer target.
Bias:
The bullish arrow suggests a possible move upward if the price can maintain above the current support.
📌 Conclusion:
If you plan to buy, wait for a strong bullish confirmation (like a bullish engulfing candle) before entering.
If price breaks the stop loss level, a deeper drop may occur toward 2,993.55 - 2,993.21.

Gold Head & Shoulder Pattern, Possible shorting opportunities.Gold has recently formed a head and shoulders pattern on the chart, a classic bearish reversal signal that could indicate a potential decline in price. If the neckline is broken with strong volume, it may present a shorting opportunity for traders looking to capitalize on downside momentum.
Also showing bearish on 2 indicators ( RSI and MACD).
Also, in downward channels.
However, confirmation and risk management are essential before making any trading decisions.
Note :- This is not financial advice.

Gold Price Nears $3,000 for the First Time in HistoryGold Price Nears $3,000 for the First Time in History
As shown in the XAU/USD chart today, gold is at a record high, just $5 away from the key psychological level of $3,000. Moreover, on the futures market, COMEX data indicates that gold futures have already surpassed this barrier.
Bullish sentiment is driven by:
→ Low US inflation data (released on Wednesday), which boosted gold prices due to growing expectations of a more dovish Federal Reserve policy.
→ Uncertainty surrounding Trump’s tariffs, escalating global trade tensions. According to the latest reports, the US president has warned of a 200% tariff on European wine and other alcoholic beverages after the EU imposed a 50% tariff on American whiskey.
Technical Analysis of XAU/USD
In our previous post on 6 March, we identified an upward channel (marked in blue) and suggested that its lower boundary would act as support, providing bulls with an opportunity to push towards the $3,000 level.
As indicated by the arrow, this scenario played out:
→ 10–11 March: The price rebounded from the lower blue boundary.
→ The price then broke through $2,930.
The large bullish candle formed on 13 March signals strong buyer dominance, suggesting that:
→ $2,930 and $2,950, which previously acted as resistance, could now provide support for bulls.
→ This month, gold may exceed the $3,000 mark for the first time, reaching the upper boundary of the long-term channel (marked in yellow).
This article represents the opinion of the Companies operating under the FXOpen brand only. It is not to be construed as an offer, solicitation, or recommendation with respect to products and services provided by the Companies operating under the FXOpen brand, nor is it to be considered financial advice.

Gold in Correction Mode – How Low Can It Go!?As I expected in the previous post , Gold ( OANDA:XAUUSD ) started to decline from the Potential Reversal Zone(PRZ) and with good momentum .
Gold is moving near the Resistance zone($2,916-$2,905) and the 100_SMA(1-hour) . 100_SMA(1-hour) was an important support for Gold so that every time Gold hit this moving average, it started to increase.
Also, Gold's movements seem to be corrective since the market opened .
According to the theory of Elliott waves , it seems that Gold is in Corrective Waves , and according to Gold's falling momentum , it is possible that Gold will have a Zigzag Correction(ABC/5-3-5) in front of it.
In addition, if you look at the Gold chart in the 4-hour or Daily time frame , you will notice that there is a possibility of Adam & Adam Double Top Pattern(AADT) .
I expect Gold to attack at least the Support zone($2,890-$2,879) in the coming hours, and if this zone breaks , we should wait for Gold to drop to at least $2,865 .
Note: If Gold can go above 100_SMA(1-hour) again, or rather, if Gold touches $2,920, we should expect more pumps.
Be sure to follow the updated ideas.
Gold Analyze ( XAUUSD ), 1-hour time frame.
Do not forget to put Stop loss for your positions (For every position you want to open).
Please follow your strategy; this is just my idea, and I will gladly see your ideas in this post.
Please do not forget the ✅' like '✅ button 🙏😊 & Share it with your friends; thanks, and Trade safe.

GOLD The Week AheadThe GOLD (XAUUSD) price action sentiment appears bullish, supported by the longer-term prevailing uptrend. The recent intraday price action appears to be a corrective pullback. towards the previous consolidation price range and also the rising support trendline zone. .
The key trading level is at 2860 level, the previous consolidation price range and also the rising support trendline zone. A corrective pullback from the current levels and a bullish bounce back from the2860 level could target the upside resistance at 2907 followed by the 29350 and 2955 levels over the longer timeframe.
Alternatively, a confirmed loss of the 2860support and a daily close below that level would negate the bullish outlook opening the way for a further retracement and a retest of 2840 support level followed by 2800.
This communication is for informational purposes only and should not be viewed as any form of recommendation as to a particular course of action or as investment advice. It is not intended as an offer or solicitation for the purchase or sale of any financial instrument or as an official confirmation of any transaction. Opinions, estimates and assumptions expressed herein are made as of the date of this communication and are subject to change without notice. This communication has been prepared based upon information, including market prices, data and other information, believed to be reliable; however, Trade Nation does not warrant its completeness or accuracy. All market prices and market data contained in or attached to this communication are indicative and subject to change without notice.

XAUUSD NEW TARGETGold market is now stuck in no trade zone
2873-2879 we mark our support and resistance zone over here and wait for any candle to break and close above or below our rage
if it break through our range then we target previous 2 supports as our Tps
so Tp1= 2866
TP2 = 2782
And if breaks through our resistance zone which is also new ATH then we can mark our new ATH by follow trend line
Tp1= 2885
Tp2= 2900
BEST OF LUCK!

Gold Buy Signal: Bullish Momentum Alert! The gold market is on 🔥 with strong bullish momentum dominating the charts! 📈 We’ve identified a powerful upward channel that’s guiding prices higher, supported by impeccable price action setups.
Key Highlights:
✨ Price is breaking key levels with confidence, signaling continued strength.
✨ Uptrend intact, with no signs of slowing down.
✨ Perfect entry opportunity to ride the wave as the market pushes toward new highs.
📌 Don’t miss out on this golden opportunity—secure your position now and capitalize on the ongoing rally! 💰

Jan 21,2025 Gold IdeaTrading Strategy www.tradingview.com
January 21, 2025
Gold held its ground above 2703–2706 USD/oz yesterday, leading to a breakout at 2711–2712 USD/oz during the Asian session. This bullish signal suggests favoring Buy trades for today.
Key Levels
Support Levels:
2711–2712 USD/oz
2703–2704 USD/oz
Resistance Levels:
2733–2735 USD/oz
1. Buying Opportunities (Bullish Continuation):
Enter Buy positions if the price stays above 2711–2712 USD/oz.
Initial target: 2733–2735 USD/oz
Extended target: 2749–2750 USD/oz
Place a Stop Loss below 2708 USD/oz.
2. Pullback to Support Levels:
If the price retraces to 2703–2704 USD/oz, look for a strong rebound to enter Buy positions.
Target: 2711–2712 USD/oz and beyond.
Set a Stop Loss below 2700 USD/oz.
3. Breakout Above Resistance:
If the price breaks above 2735 USD/oz with strong momentum, consider additional Buy positions.
Target: 2749–2750 USD/oz.
Place a Stop Loss below 2730 USD/oz.

GOLD can jump down more .. Gold is showing signs of potential downside movement, suggesting that bearish pressure could dominate in the near term. Traders should remain vigilant and closely monitor key support levels to confirm the next direction. While the current trend hints at a possible drop, unexpected volatility could still influence the market, making it essential to adopt a cautious approach. Proper risk management and careful analysis are crucial to navigating this environment effectively.
