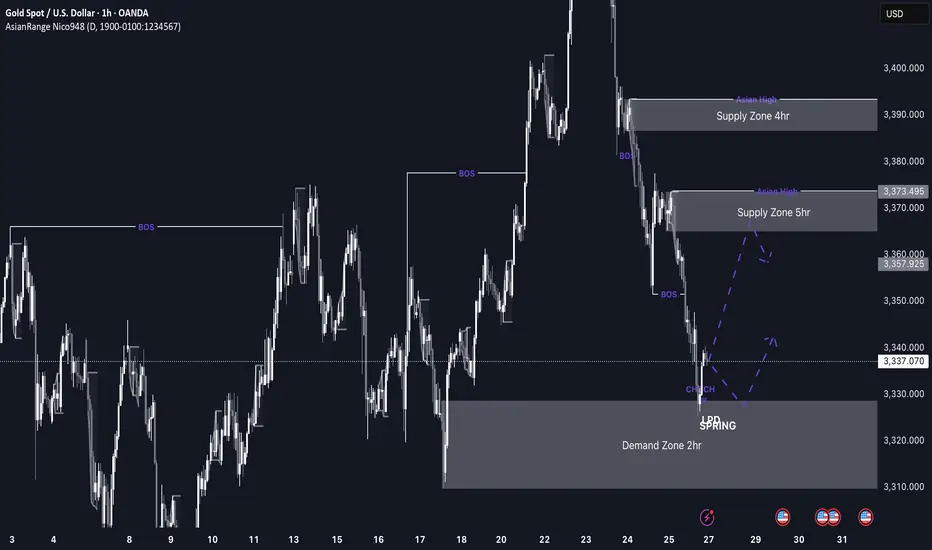
GOLD imminent possible buys up to 3,370 This week’s price action on GOLD is shaping up to be very interesting. After weeks of sustained bearish pressure, price has now entered a discounted 2hr demand zone sitting at a swing low, which makes it a high-probability area for a bullish reaction, especially as markets open.
If we do get the expected bullish reaction from this level, I’ll be watching the 3,370 region, where there’s a clean 5hr supply zone. If price reaches that level, I’ll be looking out for distribution and a potential short setup from there.
Confluences for GOLD Longs:
Price has been very bearish recently, so a retracement is expected
Currently sitting in a discounted 2hr demand zone
The overall long-term trend is still bullish
Early signs of accumulation and bullish reaction from this zone
P.S. If price fails to hold this current demand zone and breaks lower, then bearish momentum may continue. In that case, I’ll look for new long opportunities around 3,290 where a deeper demand zone exists.
Goldbullish
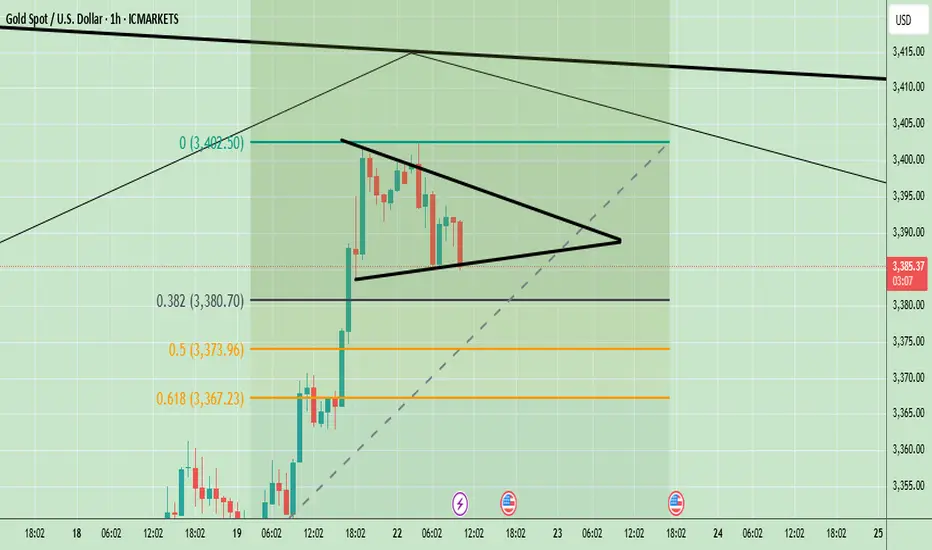
XAUUSD Technical Analysis – Triangle Breakout Ahead?Gold is currently consolidating in a symmetrical triangle pattern around $3,389. If it breaks above $3,402, we can expect a bullish continuation toward $3,420 and beyond. Key support lies at $3,367; a breakdown below this level would turn the trend bearish. The overall trend is still bullish, but a breakout is needed for confirmation.
📈 Potential Scenarios:
✅ Bullish Breakout Scenario:
- Break above $3,392–$3,402 zone.
- Targets: $3,420 > $3,450 > $3,480
- Supported by strong upward BOS (Break of Structure) and higher lows.
❌ Bearish Breakdown Scenario:
- Breakdown below $3,373–$3,367 zone.
- Targets: $3,355 > $3,345
- Would invalidate current bullish structure and form a lower low.
🔮 Trend Bias:
Bullish Bias remains intact as long as price stays above $3,367 and maintains higher lows. However, consolidation suggests waiting for breakout confirmation from the triangle before entering new trades.
🧭 Trend Outlook:
Gold is currently consolidating in a symmetrical triangle pattern, which typically precedes a breakout — either upward or downward. The price is holding above the key Fibonacci support levels and the overall market structure is bullish, suggesting an upward continuation is more likely if buyers maintain momentum.
Note
Please risk management in trading is a Key so use your money accordingly. If you like the idea then please like and boost. Thank you and Good Luck!
XAU/USD analysis & outlookWeekly Outlook: GOLD (XAUUSD)
This week, I’ll be monitoring different scenarios, as price is currently far from any of my key Points of Interest (POIs).
My nearest potential buy is around the 3-hour demand zone. While it's not the most ideal entry—since it isn’t located in a discounted area—I’ll still keep an eye on it.
That said, I would prefer to see a deeper retracement into the 6-hour demand zone, which is in a far more discounted region. This zone offers a stronger setup, and I could see price launching from there again if tapped.
We’ve already seen a strong bullish reaction from last week’s demand zone, and based on current momentum, I could see price continuing upward until it reaches my next sell opportunity—the 3-hour supply zone, which sits at a premium level.
Confluences for GOLD Buys:
✅ Bullish structure — price has broken to the upside and remains overall bullish.
✅ Fresh 3H and 6H demand zones formed, which price could return to.
✅ Liquidity above — including trendline liquidity and previous Asia highs.
✅ Fundamentals — potential tariff cuts could fuel long-term bullish momentum for gold.
✅ Bearish Dollar Index (DXY) aligns with the bullish gold outlook.
📌 If price doesn’t retrace and instead continues to push higher, I’ll wait for another break of structure to the upside on the way toward the supply zone before reassessing entries.
Let’s stay focused and let the market come to us. Wishing everyone a great trading week ahead! 👊📈

Gold bullish setup "Gold Buy Setup: Price is bouncing off key support at ,3333/3335 with a potential bullish reversal in play. Buying opportunity on the horizon
Gold buy level 3333/35
First target 🎯. 3338
Second target🎯 3342
Third target 🎯 3347
Guys leave comment what you think about this setup

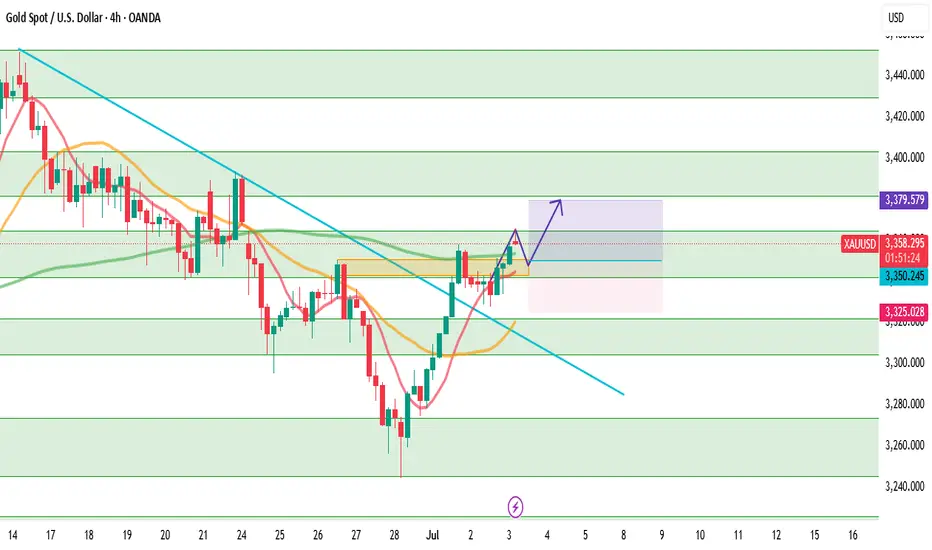
XAUUSD — July 3rd, 2025: Is the Downtrend Finally Over?Gold (XAUUSD) opened today with a bullish gap, and continued the momentum from Tuesday’s breakout above the major downtrendline that had capped the market for weeks. This technical breakout was long-awaited by many traders, and it's now leading us into a potential trend reversal phase — but not without resistance.
Price has now reached a critical resistance zone at 3366, which previously acted as a strong supply area during the last leg of the downtrend. If this level is broken decisively (ideally with a 4H candle close and follow-through), it may signal a clean shift toward a mid-term uptrend, with upside targets at 3379, 3403, and even 3430.
That said, rejection at 3366 has already triggered a minor pullback. We’re now watching the 3343–3351 zone as a potential support and an optimal buy entry area. If this zone holds, it could provide the fuel needed for bulls to continue their push.
🟢 Suggested Trade Plan
BUY LIMIT 3343–3351
Stop Loss 3325
Take Profit 1 3379
Take Profit 2 3403
Take Profit 3 3430
(Alternatively, consider a BUY STOP above 3370 in case of direct breakout)
📌 Market Structure
Resistance 3 3430
Resistance 2 3403
Resistance 1 3382
Pivot 3366
Support 1 3342
Support 2 3322
Support 3 3305
⚠️ Important Macro Alert
Today’s session is highly risky due to the early release of Non-Farm Payrolls (NFP) data, which is scheduled today instead of Friday because of the U.S. Independence Day (July 4) holiday tomorrow.
This brings a major volatility spike risk during the New York session. Manage your position size wisely, avoid emotional trades, and wait for solid confirmations.
Discipline beats prediction. Trade what you see — not what you feel.
Keep healthy so we can keep trading and we can keep on profiting.
Gold Turns Bullish After Clearing Daily Sell-Side LiquidityThe purge of this liquidity indicates that institutional players may have engineered a move to grab orders before initiating a new upward leg. Following this move, price action shows signs of strong bullish intent, such as bullish engulfing candles, increased volume on up moves, or a break above short-term resistance.
This liquidity sweep not only invalidates bearish pressure but also creates a clean bullish imbalance, offering a potential entry zone for buyers. Traders should now watch for:
A break and retest of the key structure above the liquidity sweep.
Bullish order blocks forming on lower timeframes (e.g., H1 or H4).
Confluences like Fibonacci retracement levels, trendline support, or moving average bounces.
As long as price holds above the level of the purge and continues forming higher lows, gold is likely to trend upward in the near term. Potential targets include recent highs or fair value gaps left behind during the bearish move.
This setup favors buying pullbacks rather than chasing price, with invalidation below the recent sweep level.

GOLD Price Forecast: Is the Pullback Over? | Weekly OutlookWill XAUUSD resume its bullish trend, or is more downside ahead?
In this video, I break down last week’s gold price movement and the current market reaction to rising geopolitical tensions between Iran and Israel, now with the U.S. joining the conflict. We also assess the impact of the Fed’s recent rate hold, weak retail sales, and upcoming high-impact U.S. economic events like PMI, GDP, and Core PCE.
💡 Here’s what you’ll learn:
✅What caused gold’s pullback last week
✅Why institutional traders shake out retail buyers
✅Key fundamentals driving gold right now
✅How to position yourself smartly for the upcoming trading week
🔔 Don’t forget to like the video in support of this work.
Disclaimer:
Based on experience and what I see on the charts, this is my take. It’s not financial advice—always do your research and consult a licensed advisor before trading.
#goldanalysis, #xauusd, #goldforecast, #goldpriceprediction, #forexanalysis, #fundamentalanalysis, #forextrading, #tradinggold, #goldnews, #federalreserve, #marketpsychology, #tradingstrategy, #geopoliticalrisk, #usdata, #iranisraeltensions, #goldbullish, #goldbearish, #forexmentor, #xauusdforecast, #tradingview

| Gold | And Gold Alone : Buy The Best | Accept No Substitute | | Gold | And Gold Alone : Buy The Best | Accept No Substitution |
Gold
Accept No Substitute.
Never fall into the "Catch-Up Game Trap."
Silver is presently such a Trap.
Gold will continue to Outperform Silver
Don't let a Dealer convince you otherwise
Buy Strength, Sell Weakness
Buy The Best, Winner takes all
Gold / > United States Dollar
Gold / > US Dollar Index
Gold / > Swiss Franc
Gold / > Great British Pound
Gold / > Euro
Gold / > Japanese Yen
Gold / > Bitcoin
Gold / > Silver
Bitcoin / < Gold
Bitcoin Total Market Cap / < Gold
Silver / < Gold
Pro Tip : Rarely a good bet, if your Broker is paying carry for you to hold it.
It's in the Detail
🌟

XAUUSD Daily Outlook — Monday, June 2, 2025“Compression in Premium: Is Gold Building for the Drop?”
👋 traders — let’s prepare the battlefield.
Gold continues to range inside a tight compression box just under the May High. The current daily structure is showing clear signs of distribution inside premium, with multiple failed attempts to break higher. Each upside wick has been absorbed near 3328–3350, and price is now hovering just above key support near EMA50 + PNL (3228–3232).
This setup is classic: lower highs + equal lows + trapped liquidity = imminent breakout. We now anticipate either a clean breakdown below support, or one final inducement wick before the move begins.
🔹 Daily Structure Breakdown
Structure Element Status
Market Bias 📉 Bearish short-term (distribution signs)
Trend Sideways in premium, LH forming
Current Price ~3289 USD
April ATH 3500 (untouched since)
Last CHoCH/BOS BOS confirmed early May → bullish, but no follow-through
Current Setup Range-bound inside lower high, testing OB support
🔹 Refined Daily Zones
📍 Zone Type Key Levels What to Watch
🔺 Rejection Zone #1 3328 – 3342 Daily supply + previous bearish wick zone. Watch for rejection or inducement spike.
🔹 Key Support Zone 3232 – 3228 PNL + EMA50 cluster. Critical line — a clean break opens downside continuation.
🔹 Demand Block 3190 – 3180 Micro OB from May low. If support fails, this is the next magnet.
🔻 Breakdown Target 3044 Unfilled imbalance + clean demand zone from April breakout leg.
🔹 EMA & Momentum Check
✅ EMA 5/21/50: Still aligned bullish
⚠️ Price is sitting on top of EMA50 → breakdown threat if today's candle closes below 3228
RSI likely showing divergence — lower highs in price, weakening momentum
🔹 Daily Bias & Scenarios
📉 Bearish Bias below 3328
✅ Compression inside premium = expect breakout
🎯 Target 1: 3190 | 🎯 Target 2: 3044
❗ Bullish continuation only valid above 3342 with strong PA
🧠 Strategy Plan for Monday:
Sell Setup:
If price retests 3328–3342 early → watch for rejection → short toward 3190
Breakdown Setup:
Clean close below 3228 → open short continuation toward 3180
Buy Setup:
Only valid on deep retracement into 3180 with strong rejection + M15 structure shift
OR bullish breakout and hold above 3342 → target retest of May high
💬 Final Thoughts from GoldFxMinds:
Gold is compressing just below premium rejection — exactly where smart money distribution begins. This is not the moment to long blindly. Let the market show its hand — either break support, or spike into one final trap before dropping.
Trade with structure. Not emotion.
💡 Found this helpful?
📍 Follow GoldFxMinds for intraday sniper-entry updates, refined zones, and structured trade planning
💬 Drop a LIKE if you’re prepared to let the trap trigger before you react
👇 Comment below: Will gold hold 3228 or flush into 3190 this week?
Let’s start June with clarity and control.
— GoldFxMinds

XAUUSD Weekly Outlook – June 2–6, 2025“Lower High Locked In – Is Gold Ready to Retrace?”
👋 Hello traders — welcome to a new week with GoldFxMinds.
After weeks of strong bullish momentum, gold finally showed its first real sign of weakness. Price reached a weekly high of 3356 but failed to continue higher toward April’s ATH at 3500, forming a clean Lower High (LH). The weekly candle closed with a long upper wick and bearish body — a strong signal that buyers are losing steam inside the premium zone.
We now shift into a corrective posture, watching closely to see if gold wants to rebalance down into true structure zones.
🔹 Market Context & Structure
📍 Detail Status
Macro Bias Bullish (ATH = 3500, April)
Current Trend Weakening – LH formed last week
Weekly Close 3289, under EMA5
Momentum Shift First rejection after vertical rally
Structure Warning Clean LH under ATH confirms retracement probability
🔹 EMA Overview (5/21/50)
✅ EMA Stack: Bullish
⚠️ Price closed under EMA5 (~3288) = first warning
📍 EMA21 near 3076 — next key level for reaction
🛑 Below EMA21 → full retracement likely toward 3040–3038
🔹 Refined Weekly Zones (Precision-Mapped)
📍 Zone Key Levels What to Watch
🔺 Rejection Zone #1 3335 – 3348 Last week’s wick area — short-term supply, expect reaction if retested.
🔺 Inducement Zone 3368 – 3405 Unfilled FVG + internal liquidity. Valid only if HH forms.
🔹 Support Zone #1 3112 – 3098 Monthly PNL + OB. Watch for intraday bounce if price flushes.
🔹 Support Zone #2 3062 – 3040 Clean weekly OB + FVG. Strongest buy zone if retracement deepens.
🧭 Under 3040 = next macro structure at 2638 (last HL)
🔹 Weekly Game Plan
If early spike into 3335–3348 → monitor for rejection wick → possible short setup
Break of 3245 (last weekly low) → opens path toward 3110 then 3062
Entry on 3062–3040 → valid only if PA confirms (rejection wick, BOS on LTF)
Continuation long only if 3368–3405 is broken and held → target ATH (3500)
🔚 Summary:
Gold printed a Lower High last week — the first since the macro breakout. That’s a critical signal. With premium already tapped and liquidity cleared above 3300, price may now retrace into real structure, offering better long setups lower.
Let the market come to you. Don’t force buys near distribution zones. Watch the 3110 and 3062 areas — that’s where clean structure begins.
💬 If You Found This Helpful:
🔔 Follow GoldFxMinds for daily sniper-entry updates, macro-to-intraday zone breakdowns, and real-time structure shifts
👍 Tap a LIKE if you’re ready to let price come to your level, not your emotions
💭 Comment below: Is this Lower High the start of June’s retracement?
Let’s stay focused and trade with intent.
— GoldFxMinds

XAUUSD Daily Plan – May 21, 2025Gold dancing on liquidity ropes – who’s pulling the strings tomorrow?” 🎭📉📈
🧠 Bias: Mixed
HTF (H4/D1): Bullish retracement inside a bearish macro leg
LTF (M15–H1): Price in premium + internal LH rejection attempt
No clear confirmation for reversal yet – NY may decide
🔵 Discount Buy Zones (for bullish continuation)
3265–3275 → First valid retracement block inside last bullish impulse
3227–3242 → Internal HL + FVG + ascending trendline confluence
3178–3192 → Strong breaker + demand zone holding structure
🔴 Premium Sell Zones (for short-term reaction/reversals)
3285–3292 → Internal LH zone reacting now, possible short-term supply
3318–3330 → Unmitigated OB + clean sweep if market expands
3362–3375 → Final liquidity target above weak high + bearish OB
🧭 Structure Context
D1 CHoCH already printed → valid for short-term retracement longs
H1 broke bullish structure → forming internal HLs
M15 just printed a BOS + premium entry active
H4 bearish swing still intact – bulls need HL above 3190 to flip narrative
📌 Intraday Focus:
Watch for confirmation rejections around 3290 and liquidity grabs above 3300. If price breaks and holds 3295–3300, next invalidation for sellers would be near 3318. If price drops below 3242, look for reaction in deeper demand.
💬 Like this analysis? Smash that ❤️, drop your scenario in the comments, and follow GoldFxMinds for more refined updates. Let’s build together!
— GoldFxMinds

Gold Bullish Outlook - Gold BullishFollowing strong buying momentum observed yesterday, gold is currently consolidating within a falling wedge pattern — a typically bullish setup. A breakout from this pattern could trigger a fresh upward move in the price of gold.
Post-Breakout Bullish Targets:
Target 1: 3230
Target 2: 3240
Target 3: 3250
Target 4: 3275
Disclaimer: This is a technical analysis-based outlook. Please assess your risk-to-reward ratio and follow your individual trading strategy. This is not financial advice — trade responsibly and according to your plan.

Gold Technical Update (4H Time Frame) / Gold BullishAs we mentioned last week, gold was consolidating on the 4H time frame. After the breakout, all our projected targets were successfully achieved as of yesterday.
Currently, gold is forming a bullish flag pattern on the 4H chart — a continuation pattern that often signals the potential for further upside.
If gold sustains above the 3275–3280 zone, we may see renewed bullish momentum with the following potential targets:
Target 1: 3300
Target 2: 3340
Target 3: 3360
Target 4: 3400
⚠️ This is a technical analysis-based outlook. Traders are advised to manage their positions with proper risk-reward strategies and stay updated with market developments.

Gold - Expecting Bullish Continuation In The Short TermH4 - We have a clean bullish trend with the price creating a series of higher highs, higher lows structure.
This strong bullish momentum is followed by a pullback.
Until the two Fibonacci support zones hold I expect the price to move higher further.
If you enjoy this idea, don’t forget to LIKE 👍, FOLLOW ✅, SHARE 🙌, and COMMENT ✍! Drop your thoughts and charts below to keep the discussion going. Your support helps keep this content free and reach more people! 🚀
--------------------------------------------------------------------------------------------------------------------
Disclosure: I am part of Trade Nation's Influencer program and receive a monthly fee for using their TradingView charts in my analysis.

XAU/USD potential Longs from 2990 back up to 3,100This week, I’m considering both short- and long-term opportunities on gold. We’ve recently seen a change of character to the downside, and there’s a clean 1-hour supply zone that could trigger a short-term bearish reaction.
That said, there’s also a lot of nearby liquidity resting below, which I expect price to sweep first. If that happens, I’ll be watching the 20-hour demand zone—a strong area that could spark a new bullish rally from the lows.
Confluences for GOLD Buys:
- Price has recently cleared a new all-time high (ATH), indicating continued bullish strength.
- Market structure remains overall bullish, suggesting this move down may be a temporary correction.
- The 20-hour demand zone sits just below key liquidity and looks highly valid.
- Untouched Asia session highs remain above, which price is likely to target.
- The DXY is moving bearish, aligning with a bullish outlook on gold due to their inverse correlation.
Note: If price reacts from the current demand zone (which is also valid), we could see Scenario B play out first—a rally followed by a short move to clear liquidity before heading higher.
Stay patient and trade safe, everyone!

GOLD Long opportunity from 3,050 or 3,020 back to ATH'sThis week, my outlook on gold remains strongly bullish. Price has once again reached its all-time high (ATH) and broken structure to the upside, leaving behind new demand zones that present potential buying opportunities.
The first key area of interest is the nearby 6-hour demand zone. While not the most ideal setup, I will be monitoring how price reacts once it mitigates this level.
Additionally, there is a 15-hour demand zone positioned lower, offering a more favorable entry at a discounted price. This zone was responsible for the break of structure to the upside, making it a strong area of interest. If price reaches this level, I expect a slowdown followed by a buildup of bullish momentum.
Confluences for XAU/USD Buys:
Price has broken structure to the upside on the higher timeframes.
Clean 6-hour and 15-hour demand zones remain unmitigated.
Gold has been consistently bullish across both lower and higher timeframes.
DXY is trending bearish, reinforcing gold’s bullish bias due to their inverse correlation.
Note: There is some liquidity resting below in the form of an equal low and a small trendline. I will wait for confirmation in these areas before making any decisions.

Breakout Confirmed! Gold’s Next Target Could Be $3,500+Gold has reached a new all-time high (ATH), signaling strong bullish momentum. The breakout above the long-term rising trendline, which previously acted as resistance, indicates a shift in market structure.
The resistance zone has now turned into support, confirming buyers' dominance. A minor pullback or retest of this breakout level could be expected before a stronger continuation to the upside.
If the price sustains above this zone, potential targets lie at $3,100-$3,200 in the short term and $3,500+ in the medium term.

XAU/USD Gold Buys from 2,900 back upGold has been in a strong bullish uptrend for the past few weeks, so I’m not surprised that price has once again reached all-time highs. As anticipated, price mitigated the demand zone and continued pushing upward.
For this week, I expect price to accumulate and retrace back down to my 11-hour demand zone, where I anticipate signs of weakening before a new bullish move to the upside. Since this demand zone was responsible for the recent break of structure, it has become my point of interest (POI).
Confluences for Gold Buys:
✅ Price remains in a strong bullish trend, consistently forming higher highs and higher lows.
✅ The clean 11-hour demand zone that initiated the last upside move remains unmitigated.
✅ There is liquidity resting above, including the newly formed trendline, which is likely to be taken.
✅ This setup aligns with the overall bullish trend, reinforcing my long bias.
Alternative Scenario:
If price fails to hold at the 11-hour demand zone and breaks the major low, we could see a temporary bearish phase or a potential reaction from the 7-hour demand zone instead.
Wishing everyone a great trading week! 🔥📈

XAU/USD Bullish Surge: Gold Shines as Buying Momentum DominatesGold (XAU/USD) is on a strong bullish run as market momentum favors buyers. With increasing demand and positive technical indicators, the precious metal is set for further gains. Stay tuned for key levels and updates! 💰📈

Continue to buy goldDear traders,
From the gold candlestick chart, it is evident that the bulls are still in control. However, after reaching 2943 today, gold experienced a sharp pullback, indicating either a bearish counterattack or profit-taking by long positions. As gold prices rise and external factors come into play, market volatility has intensified, leading to an increasingly fierce battle between bulls and bears, making short-term trading more challenging.
Currently, gold has retraced from the 2943 high but has not yet disrupted its overall bullish structure. Based on the current price action, as long as gold holds above the 2905-2895 support zone, there are no clear technical signals indicating a trend reversal. At least until the release of CPI data, gold is unlikely to shift its trend decisively. With no confirmed topping signals, gold still holds the potential for further upside.
For short-term trading, if gold retraces to the 2905-2895 region and holds above this level, long positions can be considered. However, traders should remain cautious—if gold breaks below this support zone, a deeper correction toward the 2870-2860 area could be expected.
Bros, would you choose to be long gold like me? If you want to learn more detailed trading ideas and get more trading signals, you can choose to join the channel at the bottom of the article to make trading no longer difficult and make making money a pleasure!

GOLD ROUTE MAP UPDATEHey Everyone,
What an amazing finish to the week smashing all our chart ideas across all our multi timeframe analysis.
After completing all our targets yesterday; we stated that we now needed to see ema5 lock above 2797 for a continuation into 2808. This was hit perfectly today completing all our targets for a perfect finish to the week.
BULLISH TARGET
2778 - DONE
EMA5 CROSS AND LOCK ABOVE 2778 WILL OPEN THE FOLLOWING BULLISH TARGET
2787 - DONE
EMA5 CROSS AND LOCK ABOVE 2787 WILL OPEN THE FOLLOWING BULLISH TARGET
2797 - DONE
EMA5 CROSS AND LOCK ABOVE 2797 WILL OPEN THE FOLLOWING BULLISH TARGET
2808 - DONE
BEARISH TARGETS
2768 - DONE
EMA5 CROSS AND LOCK BELOW 2768 WILL OPEN THE FOLLOWING BEARISH TARGET
2757 - DONE
EMA5 CROSS AND LOCK BELOW 2757 WILL OPEN THE FOLLOWING BEARISH TARGET
2746 - DONE
EMA5 CROSS AND LOCK BELOW 2746 WILL OPEN THE FOLLOWING BEARISH TARGET
2732 - DONE
EMA5 CROSS AND LOCK BELOW 2732 WILL OPEN THE SWING RANGE
SWING RANGE
2707 - 2697
We will now come back Sunday with our updated Multi time-frame analysis, Gold route map and trading plans for the week ahead.
Have a smashing weekend!! And once again, thank you all for your likes, comments and follows, we really appreciate it!
Mr Gold
GoldViewFX

Gold's big breakout pre-market XAUUSD
The market wanted to breakout yesterday so imagine how the pump might be today.

XAU/USD Longs from 2,696.000 back upMy analysis for GOLD this week focuses on the continuation of the strong bullish trend. GOLD has shown impulsive movement and reacted perfectly to the demand zone I marked out last week. This reaction led to a break of structure to the upside, further confirming the bullish direction.
Now, with new demand zones formed, I’ll be waiting for the price to retrace back to either the 1-hour or 3-hour demand zone before the next bullish rally. From there, I plan to buy up to the Asian high, which is positioned just above the nearest supply zone.
Confluences for GOLD Buys:
- Price reacted strongly off last week’s demand zone and remains bullish.
- Both the short-term and long-term trends are bullish.
- Price has broken structure to the upside again, confirming direction.
- An Asian high above needs to be taken, providing a clear target.
Note: If the price moves up first, I may consider a quick sell from the 1-hour supply zone. However, I’ll wait for additional confirmations before taking any counter-trend trades.
