GOLD IS BULLISH AGAIN TILL 1770 AREAGreetings
I have just three words too say for gold right now and those are "GOLD IS BULLISH".
Gold is testing 1745 area again and again and it can break that level at any time sooner so we are right now at the trend support and 4h bearish trendline is getting resistance to break.
So u an enter as buyer after successfull break of 1745 area. Till that happy weekend
BEST REGARDS: ARSLAN AKA BINARY TRADER
Goldbullish

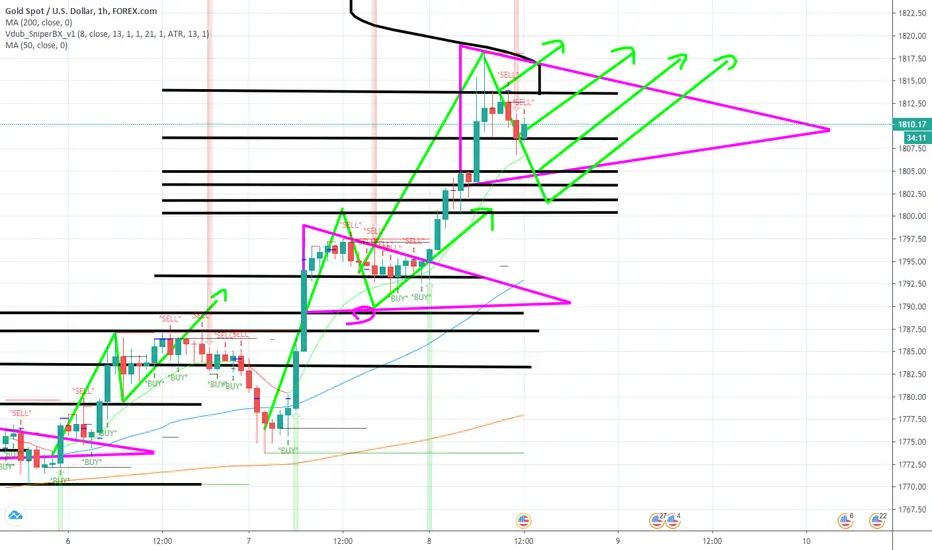
GOLD SIMPLIFY BULLISH SETUP As we can see
gold making falling wedge pattern on 4H timeframe , and potential inverted head and shoulder on 1H timeframe
which mean he will reversal until we got confirmation
the confirmation mean when he making high and higher low and then he making continuation pattern
however gold can be bearish if he still respect the previous resistance @1790
but if he breakout as impulsive trend he will going up at least reach 1860
comment your perspective below !

GOLD BUY TP_2078.36_8.79%_167.96pips_SL_1876.81_1.76%_33.59pipsGOLD BUY TP_2078.36_8.79%_167.96pips_SL_1876.81_1.76%_33.59pips

Gold Analysis 04/10/2020 -- Update 2After taking sells where we banked 90 pips, price broke above the range highlighted on the analysis last night.
Instead of waiting for support to form, I waited for a retest and entered on the retest, so this was effectively a break and retest entry.
As price reached the first target, I secured my entry and moved stops to BE.
Price then reached my next target where I closed more partials leaving a 10% runner and I closed my final positions as we wicked off the resistance zone at 1918.50 securing 140 pips.


Gold Analysis 28/09/2020 -- UpdateGold broke resistance and formed a nice support on lower timeframes, this was good confirmation to take buys, with TP at the wickfill and stops below the previous candle, we secured entries at 35 pips and the runner got stopped out at breakeven. So a nice win for the night

Updated: Gold could be to confirmed that any not see it!!!Hello, in this little updated, Gold is forming a bullish rising wedge channel, taht mean that Gold is so prepared to going up!!!
So, guys, we hope in few hours the formation of the candlestick to entry in long, it is the confirmed this bullish rising wedge channel.


Gold, ready for a new high?From the Gold daily chart, the price, after the breakout of the triangle pattern, came back to retest the bullish support trendline, by missing, for the moment, to close the pullback on the bearish resistance trendline. From here, it could restart to rise towards new highs.


Novo Resources Corp - New Bullish CycleNo retracement yet of the first up-leg, this is just starting!

Gold Fake Out Play at 1,700 Level1-Hour:
Price crossed below the 1,700 level and quickly retraced above it. It tested this level again, but held supported as well. This is the third wave where we're expecting bullish momentum to build up.
1-Day:
This 1,700 level is also apparent on the daily timeframe. However, we might end up seeing this pair range as it pulls away from this level. As a result, as I set a modest first target of 1,722 and will wait to see how momentum plays out closer to that level.

Gold bullish structure formation1-Day:
The 1,700 level is a reversal point. Price dipped to this level and formed a daily doji.
1-Hour:
Over on the hourly, we're also seeing the structure change. Price is beginning to paint higher highs and higher lows. I currently have my entry set at the 1,733 level which is where the moving averages have converged. This is a good potential to ride the next wave higher.

GOLD SUPER LONG-TERM SCENARIOS EXPLAINED GOLD is unstoppable right now and is soon to storm the 1800 key level.
The only question is- what we get to see:
1- An optimistic scenario, drawn with a green line, where there is a retest of support after a breakout towards 1900, and then a strong move up into the 2300/2500+ in 2-3 years.
OR
2-A pessimistic scenario, drawn with a red line, where the breakout turns out to be a false one and GOLD returns below the 1800 level and gets stuck in there for another accumulation period for another 5-10 years.
It is clear by now, that the general uptrend will continue and that a super long term outlook is certainly bullish, but just how bullish is a question for 8 trillion dollars, which is the current total gold market cap.
It is clear that the 1500 level is the new absolute bottom, and that we will never see gold cheaper than that again, so should gold choose the second scenario then buy near 1500-1600 level.(unless Earth isn't hit by a massive asteroid full of gold anytime soon)
An example of what trading will look like in a pessimistic scenario can be seen in the blue rectangle around the lower accumulation zone.
The fundamentals beyond the gold growth are the usual culprits: central banks printing money, fears of inflation, the increased demand for a safe haven other than dollar, negative rates and, possible stagflation.
There is a remote potential for the gold to come back as a funding vehicle, when people, companies and states will be borrowing and transacting in gold. That would have us see gold=10.000 and more.
Guys, hit that like button to support me, subscribe for more analysis and comment, what do you think? Share your experience and wisdom with us!
Wish you all good luck in your trading!


Upside potential on GoldThere's a few indications for us to be bullish on gold:
Price is supported on the daily level at 1455 range
The selloff on gold is slowing down
Specifically, we can see accumulation with every sell off, which is signalled by the bullish green bars
Once offers have been exhausted, we should see gold soar from a series of covers and new entries

GOLD BUY TP_1714.36_7.98%_126.66pips_SL_1562.661.58%_25.04pipsGOLD BUY TP_1714.36_7.98%_126.66pips_SL_1562.661.58%_25.04pips

Gold Hangs on UncertaintyBullish
Coronavirus breaks China Country containment. Target set at 1594.0
Bearish
Coronavirus fades, Chinese Government seems to not be as fourthright as Western World would like them to be about the Coronavirus outbreak. Target 1556.0 ( 2019 High - Strong support )

Gold is going upGold is in buy mode as US impose 17 different banns on Iran Steel mils and Textile mils. Further more on H4 Chart, Gold is making Head and shoulder Pattern which also indicate us for further bullish move.

Gold strongly bullishXauUsd Currently at correction and should find support at green box or trend line 1505-1535. Downside is limited.


