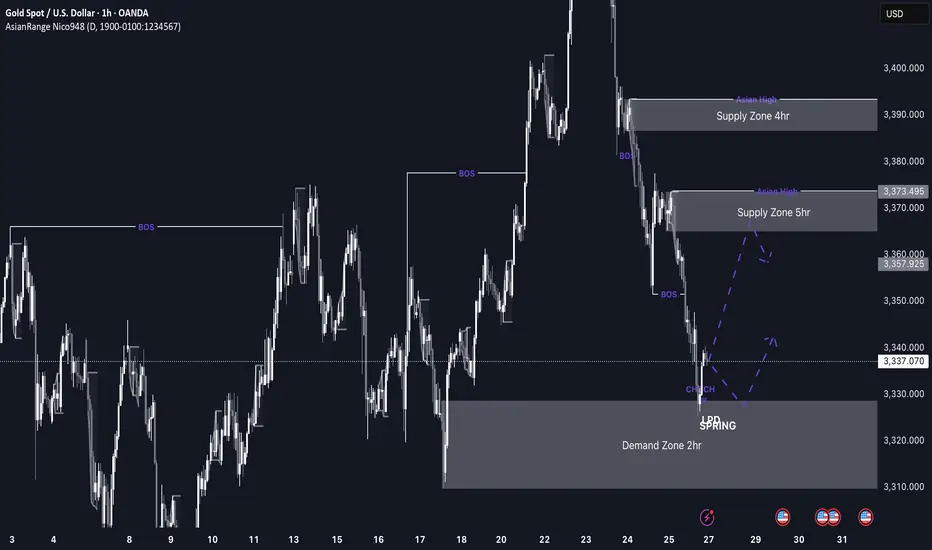
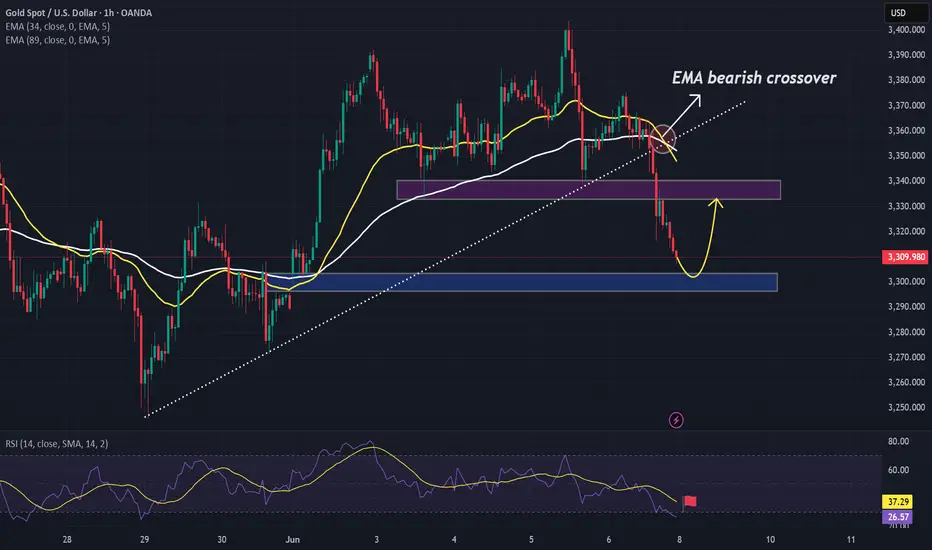
GOLD imminent possible buys up to 3,370 This week’s price action on GOLD is shaping up to be very interesting. After weeks of sustained bearish pressure, price has now entered a discounted 2hr demand zone sitting at a swing low, which makes it a high-probability area for a bullish reaction, especially as markets open.
If we do get the expected bullish reaction from this level, I’ll be watching the 3,370 region, where there’s a clean 5hr supply zone. If price reaches that level, I’ll be looking out for distribution and a potential short setup from there.
Confluences for GOLD Longs:
Price has been very bearish recently, so a retracement is expected
Currently sitting in a discounted 2hr demand zone
The overall long-term trend is still bullish
Early signs of accumulation and bullish reaction from this zone
P.S. If price fails to hold this current demand zone and breaks lower, then bearish momentum may continue. In that case, I’ll look for new long opportunities around 3,290 where a deeper demand zone exists.
Goldbuy
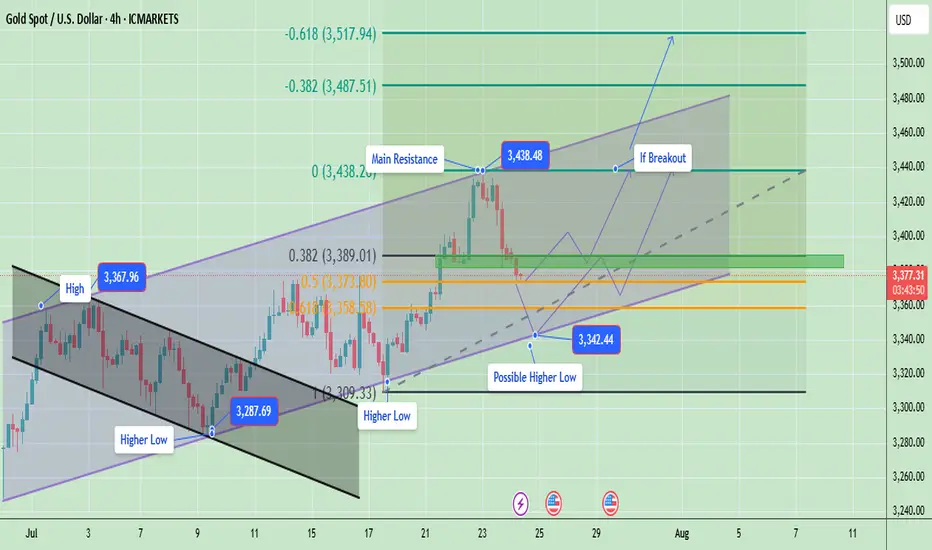
Gold Breakout or Pullback Ahead?Currently, price is in a correction phase within this rising channel after hitting the upper resistance near $3,438. The pullback is moving toward the mid and lower channel zones, which is healthy for a bullish continuation. Gold is in a healthy pullback phase inside a bigger bullish trend. If support at $3,358 – $3,373 holds, expect an upward push back to $3,438 → $3,487 → $3,517 in the coming sessions. Only a clean break below $3,309 would signal a deeper bearish move.
Gold is likely to consolidate or retest the lower channel support ($3,358 – $3,373). If buyers defend this zone, the price is expected to bounce back toward $3,400 – $3,420 and eventually retest $3,438.
Key Price Zones
- Main Resistance: $3,438 (if broken, potential rally toward $3,487 → $3,517)**
- Immediate Support: $3,373 (first reaction level)
- Major Support: $3,358 (key level to protect bullish structure)
- Potential Higher Low Zone: Around $3,342.44
Expected Price Behavior
- If gold holds above $3,373 – $3,358, it is likely to form a new higher low near $3,342 – $3,358 before attempting to push higher.
- A successful breakout above $3,438 would indicate continuation of the bullish momentum targeting $3,487 and $3,517 ).
- Failure to hold above $3,358 may open the door for a deeper correction toward $3,309, but the overall trend remains bullish unless that level is broken.
Trend Outlook
- Short-Term Trend: Consolidation / corrective pullback within a bullish channel
- Medium-Term Trend: Bullish (higher lows and breakout structure intact)
- Long-Term Trend: Bullish as long as the channel holds above $3,309
Gold is currently in a pullback phase after a strong bullish breakout. The market is likely forming a higher low and may resume upward momentum once the $3,373 – $3,358 zone is confirmed as support. A breakout above $3,438 would validate a bullish continuation toward $3,487 - $3,517.
Note
Please risk management in trading is a Key so use your money accordingly. If you like the idea then please like and boost. Thank you and Good Luck!
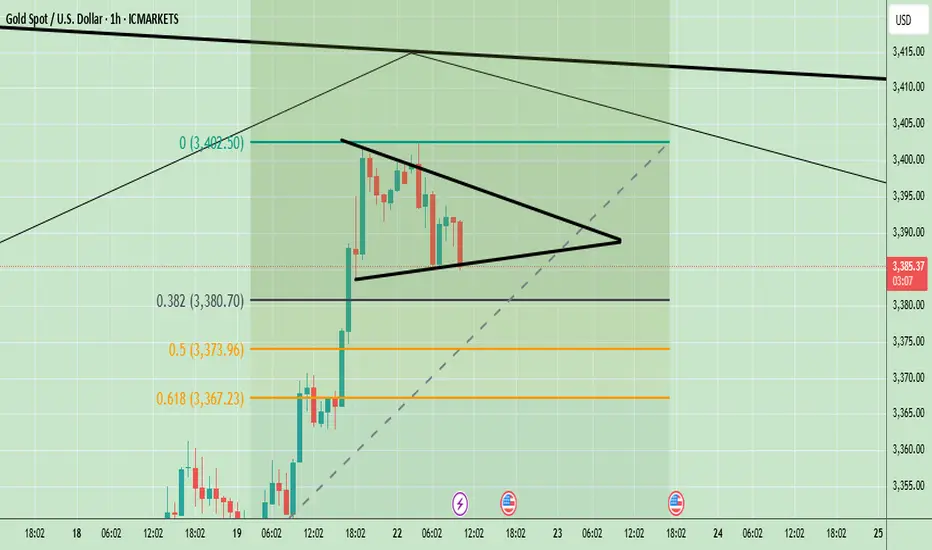
XAUUSD Technical Analysis – Triangle Breakout Ahead?Gold is currently consolidating in a symmetrical triangle pattern around $3,389. If it breaks above $3,402, we can expect a bullish continuation toward $3,420 and beyond. Key support lies at $3,367; a breakdown below this level would turn the trend bearish. The overall trend is still bullish, but a breakout is needed for confirmation.
📈 Potential Scenarios:
✅ Bullish Breakout Scenario:
- Break above $3,392–$3,402 zone.
- Targets: $3,420 > $3,450 > $3,480
- Supported by strong upward BOS (Break of Structure) and higher lows.
❌ Bearish Breakdown Scenario:
- Breakdown below $3,373–$3,367 zone.
- Targets: $3,355 > $3,345
- Would invalidate current bullish structure and form a lower low.
🔮 Trend Bias:
Bullish Bias remains intact as long as price stays above $3,367 and maintains higher lows. However, consolidation suggests waiting for breakout confirmation from the triangle before entering new trades.
🧭 Trend Outlook:
Gold is currently consolidating in a symmetrical triangle pattern, which typically precedes a breakout — either upward or downward. The price is holding above the key Fibonacci support levels and the overall market structure is bullish, suggesting an upward continuation is more likely if buyers maintain momentum.
Note
Please risk management in trading is a Key so use your money accordingly. If you like the idea then please like and boost. Thank you and Good Luck!
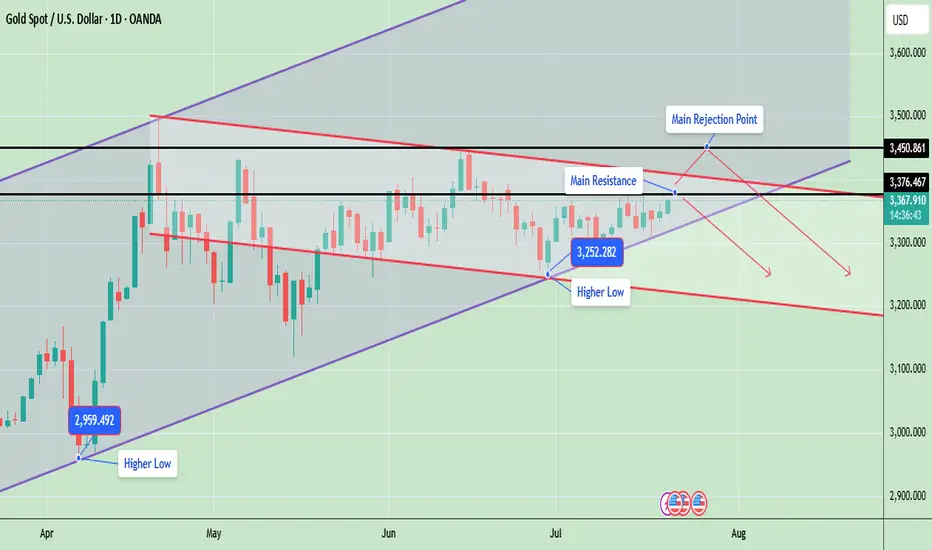
Gold Price Update – Testing Key ResistanceGold is currently trading around 3367, showing strong bullish momentum as it continues to form higher lows, which indicates an ongoing uptrend. The market structure is developing inside a rising wedge pattern, with the price consistently respecting both the ascending support and resistance lines.
Gold is now testing a key resistance zone between 3376 and 3450, an area that previously acted as a major supply zone and caused sharp rejections. A successful breakout and close above 3450 will likely confirm a bullish continuation and may open the door for a rally toward 3500 and possibly 3580. However, if gold fails to break this level, it could retrace back to the 3300 or 3250 support zones, especially if a rejection candle forms in the daily timeframe.
📊 Key Technical Highlights:
- Price has approached the upper resistance boundary of the wedge.
- Daily candle is bullish, indicating strong buying momentum.
- However, unless price closes above 3,376–3,450, there’s still a risk of rejection from the top channel and a pullback toward 3,300–3,250.
🔑 Key levels to watch:
- Gold is currently trading around $3,367, just below a crucial horizontal resistance at $3,376
- A strong breakout above $3,376, and especially above $3,450, could open the door for further bullish movement toward the $3,500–$3,600 range, following the upper trendline of the ascending channel.
- On the downside, if price fails to hold the higher low at $3,252, a drop toward $3,200 or even $3,100 is possible aligning with the downward red trendline.
- The structure remains bullish overall, as price is still making higher lows and staying within the rising channel
📊 Weekly Gold Chart Analysis
Gold is currently trading around $3,368, forming a symmetrical triangle pattern on the weekly timeframe. This pattern typically indicates a period of consolidation before a potential breakout in either direction. The price is getting squeezed between lower highs and higher lows, which is a sign of decreasing volatility and approaching breakout.
🔑 Key Technical Insights:
- ✅ Current Structure: Price has been consolidating within a triangle since April 2025 after a strong upward move. It is now near the apex of the triangle, suggesting a breakout is imminent—most likely in the next 1–2 weeks.
🔼 Bullish Breakout:
- If gold breaks above the triangle resistance (~$3,385–$3,393), it could trigger a sharp rally.
- Upside targets post-breakout: $3,450, $3,500, $3,600+ (if momentum continues)
🔽 Bearish Breakdown:
- A break below the triangle support (~$3,335–$3,325) may lead to a deeper correction.
- Downside targets post-breakdown: $3,285, $3,200
- Possibly $3,100–$3,050 if bearish sentiment intensifies
📉 Volume Drop:
As typical with triangles, volume has likely decreased, signaling indecision. Once volume returns, it will likely confirm the breakout direction.
Note
Please risk management in trading is a Key so use your money accordingly. If you like the idea then please like and boost. Thank you and Good Luck!
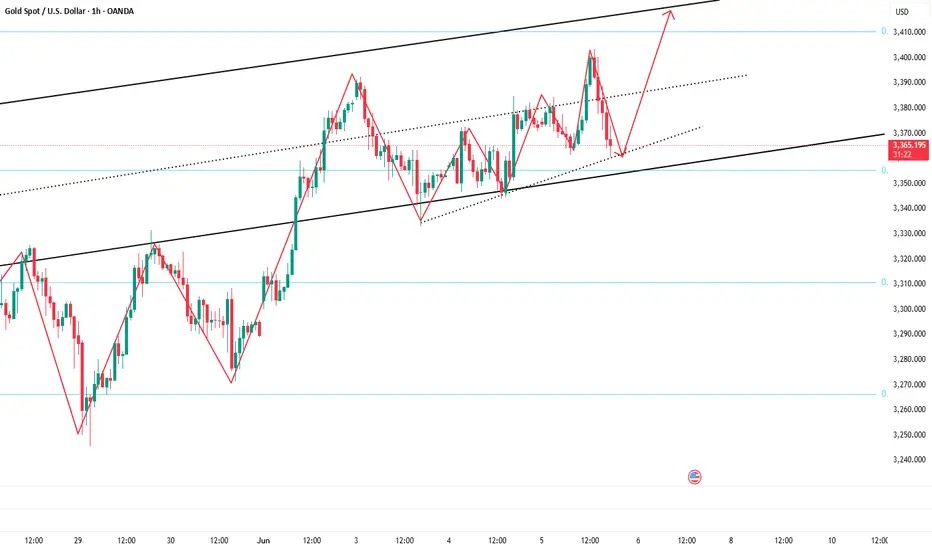
SWING TRADE OPPORTUNITY 〉LONGAs illustrated, I try to visualize what the next bullish impulse could look like if price holds 3300 as a key psychological and algorithmic price level.
Illustrated are the potential buy areas (a current one and an extended one in case a pullback occurs to manipulate lower levels in the next 24-48 hours).
This projection, if valid, could hold from now until next week, so it can be considered a swing trade to hold at least the next week and into the following one).
--
After this post, I will upload another analysis on the Daily timeframe projecting the longer term move, so make sure to go in my profile to check it out.
GOOD LUCK

Gold Holds Key Support Zone📊 Market Summary
– Gold is currently trading at $3,338/oz, hovering near a key technical support level.
– US Treasury yields remain elevated and the USD is strong, both pressuring gold; however, ongoing concerns over US–EU/Mexico trade tensions continue to support safe-haven demand.
– The market is awaiting the upcoming US PPI data to determine the next directional move.
📉 Technical Analysis
• Key Resistance: $3,372 – $3,375 (23.6% Fibonacci zone – short-term ceiling)
• Nearest Support: $3,338 – $3,330 (tested and bounced at 3,338 per Oanda); deeper support at $3,325 – $3,320 if broken
• EMA 9: Price is below the MA20/50/100 but above MA200 (H1); EMA9 is flat, suggesting a sideways/consolidation trend
• Momentum / Indicators:
• RSI around 44–52 – neutral to slightly bullish
• MACD slightly positive; Stochastic above 50, hinting at short-term overbought conditions
📌 Outlook
– Gold is holding above the 3,338–3,330 support zone. If this level holds and rate-cut expectations strengthen, the price may rebound toward 3,372–3,375.
– However, if the USD continues to strengthen and PPI/CPI data surprises to the upside, gold could break support and head lower toward 3,325–3,320.
💡 Trade Strategy Proposal
🟣 SELL XAU/USD at 3,372 – 3,375
🎯 TP: ~ 40 / 80 / 200 pips
❌ SL: ~ 3,378
🟢 BUY XAU/USD at 3,330 – 3,333
🎯 TP: ~ 40 / 80 / 200 pips
❌ SL: ~ 3,327

XAU/USD analysis & outlookWeekly Outlook: GOLD (XAUUSD)
This week, I’ll be monitoring different scenarios, as price is currently far from any of my key Points of Interest (POIs).
My nearest potential buy is around the 3-hour demand zone. While it's not the most ideal entry—since it isn’t located in a discounted area—I’ll still keep an eye on it.
That said, I would prefer to see a deeper retracement into the 6-hour demand zone, which is in a far more discounted region. This zone offers a stronger setup, and I could see price launching from there again if tapped.
We’ve already seen a strong bullish reaction from last week’s demand zone, and based on current momentum, I could see price continuing upward until it reaches my next sell opportunity—the 3-hour supply zone, which sits at a premium level.
Confluences for GOLD Buys:
✅ Bullish structure — price has broken to the upside and remains overall bullish.
✅ Fresh 3H and 6H demand zones formed, which price could return to.
✅ Liquidity above — including trendline liquidity and previous Asia highs.
✅ Fundamentals — potential tariff cuts could fuel long-term bullish momentum for gold.
✅ Bearish Dollar Index (DXY) aligns with the bullish gold outlook.
📌 If price doesn’t retrace and instead continues to push higher, I’ll wait for another break of structure to the upside on the way toward the supply zone before reassessing entries.
Let’s stay focused and let the market come to us. Wishing everyone a great trading week ahead! 👊📈

Gold Rejected at 3329.5, Profit-Taking Pressure Rises📊 Market Overview:
Gold surged to 3329.5, approaching key resistance, but quickly dropped to 3319.8 due to strong selling pressure, signaling short-term profit-taking. It’s now slightly recovering and trading around 3321.
📉 Technical Analysis:
• Key Resistance: 3329 – 3335
• Nearest Support: 3308 – 3285
• EMA 09: Price remains above EMA 09 → uptrend still intact.
• Candlestick / Volume / Momentum: H1 candle shows long upper wick at resistance. High volume at the top suggests profit-taking activity.
📌 Outlook:
Gold may continue a short-term correction if it fails to break above 3330 decisively. Bulls need to hold 3308 to maintain the upward structure.
💡 Suggested Trading Strategy:
🔻 SELL XAU/USD : 3330 – 3333
🎯 TP: 40/80/200 pips
❌ SL: 3336
🔺 BUY XAU/USD at: 3302 – 3305
🎯 TP: 40/80/200 pips
❌ SL: 3399
GOLD BUY ZONES Gold Buy Zone We Have
Bullish Engulfing Area ( 3317 - 3311 )
Order Block Area ( 3304 - 3295 )
Target We Are Expect Previous High Lets Gooo

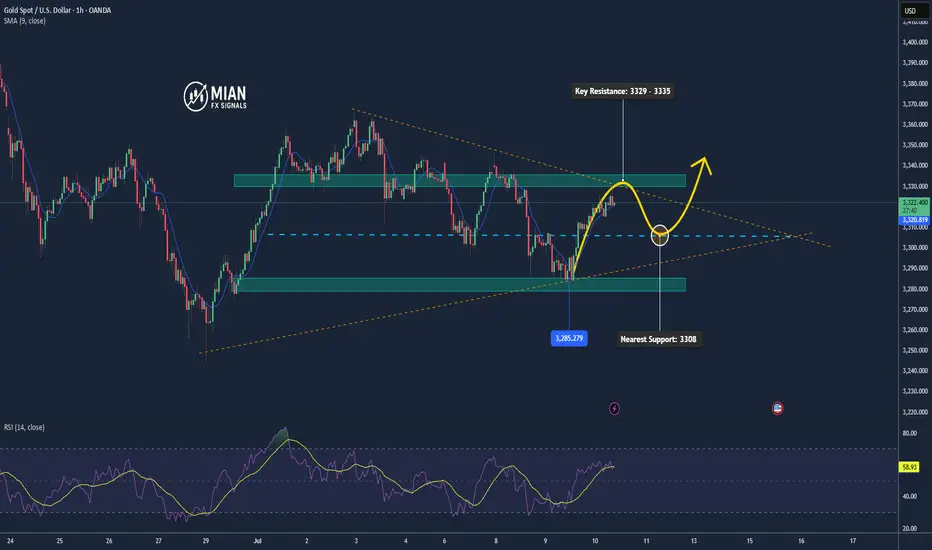
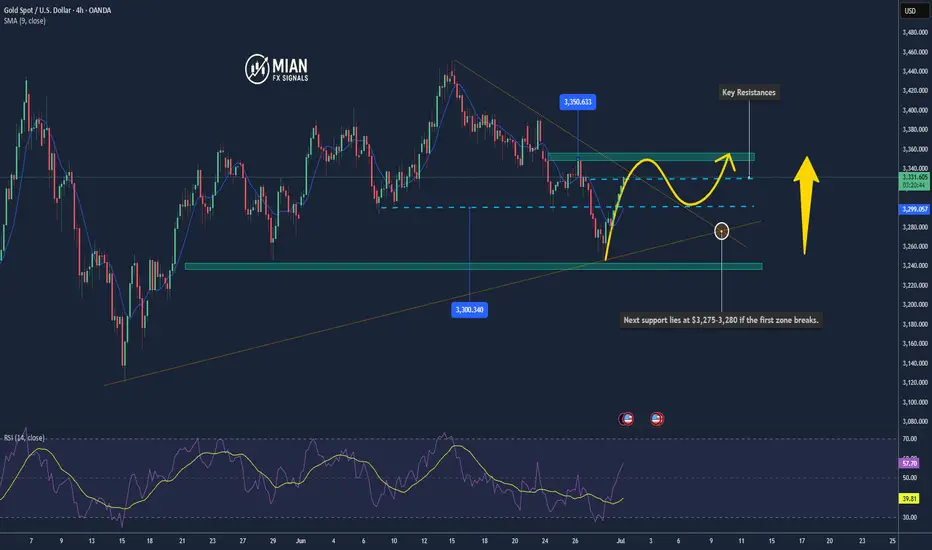
Gold Might Break Higher As It Hits $3,330 Resistance📊 Market Drivers
Gold has just climbed to $3,330/oz, supported by ongoing safe-haven demand and a slightly weaker U.S. dollar ahead of Fed Chair Powell’s speech. Investor expectations of a rate cut in September are keeping bullish momentum alive.
________________________________________
📉 Technical Analysis
• Resistance:
→ $3,330–3,335 (50-day SMA & Fibonacci level)
A breakout above $3,335 could open the door to $3,350+.
• Support:
→ $3,300–3,310 (psychological level & EMA9)
→ Next support lies at $3,275–3,280 if the first zone breaks.
• EMA09:
Price is currently above the 9-EMA, confirming a short-term bullish trend.
• Momentum Indicators:
o MACD is bullish; Stochastics is high — all signaling upside, though a short-term pullback may occur if the resistance holds.
________________________________________
📌 Outlook
Gold is likely to continue climbing in the short term if it breaks above the $3,330–$3,335 resistance zone, fueled by bullish sentiment and dovish Fed expectations.
If it fails to break higher, a minor correction toward $3,300–$3,310 could follow.
________________________________________
💡 Suggested Trade Strategy
BUY XAU/USD : $3,320–3,325
🎯 TP: 40/80/200 pips
❌ SL: $3,310
SELL XAU/USD : $3,340–3,345
🎯 TP: 40/80/200 pips
❌ SL: $3,350
Gold Weekly Friday Trend Analysis and Trading RecommendationsOn Thursday, gold maintained a sideways trend, currently trading near $3,370. It hit a low of $3,347 and then rebounded immediately, while yesterday's Federal Reserve interest rate decision had little impact on market volatility. Since Monday, when bearish forces were stronger than bullish ones, the gold market has been seeing equalized bullish and bearish forces, consolidating as it waits for the next stimulus direction.
Once it stabilizes above $3,400 again, there is likely to be an inflection point, and it will gradually rise to test the upper track at $3,460–3,470. At the 4-hour level, it is currently under pressure at the middle track of $3,405, with support at $3,345.
Gold may break out of the current range on Friday. Intraday trading can focus on range operations between the support of $3,345 and the resistance of $3,400: when the gold price stabilizes above $3,360, you can lightly go long, with targets sequentially at $3,375 and $3,395; if it is resisted below $3,395, you can try to lightly go short.
XAUUSD
buy@3350-3360
tp:3380-3390-3400
Investment itself is not the source of risk; it is only when investment behavior escapes rational control that risks lie in wait. In the trading process, always bear in mind that restraining impulsiveness is the primary criterion for success. I share trading signals daily, and all signals have been accurate without error for a full month. Regardless of your past profits or losses, with my assistance, you have the hope to achieve a breakthrough in your investment.

Gold Pulls Back After Testing Resistance📊 Market Overview:
Gold fell to a low of $3,374 earlier today after testing the $3,434 resistance late last week. The drop was primarily due to profit-taking near recent highs, alongside a mild recovery in the US dollar. Despite this pullback, the medium-term uptrend remains supported by expectations of upcoming Fed rate cuts and persistent geopolitical tensions in the Middle East.
📉 Technical Analysis:
• Key Resistance: $3,434 – $3,450
• Nearest Support: $3,374 – $3.360
• EMA: Price remains above both EMA 09 and EMA 20, suggesting a continuation of the short-term bullish trend.
• Candlestick / Volume / Momentum:
o RSI is holding around 61–63, no longer in overbought territory.
o MACD remains positive, though upward momentum has slowed.
o Bearish candles during the Asian session suggest lingering sell pressure near $3,430. A technical rebound from $3,374 is currently underway.
📌 Outlook:
Gold may consolidate between $3,370–$3,390 in the near term. If the $3,360 support holds, a rebound toward $3,420–$3,440 is likely. However, a stronger USD could increase downside pressure.
💡 Suggested Trade Strategy:
🔻 SELL XAU/USD at: $3,410 – $3,420
🎯 TP: $3,385
❌ SL: $3,430
🔺 BUY XAU/USD at: $3,374 – $3,378
🎯 TP: $3,400 – $3,420
❌ SL: $3,360
Gold Outlook: Bulls Defend Support Amid Rising Geopolitical RiskGold (XAU/USD) remains within a strong bullish structure on the 4-hour chart, trading inside an ascending channel. Recently, price attempted to break above the key resistance near $3,450 but failed, leading to a minor pullback toward the mid-channel area around $3,428–$3,430, where buyers are currently defending support. The key support remains at $3,394–$3,400, which also coincides with the ascending channel’s lower boundary.
As long as price holds above this level, the bullish trend remains intact, and there is potential for a breakout above the $3,450 resistance zone. If a breakout occurs and price closes above $3,450 on the 4-hour chart, the next bullish targets would be around $3,475 and then $3,500–$3,510. On the downside, if price fails to hold $3,394, it may trigger a short-term bearish correction toward the next support zone around $3,380–$3,370.
Overall, gold is currently in a consolidation phase inside the $3,394–$3,450 range, with a bullish bias above $3,394. A breakout above $3,450 may trigger strong upward momentum, while a break below $3,394 could open the door for a deeper correction.
🔑 Key Levels
Support: ~$3,394–$3,400 (channel floor) and intermediate support at $3,430–$3,440 .
Resistance: Immediate resistance zone is $3,445–$3,450, with broader upside potential toward $3,500+ if that break occurs.
Note
Please risk management in trading is a Key so use your money accordingly. If you like the idea then please like and boost. Thank you and Good Luck!

Gold Extends Gains, Eyes 3400📊 Market Overview
• Following softer-than-expected US CPI data, gold surged strongly.
• This morning, gold touched a high of 3377 before pulling back slightly to around 3372.
• A weaker USD and growing expectations of Fed rate cuts remain key bullish drivers.
📉 Technical Analysis
• Key Resistance: $3,380 – $3,400
• Nearest Support: $3,325 – $3,310
• EMA09: Price remains above EMA09, signaling a short-term uptrend.
• Candlestick & Momentum: Gold has broken out of a consolidation zone with strong momentum, though short-term overbought signals are emerging.
📌 Outlook
Gold may enter a mild pullback within the 3370–3380 zone before finding fresh momentum from upcoming Fed signals or macro data. Caution is advised when trading near major resistance.
💡 Trading Strategy
🔻 SELL XAU/USD at: 3375–3377
🎯 TP: 3355
❌ SL: 3385
🔺 BUY XAU/USD at: 3325–3330
🎯 TP: 3350
❌ SL: 3315

GOLD - XAUUSD Long term analysisHello Traders,
Gold is again in a range creating upside wedge. I will be looking for sells to buy from 3280.
On lower time frames (1h) Looks bearish
15m Short term bullish
Let's see how it plays out.
Good luck!

Will gold continue its uptrend from the 3,300 USD level?Hello dear traders!
Gold prices continued to decline against the US Dollar (USD) on Friday, falling below the previous psychological support level, which is now resistance, at 3,350 USD. The main reason was that the US Dollar gained some positive momentum as the market leaned toward the Fed maintaining its current policy in July following the May report, causing XAUUSD to move lower into the weekend.
From a technical perspective, as previously analyzed, gold broke below the psychological support level of 3,350 USD on Friday, with prices approaching the 3,300 USD support level at the time of writing. However, the RSI has dropped to the 30 level, indicating that selling pressure may be losing momentum, and global economic stress could potentially limit further losses.
Gold May Undergo Short-Term Correction Near Resistance Levels📊 Market Overview:
As of June 6, 2025, gold prices have surged, trading around $3,373 per ounce, up $26.63 from the previous session . This increase is driven by weaker-than-expected U.S. job data, with initial jobless claims rising to 247,000, surpassing the forecast of 236,000 . This has heightened expectations that the Federal Reserve may consider cutting interest rates in the near future.
📉 Technical Analysis:
• Key Resistance Levels: $3,390 – $3,430
• Nearest Support Levels: $3,340 – $3,300
• EMA: Gold prices are currently above the 09 EMA, indicating a sustained upward trend.
• Candlestick Patterns / Volume / Momentum: The RSI on the 4-hour chart is at 58.27, suggesting that while bullish momentum persists, the market is approaching overbought territory .
📌 Outlook:
Gold may experience a short-term correction if U.S. employment data is strong, reducing expectations for Fed rate cuts. However, the long-term uptrend remains supported by safe-haven demand and central bank purchases.
💡 Suggested Trading Strategy:
SELL XAU/USD at: $3,430
o 🎯 TP: $3,400
o ❌ SL: $3,440
BUY XAU/USD at: $3,330
o 🎯 TP: $3,360
o ❌ SL: $3,220

GOLD (XAU/USD) Imminent long opportunitiesThis week, my focus for GOLD is on potential long opportunities around the current price level. Price is sitting within a strong area of demand, so my plan is to wait for signs of accumulation and a clear slowdown in bearish momentum before considering any entries.
Ideally, I’d like to see the Asia low swept, which currently lies in the middle of the zone — that would offer even stronger confirmation for a buy setup.
If this current zone doesn’t hold, I have a well-defined 9H demand zone around the 3,220 level, which sits in a more discounted area and aligns well with the overall bullish trend on the higher timeframes.
Confluences for GOLD Buys:
- Clean major daily demand that caused a change of character to the upside
- Plenty of liquidity above and an unmitigated supply higher up
- This is a pro-trend trade, aligning with overall higher timeframe bullishness
- DXY has been bearish over the past few weeks, supporting gold upside
P.S. If price respects this current demand and moves higher, we may see a short-term reaction from the 3H supply zones above — but we’ll monitor price action and adjust accordingly.
Have a great trading week

Gold Bulls in Control: $3,412 Breakout Could Trigger Major RallyGold is currently maintaining a strong bullish structure on the 4H timeframe. Price is forming higher highs and higher lows, following a well-defined ascending trendline starting from the $3,125 region. Buyers are actively defending the structure, showing sustained strength. Short-term consolidation or minor pullback before a breakout. If the price sustains above $3,412, we can expect a continuation to $3,490, followed by $3,553.
✅ Bullish Scenario:
Break and hold above $3,412 confirms bullish momentum.
Target 1 : $3,490
Target 2 : $3,553
❌ Bearish Scenario:
Rejection from $3,412 or $3,490 and break below $3,288 trendline support could trigger downside.
Gold is currently in a strong bullish trend with potential to reach the $3,490 and $3,553 levels in the coming sessions. However, keep an eye on the trendline support and key resistance levels. A clean break and close above $3,412 could be a signal to ride the bullish momentum.
Note
Please risk management in trading is a Key so use your money accordingly. If you like the idea then please like and boost. Thank you and Good Luck!

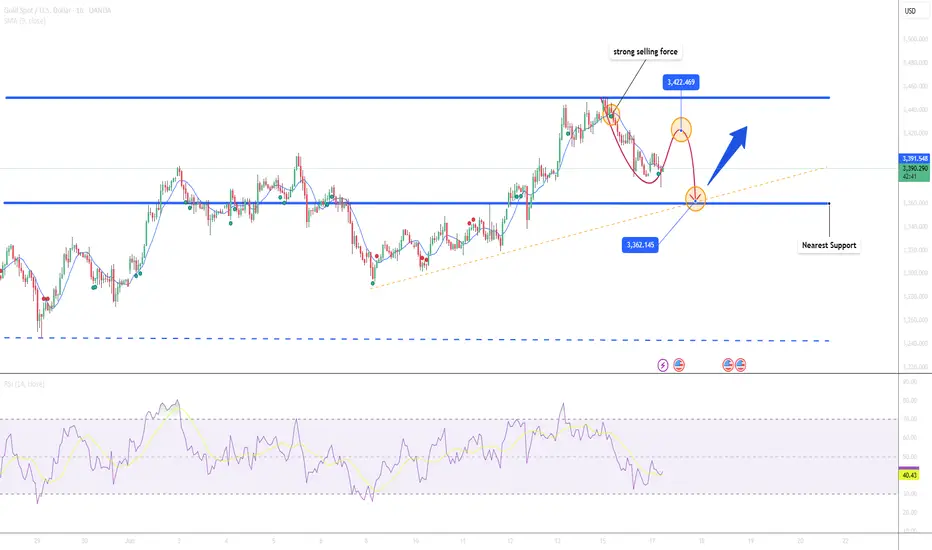
Buy gold, there is still potential to hit 3400Gold gradually fell after touching 3403, and the current lowest has fallen to 3364. Has the gold bull market ended? In fact, I think the gold retracement is a good time to buy, and I am not afraid of gold retracement.
From the overall perspective of the day, gold did not fall below the 3360 mark during today's retracement. This area has become the intraday strength and weakness dividing line. As long as gold can stay above 3360, I think gold still has the potential to continue to rebound. Moreover, the tariff issue and geopolitical conflicts have not been effectively resolved, which is still favorable for gold in terms of fundamentals. Moreover, gold has broken through 3400 twice. I think the bull market will not end easily, and there is still the potential to test 3400 again, and it may even rise to the 3410-3420 area.
Trading strategy:
Consider shorting gold in the 3365-3355 area, TP: 3390-3400
XAU/USD Consolidating Near $3,350 – Watch for Break Above $3,365Gold is currently trading around $3,350, showing signs of consolidation after recent gains. Technical indicators suggest a cautious approach, with key resistance at $3,365 and support at $3,345. Market sentiment remains bullish due to ongoing geopolitical tensions and economic uncertainties. Traders should monitor these levels closely and manage risk appropriately.
📊 Key Levels
Resistance: $3,365, $3,400, $3,450
Support: $3,345, $3,300, $3,285
📈 Trading Strategy
🔸 Bullish Scenario:
Breakout Above $3,365 : Could target $3,400 and potentially $3,450
Support Holding Above $3,345 : May lead to a retest of $3,400
🔸 Bearish Scenario:
Failure to Hold Above $3,345 : May lead to a retest of $3,300 or lower
Break Below $3,300 : Could extend the correction towards $3,285
Note
Please risk management in trading is a Key so use your money accordingly. If you like the idea then please like and boost. Thank you and Good Luck!

Buy gold, TP: 3355-3365Technical aspect:
Gold stopped falling and rebounded after touching 3333. The highest price has only rebounded to 3353. It seems that the bullish potential is weak and the rebound is weak. However, the gold candlestick chart closed with a long lower shadow after touching 3333, proving that there is a certain degree of buying support below; if gold can maintain above 3340-3330 in the short term, gold bulls still have the opportunity to rebound to 3355-3365;
From the perspective of morphological structure, as long as gold remains above 3330, the gold bull structure has not been effectively destroyed, and bulls still have the opportunity to counterattack. It also proves that the buying support below is effective, and the bottoming and rebounding structure is established in the short term, so we can still consider continuing to go long on gold in short-term trading.
Trading strategy:
Consider the 3345-3335 area as support, and try to go long on gold in small batches;TP:3355-3365
