Waiting...3 places im looking for buys today (One will be a straight break and retest if we break the highs), or if we fake-out current days high and take out the current days low i'll be looking for reversals for buys around the 1939.000 level, if that breaks i'll be waiting for price to hit the demand near the 1H low (Close to Ydays imbalance fill) and see if we get confirmation there!
Let me know your thoughts!
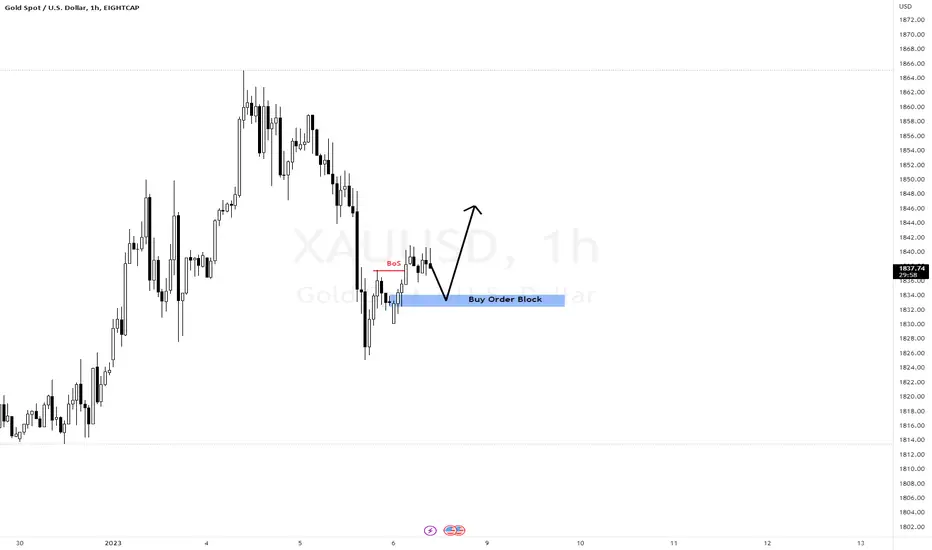
Goldbuy

buy gold1:2 Risk reward gold trade
gold is bullish until 1950 price level
and it will turn bearish there

XAUUSD top-down analysis,UPDATEDHello traders, this is a complete multiple timeframe analysis of this pair. We see could find significant trading opportunities as per analysis upon price action confirmation we may take this trade. Smash the like button if you find value in this analysis and drop a comment if you have any questions or let me know which pair to cover in my next analysis.

Waiting...Gold - waiting to see if price breaks above 1935.890 for a straight daily continuation, if price fakes the HOD it will probably attack the LOD, if so ill be looking for confirmation/buys around 1929.400 and if that breaks i'll be looking for shorts down towards 1916.500!
Let me know your thoughts!

Waiting...Gold: 1921.266 is my zone of interest for London open, I want to see if we bounce or break, if we break with confirmations ill look for short term sells, if we fake-out/close above, ill look to buy back to the top of the range with confirmation!

GOLD possible buy zone!!Currency Pair : GOLD
Possible direction : Bullish
Technical Analysis : On market opening GOLD bulls has grabbed liquidity and prepared for another bullish move. From multiple timeframe perspective all timeframes ( Monthly, Weekly, Daily, 4h and 1H is aligning for bullish setup). As long price action is bullish, and there is no significant resistance for the price to stop, highly likely GOLD will have another take off towards moon!
Possible trade recommendation : Bullish on the retest of the previous resistance turns support
Press like button if you enjoy.
Risk Disclaimer: Trading foreign exchange on margin carries a high level of risk, and is not suitable for all investors. Past performance is not indicative of future results. The high degree of leverage is dangerous and can work against you as well as for you. Before deciding to invest in foreign exchange or any market you should carefully consider your investment goals, level of experience, and risk tolerance. It is EXTREMELY LIKELY that you will sustain a loss of some or all of your initial investment and therefore you should not invest money that you cannot afford to lose. No representation is being made that any account will or is likely to achieve profits or losses. Past performance is not indicative of future results. Individual results vary and no representation is made that clients will or are likely to achieve profits or incur losses comparable to those that may be shown. You acknowledge and agree that no promise or guarantee of success or profitability has been made between you, and Forex Trading Wizard. Do your own research and talk to a professional financial planner in order to be aware of all the risks associated with foreign exchange trading and investing and seek advice from an independent financial advisor before risking any capital.

XAUUSD top-down analysis,UPDATEDHello traders, this is a complete multiple timeframe analysis of this pair. We see could find significant trading opportunities as per analysis upon price action confirmation we may take this trade. Smash the like button if you find value in this analysis and drop a comment if you have any questions or let me know which pair to cover in my next analysis.

Waiting... Gold - Nice BOS on the Daily, D/4H/1H all bullish (Only looking for buys today) Will wait for confirmation around current level or if price breaks will be waiting for reactions around the 1912 zone!
Let me know your thoughts!

Waiting...Looking for buys above 1911.141, or if not I will wait until the buy zone and see if we get confirmation for buys there!
Let me know your thoughts!

XAUUSD top-down analysis,UPDATEDHello traders, this is a complete multiple timeframe analysis of this pair. We see could find significant trading opportunities as per analysis upon price action confirmation we may take this trade. Smash the like button if you find value in this analysis and drop a comment if you have any questions or let me know which pair to cover in my next analysis.

Waiting...Gold looking for buys today while price is above 1916.000, if we break this i'll look for short term sells down towards 1902.000
Let me know your thought!

XAUUSD have chance to long term BULLISH# Disclaimer on, just sharing not advise to buy or sell
I open the chart in very high timeframe which is you can see above in 3 Month. So as you can see long term investment in Gold actually in Bullish Trend although a few times before actually GOLD move in ranging price between 1650 until 2000. But, in the ranging market I believe that the continuation of the market it can be either bullish or bearish after that. Then I have to looking for higher timeframe to see the helicopter view of the market. As you see above the price make a cup handle patterm which is the continuation to become Bull market. Target price of GOLD that I believed is around 3400 $/oz.

AW Gold Analysis - Potentially Huge Rally Chart...Gold is due for its next move higher according to the waves.
This is purely my opinion, take it with a grain of salt.
When Wave 1 is the shortest the Wave 3 and 5 tend to be similar in length which gives us an 8K target.
If you want proof of that then just look at the Wave 3 sub-divisions.
You can see an example of this quite clearly.
This is part of a larger expanding Wave B that is only just in Wave (A) which is the first move in a zig-zag pattern.
These patterns occur in bullish and bearish markets, its all about identifying that for future trading purposes.
If you don't know when to get out then you probably shouldn't get in.
That saying may not be as true for gold seeing as though it's real money and isn't part of the ponza debt system.
However, this may be a good tip of you are trading on margin or simply want to cash out for profit taking purposes.
See the related video idea for this chart linked below.
Remember to use Disciplined Money Management Principles to ensure longevity as a trader.
If you don't know the long term pattern shouldn't you be doing your research instead of just following the crowd?
Just remember: I am not a financial adviser; I suggest using this only as a guide. Always do your own research.

GOLD is about to breakout!Currency Pair : GOLD
Possible direction : Bullish
Technical Analysis : GOLD bulls has primarily first has broken resistance and then again has broken the support to grab strong liquidity grab. Finally price again created strong uptrend with multiple liquidity grab. As the price has strong momentum, it is highly likely price will continue to rise to at least psychological level @Adrien1899
Fundamental : CPI release is fueling the price the bulls!
Possible trade recommendation : Bullish
Press like button if you enjoy.
Risk Disclaimer: Trading foreign exchange on margin carries a high level of risk, and is not suitable for all investors. Past performance is not indicative of future results. The high degree of leverage is dangerous and can work against you as well as for you. Before deciding to invest in foreign exchange or any market you should carefully consider your investment goals, level of experience, and risk tolerance. It is EXTREMELY LIKELY that you will sustain a loss of some or all of your initial investment and therefore you should not invest money that you cannot afford to lose. No representation is being made that any account will or is likely to achieve profits or losses. Past performance is not indicative of future results. Individual results vary and no representation is made that clients will or are likely to achieve profits or incur losses comparable to those that may be shown. You acknowledge and agree that no promise or guarantee of success or profitability has been made between you, and Forex Trading Wizard. Do your own research and talk to a professional financial planner in order to be aware of all the risks associated with foreign exchange trading and investing and seek advice from an independent financial advisor before risking any capital.

Gold Top down analysis, what can we expect? Hey guys, im loving this video recording feature on Tradingview so far, much easier to explain ideas!
So i've done a top down analysis here, from the weekly down to trades im potentially looking to trade tomorrow and what we can potentially expect with CPI tomorrow!
Let me know your thoughts in the comments, thanks guys!

Gold - First Video... Waiting....Gold - PA a little choppy, still looking for buys overall, there was a nice entry there from the demand mitigation a few hours ago on the engulfing. (I was sleeping though) but marked it for reference, Im waiting to see what price does at the HOD, if we make structure above 1875.300 i'll look to buy towards the weekly S/R, I wont be looking for any longer term sells until we break back below 1865.000, lets see what London open brings!
Let me know your thoughts!

GOLD short term buy opportunity!!Currency Pair : GOLD
Possible direction : Bullish
Technical Analysis : Price has broken out of daily resistance and showing strong bullish momentum after opening with a gap up on daily and 4h. In 15 minutes timeframe we can price has broken out of consolidation and started up trend. On the retest of previous resistance turn support, a buy trade is high probable.
Fundamental : Weaker NON farm employment data weaken USD
Possible trade recommendation : short term bullish as per sketch
Press like button if you enjoy.
Risk Disclaimer: Trading foreign exchange on margin carries a high level of risk, and is not suitable for all investors. Past performance is not indicative of future results. The high degree of leverage is dangerous and can work against you as well as for you. Before deciding to invest in foreign exchange or any market you should carefully consider your investment goals, level of experience, and risk tolerance. It is EXTREMELY LIKELY that you will sustain a loss of some or all of your initial investment and therefore you should not invest money that you cannot afford to lose. No representation is being made that any account will or is likely to achieve profits or losses. Past performance is not indicative of future results. Individual results vary and no representation is made that clients will or are likely to achieve profits or incur losses comparable to those that may be shown. You acknowledge and agree that no promise or guarantee of success or profitability has been made between you, and Forex Trading Wizard. Do your own research and talk to a professional financial planner in order to be aware of all the risks associated with foreign exchange trading and investing and seek advice from an independent financial advisor before risking any capital.

Gold Short-Term BuyExpecting Gold to go into a buy on the hourly chart if price 1870.00 is broken. The price has acted as a strong resistance point after Friday's rise due to USD employment rate data release. If the pairing does go into a buy I am expecting retracement at price 1878.00 , then to continue onward to resistance. I have based my analysis on the last time Gold saw current price points in May 2022.
Buy Entry: 1870.00
Targets: 1872.50 | 1874.50 | 1877.00 | 1881.00 | 1883.00 | 1885.50
Resistance: 1888.50
Be sure to like this post and let me know what you think in the comments below.

20 Reason for buy GOLD🔆MULTI-TIME FRAME TOP-DOWN ANALYSIS OVERVIEW☀️
1 ✨Eagle eye: Super bullish
2 📆Monthly: the current trend is bear, but the market is in the corrective phase right now
3 📅Weekly: formed an inducement right now market in their sideways phase
4 🕛Daily: A clean bull trend with the proper formation and previous supports
😇7 Dimension analysis
🟢 analysis time frame: Daily
5: 1 Price Structure: bullish
6: 2 Pattern Candle Chart: elite correction wave
7: 3 Volume: bullish control
8: 4 Momentum UNCONVENTIONAL Rsi: sideways, yet we just need close above 60; then next move will confirm
9: 5 Volatility measure Bollinger bands: middle band support on the bullish side
10: 6 Strength ADX: bull are in strength
11: 7 Sentiment ROC: gold is stronger then USD
✔️ Entry Time Frame: h4
12: Entry TF Structure: bullish
13: entry move: impulse
14: Support resistance base: 2 times supported at daily OB
15: FIB: trigger event occurred
☑️ final comments: FVG filled out so we can buy now
16: 💡decision: buy
17: 🚀Entry:1852/1838
18: ✋Stop losel: 1732
19: 🎯Take profit:1900
20: 😊Risk to reward Ratio: 1:7
🕛 Excepted Duration : 2 week months

Buy GOLD From 1850 Restest AreaHello ! This Is My GOLD Forecast For Next Week.
Gold Price May Be Touch 1875 Resistance Area Next Week , After That It Will Fall To Support Area 1850 .
So You Can Buy From 1850 Area For A Target 1910 Area .
I Hope We Will Make Good Profit From Gold .
Thank You

Gold Idea H1Happy new year 2023! Here is my view for XAUUSD on H1. The price could go up, you can put a pending order on the Order block or find an entry on LTF within OB Zone. Trade Safe!
XAUUSD top-down analysis,UPDATEDHello traders, this is a complete multiple timeframe analysis of this pair. We see could find significant trading opportunities as per analysis upon price action confirmation we may take this trade. Smash the like button if you find value in this analysis and drop a comment if you have any questions or let me know which pair to cover in my next analysis.

XAUUSD top-down analysis,UPDATEDHello traders, this is a complete multiple timeframe analysis of this pair. We see could find significant trading opportunities as per analysis upon price action confirmation we may take this trade. Smash the like button if you find value in this analysis and drop a comment if you have any questions or let me know which pair to cover in my next analysis.
