Goldbuy


GOLD Bullish confirmed on 4HPrice has already broke above the descending interior 4H channel, By the opening of market we enter buy directly, 1764.00 is a partial TP.

GOLD: New Setup That Can Make You Catch +450 PIPS !new setup on gold is available in this video around 1729.50 "a previous high level on daily time frame" wit a stop loss around 70 pips


I'm Going Bear. (GOLD)I am shorting gold with roughly 2.5% Stop of 1750.
Weekly starting to whip around and we keep hitting off of upward resistance.
Would be nice to get a drop off to the bottom green line of upward support.
If I do get stopped out it's not a big deal. We always play 1-3% stop.
3day is firing red with a Crossover and ema dots are firing red.
Want to see some sell off pressure to get that weekly to trigger for a nice bearish close.
Best of luck,
🥇MLT | MAJOR LEAGUE TRADER


GOLD BUY SIGNALHey tradomaniacs,
welcome to another free trade-plan .
Important: This is meant to be a preparation for you. As always we will have to wait for a confirmation.
Gold (XAU/USD): Daytrade-Execution
Market-Buy-Order: 1700,30
Stop-Loss: 1688,20
Target 1: 1710,70
Target 2: 1721,10
Target 3: 1730,00
Stop-Loss: 118 (1180) pips
Risk: 1%
RIsk-Reward: 2,52
LEAVE A LIKE AND A COMMENT - I appreciate every support! =)
Peace and good trades
Irasor
Wanna see more? Don`t forget to follow me.
Any questions? PM me. :-)

Gold Fake Out Play at 1,700 Level1-Hour:
Price crossed below the 1,700 level and quickly retraced above it. It tested this level again, but held supported as well. This is the third wave where we're expecting bullish momentum to build up.
1-Day:
This 1,700 level is also apparent on the daily timeframe. However, we might end up seeing this pair range as it pulls away from this level. As a result, as I set a modest first target of 1,722 and will wait to see how momentum plays out closer to that level.

Gold XAUUSD Possible Cup & Handle FormationSeeing a possible cup & handle formation on Gold. Volume decreased while forming the bottom of the cup and a spike increase while testing the highs. Buy zone at 1440-1540. Take profit 1 at highs and 2 at 2150 USD.


GOLD BUYAfter a rejcetion of 1700.000 looking for Gold to come back to 1720.000 then BUY all the way up to 1790.000


Gold bullish structure formation1-Day:
The 1,700 level is a reversal point. Price dipped to this level and formed a daily doji.
1-Hour:
Over on the hourly, we're also seeing the structure change. Price is beginning to paint higher highs and higher lows. I currently have my entry set at the 1,733 level which is where the moving averages have converged. This is a good potential to ride the next wave higher.


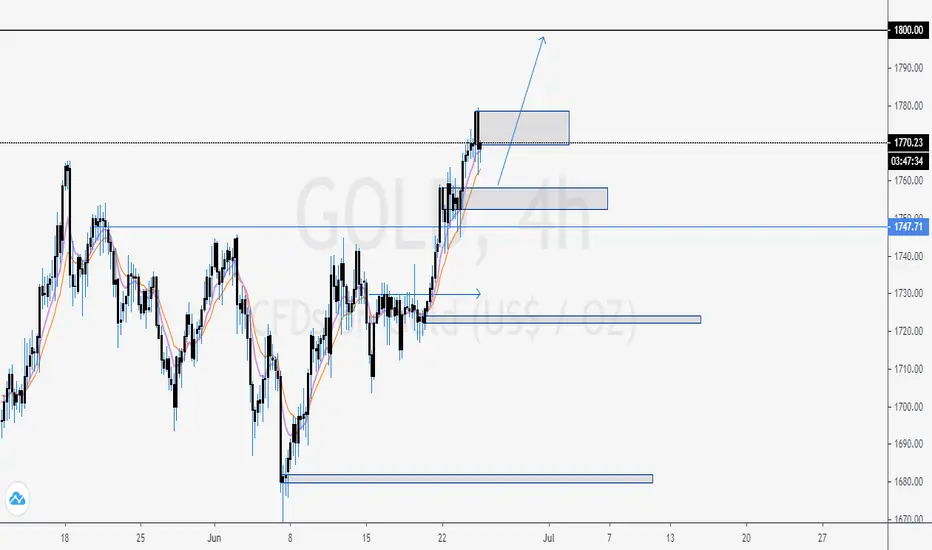
Gold (XAUUSD) to reach 1750 again? Possible 1800?Because price is in a overall uptrend, we might see Gold still push higher as on the Daily timeframe, we have a potential breakout and retest of that breakout level. On the smaller timeframe as shown above, we have a breakout and retest of the broken trendline and previous support level to lock in sellers. We might see selers getting trapped and price push higher.


