XAU/USD 11 April 2025 Intraday AnalysisH4 Analysis:
-> Swing: Bullish.
-> Internal: Bullish.
Price has printed as per my analysis dated 04 April 2025 by targeting weak internal high and printing bullish iBOS.
We currently do not have an indication of bearish pullback phase initiation. Current CHoCH positioning is denoted with a blue dotted line.
Intraday Expectation:
Price to indicate bearish pullback phase initiation by printing bearish CHoCH.
It is possible for price to potentially print higher highs in order to reposition CHoCH closer to current price action.
Note:
With the Federal Reserve's dovish stance and persisting geopolitical uncertainties, heightened volatility in Gold is expected to continue. Traders should proceed with caution and adjust risk management strategies in this high-volatility environment.
Price could also be driven by President Trump's policies, geopolitical moves and economic decisions which are sparking uncertainty.
H4 Chart:
M15 Analysis:
-> Swing: Bullish.
-> Internal: Bullish.
As mentioned in yesterday's analysis that I will continue to monitor internal structure following the printing of a bearish CHoCH.
Price has continued higher without a meaningful pullback, therefore, I will not classify previous iBOS, which is marked in red, as a bullish iBOS.
Intraday Expectation:
Price to indicate bearish pullback phase initiation by printing bearish CHoCH. Current CHoCH positioning is denoted with a blue dotted line.
Note:
With the Federal Reserve maintaining a dovish stance and ongoing geopolitical tensions, volatility in Gold prices is expected to remain elevated. Traders should exercise caution, adjust risk management strategies, and stay prepared for potential price whipsaws in this high-volatility environment.
Trump's tariff announcement will most likely cause considerably increased volatility and whipsaws.
M15 Chart:
Golddollar

XAU/USD 10 April 2025 Intraday Analysis H4 Analysis:
-> Swing: Bullish.
-> Internal: Bullish.
Analysis and bias remains the same as analysis dated 04 April 2025.
Since last analysis price has printed a bearish CHoCH which is the first indication, but not confirmation of bearish pullback phase initiation.
Price is now trading within an established internal range.
Intraday Expectation:
Price to trade down to either discount of internal 50% EQ, or H4 demand zone before targeting weak internal high priced at 3,187,835
Note:
With the Federal Reserve's dovish stance and persisting geopolitical uncertainties, heightened volatility in Gold is expected to continue. Traders should proceed with caution and adjust risk management strategies in this high-volatility environment.
Price could also be driven by President Trump's policies, geopolitical moves and economic decisions which are sparking uncertainty.
H4 Chart:
M15 Analysis:
-> Swing: Bullish.
-> Internal: Bullish.
Price has printed as I mentioned in yesterday's analysis whereby I commented that it would be worthwhile to note that price could potentially print a bullish iBOS as H4 TF has printed a bullish reaction from discount of 50% EQ.
Price subsequently printed a bearish CHoCH, however, price quickly once again formed a higher high, therefore, I will apply discretion and not classify previous CHoCH in order not to distort internal structure as the move was most probably an outlier due to Trump announcing 90 day pause on tariffs.
Price has printed a further bearish CHoCH, however, I will continue to monitor price.
Price is now trading within an established internal range.
Intraday Expectation:
Price to continue bearish, react at either discount of 50% internal EQ, or M15 demand zone, of which one is well positioned at 50% of internal EQ, before targeting weak internal high priced at 3,132.630
Note:
With the Federal Reserve maintaining a dovish stance and ongoing geopolitical tensions, volatility in Gold prices is expected to remain elevated. Traders should exercise caution, adjust risk management strategies, and stay prepared for potential price whipsaws in this high-volatility environment.
Trump's tariff announcement will most likely cause considerably increased volatility and whipsaws.
M15 Chart:

Gold Jumps 3% on U.S.-China Tariff BattleGold jumped over 3% to above $3,095 per ounce on Wednesday as U.S.-China trade tensions escalated. President Trump announced a 90-day tariff pause and a reduced 10% rate for all but China, which now faces a 125% tariff. Treasury Secretary Bessent said the lower rate would apply during talks, excluding China and some sectors. In response, China raised tariffs on U.S. goods to 84%, and the EU approved levies on €21 billion worth of American exports. Fed minutes showed policymakers expect higher inflation from tariffs but remain uncertain about its scale and duration.
Supporting gold’s rally further, the World Gold Council reported that gold-backed ETFs attracted 226.5 metric tons in inflows during Q1, totaling $21.1 billion in value.
Key resistance is at $3,135, followed by $3,165 and $3,200. Support stands at $3030, then $3010 and $2956.
Gold Experiences Surge with Economic FearsGold soared to around $3,000 per ounce as investors sought refuge from intensifying trade war concerns and recession risks. The U.S. confirmed a new round of tariffs with no exemptions, China faces a record 104% hike. Trump also warned of a forthcoming pharmaceutical import tariff. The market is now focused on the Fed's March meeting minutes, set for release later today, for potential rate cut clues. Ongoing central bank purchases and strong ETF demand, China’s ETF added 233,000 ounces, also supported the rally.
Key resistance is at $3,035, followed by $3,085 and $3,105. Support stands at $2,956, then $2,930 and $2830.

XAU/USD 09 April 2025 Intraday AnalysisH4 Analysis:
-> Swing: Bullish.
-> Internal: Bullish.
Analysis and bias remains the same as analysis dated 04 April 2025.
Since last analysis price has printed a bearish CHoCH which is the first indication, but not confirmation of bearish pullback phase initiation.
Price is now trading within an established internal range.
Intraday Expectation:
Price to trade down to either discount of internal 50% EQ, or H4 demand zone before targeting weak internal high priced at 3,187,835
Note:
With the Federal Reserve's dovish stance and persisting geopolitical uncertainties, heightened volatility in Gold is expected to continue. Traders should proceed with caution and adjust risk management strategies in this high-volatility environment.
Price could also be driven by President Trump's policies, geopolitical moves and economic decisions which are sparking uncertainty.
H4 Chart:
M15 Analysis:
-> Swing: Bullish.
-> Internal: Bearish.
Analysis and bias remains the same as yesterday's analysis dated 08 April 2025.
However, it would be worthwhile to note that price could potentially print a bullish iBOS as H4 TF has printed a bullish reaction from discount of 50% EQ.
Price has printed as per yesterday's analysis by targeting weak internal low and printing a bearish iBOS.
Price has subsequently printed a bullish CHoCH (I mentioned in yesterday's analysis bullish iBOS in error) indicating bullish phase initiation.
Price is now trading within an established internal range and appears to be stuck in between close supply and demand zones where we could see extended rangebound conditions.
Intraday Expectation:
Price to continue bullish, react at either premium of internal 50% EQ, or M15 supply zone before targeting weak internal low priced at 2,956.565
Note:
With the Federal Reserve maintaining a dovish stance and ongoing geopolitical tensions, volatility in Gold prices is expected to remain elevated. Traders should exercise caution, adjust risk management strategies, and stay prepared for potential price whipsaws in this high-volatility environment.
Trump's tariff announcement will most likely cause considerably increased volatility and whipsaws.
M15 Chart:

XAU/USD 08 April 2025 Intraday AnalysisH4 Analysis:
-> Swing: Bullish.
-> Internal: Bullish.
Analysis and bias remains the same as analysis dated 04 April 2025.
Since last analysis price has printed a bearish CHoCH which is the first indication, but not confirmation of bearish pullback phase initiation.
Price is now trading within an established internal range.
Intraday Expectation:
Price to trade down to either discount of internal 50% EQ, or H4 demand zone before targeting weak internal high priced at 3,187,835
Note:
With the Federal Reserve's dovish stance and persisting geopolitical uncertainties, heightened volatility in Gold is expected to continue. Traders should proceed with caution and adjust risk management strategies in this high-volatility environment.
Price could also be driven by President Trump's policies, geopolitical moves and economic decisions which are sparking uncertainty.
H4 Chart:
M15 Analysis:
-> Swing: Bullish.
-> Internal: Bearish.
Price has printed as per yesterday's analysis by targeting weak internal low and printing a bearish iBOS.
Price has subsequently printed a bullish CHoCH (I mentioned in yesterday's analysis bullish iBOS in error) indicating bullish phase initiation.
Price is now trading within an established internal range and appears to be stuck in between close supply and demand zones where we could see extended rangebound conditions.
Intraday Expectation:
Price to continue bullish, react at either premium of internal 50% EQ, or M15 supply zone before targeting weak internal low priced at 2,956.565
Note:
With the Federal Reserve maintaining a dovish stance and ongoing geopolitical tensions, volatility in Gold prices is expected to remain elevated. Traders should exercise caution, adjust risk management strategies, and stay prepared for potential price whipsaws in this high-volatility environment.
Trump's tariff announcement will most likely cause considerably increased volatility and whipsaws.
M15 Chart:

Gold Stabilizes Near 3-Week LowGold steadied around $3,030 per ounce on Monday after falling over 1% to a three-week low. The drop sparked speculation that investors were taking profits or covering losses amid broader market declines driven by recession fears from escalating trade tensions. Fed Chair Jerome Powell warned that tariffs could raise inflation and slow growth, underscoring challenges for policymakers.
Key resistance is at $3,050, followed by $3,085 and $3,105. Support stands at $2,980, then $2,930 and $2830.

XAU-USD 07-11 April 2025 Weekly AnalysisWeekly Analysis:
Swing Structure -> Bullish.
Internal Structure -> Bullish.
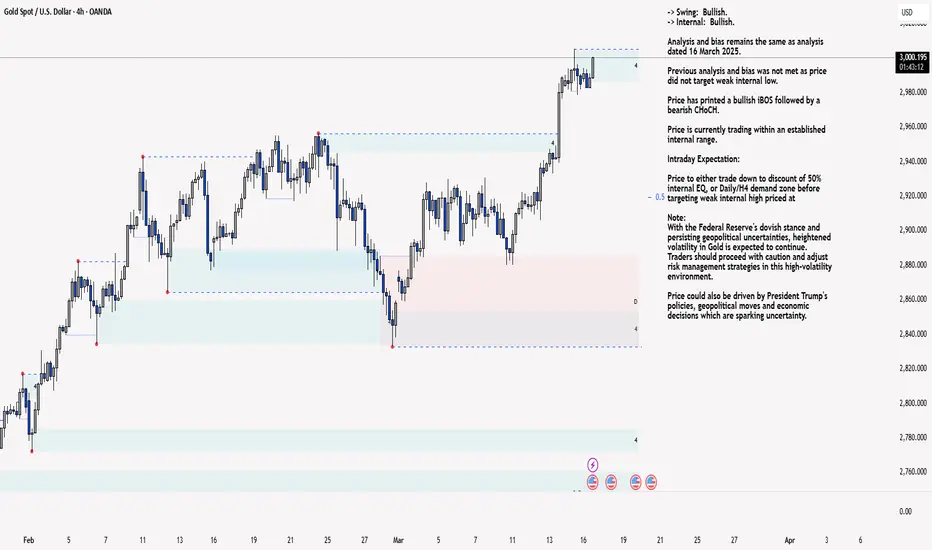
Analysis and bias remains the same as analysis dated 16 March 2025.
In my analysis dated 27 October 2024 I mentioned (below) that price could potentially print higher in order to reposition CHoCH. This is exactly how price printed. CHoCH positioning has been brought significantly closer to current price action.
The remainder of my analysis and bias remains the same as analysis dated 09 February 2025.
Price has printed a further bullish iBOS.
Price is currently trading within an internal low and fractal high. CHoCH positioning is denoted with a blue dashed line.
Price Action Analysis:
In my analysis dated 27 October 2024, it was noted that the first sign of a pullback would be a bearish Change of Character (CHoCH), indicated by a blue dotted line. Price's consistent upward momentum had repositioned previous CHoCH much closer to recent price levels as expected for weeks. Current CHoCH positioning is quite a distance away from price, therefore, it would be viable if price continued bullish to reposition ChOCH.
Note:
It is highly unlikely price will "crash" as many analysts are predicting. My view is this is merely a corrective wave of the primary trend.
Given the Federal Reserve's dovish policy stance alongside heightened geopolitical risks, market volatility is likely to remain elevated, influencing intraday price swings.
Price could also be driven by President Trump's policies, geopolitical moves and economic decisions which are sparking uncertainty.
Weekly Chart:
Daily Analysis:
Swing -> Bullish.
Internal -> Bullish.
Price continued bullish repositioning bearish CHoCH positioning closer to current price action.
Price is now trading within an internal low and fractal high.
Price has very nearly printed a bearish which is the first indication, but not confirmation, of bearish pullback phase initiation.
Expectation is for price to print bearish CHoCH to indicate, bearish pullback phase initiation. CHoCH positioning is denoted with a blue dotted line.
Note:
With the Fed maintaining a dovish policy stance and the continued rise in geopolitical tensions, we should anticipate elevated market volatility, which may impact both intraday and longer-term price action.
Price could also be driven by President Trump's policies, geopolitical moves and economic decisions which are sparking uncertainty and the repricing of Gold.
Daily Chart:
H4 Analysis:
-> Swing: Bullish.
-> Internal: Bullish.
Analysis and bias remains the same as analysis dated 04 April 2025.
Since last analysis price has printed a bearish CHoCH which is the first indication, but not confirmation of bearish pullback phase initiation.
Price is now trading within an established internal range.
Intraday Expectation:
Price to trade down to either discount of internal 50% EQ, or H4 demand zone before targeting weak internal high priced at 3,187,835
Note:
With the Federal Reserve's dovish stance and persisting geopolitical uncertainties, heightened volatility in Gold is expected to continue. Traders should proceed with caution and adjust risk management strategies in this high-volatility environment.
Price could also be driven by President Trump's policies, geopolitical moves and economic decisions which are sparking uncertainty.
H4 Chart:

XAU/USD 04 April 2025 Intraday AnalysisH4 Analysis:
-> Swing: Bullish.
-> Internal: Bullish.
Since last analysis price has printed a bearish CHoCH which is the first indication, but not confirmation of bearish pullback phase initiation.
Price is now trading within an established internal range.
Intraday Expectation:
Price to trade down to either discount of internal 50% EQ, or H4 demand zone before targeting weak internal high priced at 3,187,835
Note:
With the Federal Reserve's dovish stance and persisting geopolitical uncertainties, heightened volatility in Gold is expected to continue. Traders should proceed with caution and adjust risk management strategies in this high-volatility environment.
Price could also be driven by President Trump's policies, geopolitical moves and economic decisions which are sparking uncertainty.
H4 Chart:
M15 Analysis:
-> Swing: Bullish.
-> Internal: Bearish.
Price has printed as per yesterday's alternative scenario whereby price has printed a bearish iBOS due to H4 TF being in, although not as yet confirmed, in bearish pullback phase.
Intraday Expectation:
Price has already traded up to premium of internal 50% EQ, therefore, price to target weak internal low priced at
Note:
With the Federal Reserve maintaining a dovish stance and ongoing geopolitical tensions, volatility in Gold prices is expected to remain elevated. Traders should exercise caution, adjust risk management strategies, and stay prepared for potential price whipsaws in this high-volatility environment.
Trump's tariff announcement will most likely cause considerably increased volatility and whipsaws.
M15 Chart:

XAU/USD 03 April 2025 Intraday AnalysisH4 Analysis:
-> Swing: Bullish.
-> Internal: Bullish.
Since last analysis price has continued extremely bullish. This is most likely due to market jitters caused by Trump's tariff policy which is driving up the price of gold.
This solidifies gold as a safe haven asset and could lead to repricing.
As mentioned in previous analysis that I will continue to monitor price.
Price has printed a bullish iBOS which is marked in red, this is due to the fact that the depth of the pullback has been shallow and has not pulled back into either discount of internal 50% EQ or mitigated a H4 demand zone.
As a result, price now is trading within an internal low and fractal high.
Intraday Expectation:
Await for price to print a bearish CHoCH to indicate bearish pullback phase initiation.
CHoCH positioning is denoted with a blue dotted line.
Note:
With the Federal Reserve's dovish stance and persisting geopolitical uncertainties, heightened volatility in Gold is expected to continue. Traders should proceed with caution and adjust risk management strategies in this high-volatility environment.
Price could also be driven by President Trump's policies, geopolitical moves and economic decisions which are sparking uncertainty.
H4 Chart:
M15 Analysis:
-> Swing: Bullish.
-> Internal: Bullish.
Analysis and bias remains the same as yesterday's analysis dated 01 April 2025
Since last analysis price has continued extremely bullish. This is most likely due to market jitters caused by the trump tariffs.
This solidifies gold as a safe haven asset and could lead to repricing.
You will note price has printed a bullish followed by a bearish CHoCH to indicate, but not confirm, bearish pullback phase initiation.
Whilst I am aware that price has not traded into discount of internal 50% or mitigated any demand zone, I will mark this as an iBOS due to time spent.
Intraday Expectation:
Price to trade down to either discount of 50% internal EQ or M15 demand zone before targeting weak internal high, priced at 3,167.835.
Alternative scenario:
As H4 appears to be in bearish pullback phase, although we do not currently have any indication, it would not come a surprise if price prints a bearish iBOS.
Note:
With the Federal Reserve maintaining a dovish stance and ongoing geopolitical tensions, volatility in Gold prices is expected to remain elevated. Traders should exercise caution, adjust risk management strategies, and stay prepared for potential price whipsaws in this high-volatility environment.
M15 Chart:

XAU/USD 02 April 2025 Intraday AnalysisH4 Analysis:
-> Swing: Bullish.
-> Internal: Bullish.
Since last analysis price has continued extremely bullish. This is most likely due to market jitters caused by Trump's tariff policy which is driving up the price of gold.
This solidifies gold as a safe haven asset and could lead to repricing.
Price has printed a bearish CHoCH indicating, but not confirming bearish pullback phase initiation.
Price is now contained within an established internal structure. I will however continue to monitor price to evaluate depth of pullback.
Intraday Expectation:
Price to trade down to either discount of internal 50% EQ or H4 demand zone before targeting weak internal high priced at 3,149.090.
Note:
With the Federal Reserve's dovish stance and persisting geopolitical uncertainties, heightened volatility in Gold is expected to continue. Traders should proceed with caution and adjust risk management strategies in this high-volatility environment.
Price could also be driven by President Trump's policies, geopolitical moves and economic decisions which are sparking uncertainty.
H4 Chart:
M15 Analysis:
-> Swing: Bullish.
-> Internal: Bullish.
Analysis and bias remains the same as yesterday's analysis dated 01 April 2025
Since last analysis price has continued extremely bullish. This is most likely due to market jitters caused by the trump tariffs.
This solidifies gold as a safe haven asset and could lead to repricing.
You will note price has printed a bearish CHoCH which indicates, but does not confirm, bearish pullback phase initiation. I will however continue to monitor price.
Intraday Expectation:
Price to trade down to either discount of 50% internal EQ or M15 demand zone before targeting weak internal high, priced at 3,149.090.
Note:
With the Federal Reserve maintaining a dovish stance and ongoing geopolitical tensions, volatility in Gold prices is expected to remain elevated. Traders should exercise caution, adjust risk management strategies, and stay prepared for potential price whipsaws in this high-volatility environment.
M15 Chart:

XAU/USD 01 April 2025 Intraday AnalysisH4 Analysis:
-> Swing: Bullish.
-> Internal: Bullish.
Since last analysis price has continued extremely bullish. This is most likely due to market jitters caused by Trump's tariff policy which is driving up the price of gold.
This solidifies gold as a safe haven asset and could lead to repricing.
You will note a further bullish iBOS marked in red. This is due to the fact the price did not trade down to either discount of internal 50% or a demand level.
Intraday Expectation:
Due to the bullish nature of the market, with very minimal pullback I will continue to visually map until price pulls back enough to plot structure.
Note:
With the Federal Reserve's dovish stance and persisting geopolitical uncertainties, heightened volatility in Gold is expected to continue. Traders should proceed with caution and adjust risk management strategies in this high-volatility environment.
Price could also be driven by President Trump's policies, geopolitical moves and economic decisions which are sparking uncertainty.
H4 Chart:
M15 Analysis:
-> Swing: Bullish.
-> Internal: Bullish.
Since last analysis price has continued extremely bullish. This is most likely due to market jitters caused by the trump tariffs.
This solidifies gold as a safe haven asset and could lead to repricing.
You will note price has printed a bearish CHoCH which indicates, but does not confirm, bearish pullback phase initiation. I will however continue to monitor price.
Intraday Expectation:
Price to trade down to either discount of 50% internal EQ or M15 demand zone before targeting weak internal high, priced at 3,149.090.
Note:
With the Federal Reserve maintaining a dovish stance and ongoing geopolitical tensions, volatility in Gold prices is expected to remain elevated. Traders should exercise caution, adjust risk management strategies, and stay prepared for potential price whipsaws in this high-volatility environment.
M15 Chart:

XAU/USD 28 March 2025 Intraday AnalysisH4 Analysis:
-> Swing: Bullish.
-> Internal: Bullish.
Price has met expectations and analysis by printing a further bullish iBOS, however, pullback was minimal and with price not trading down to either discount of 50% EQ or Daily/H4 demand zone.
I will therefore, at present, not classify this as a bullish iBOS in order not to distort internal range
Intraday Expectation:
Price to print bearish CHoCH to indicate, bnut not confirm bearish pullback phase initiaiton. Price to then trade down to either discount of internal 50% EQ, or nested Daily and H4 demand levels before targeting weak internal high priced at 3,086.090.
Alternative scenario:
Price could potentially continue to print higher.
Note:
With the Federal Reserve's dovish stance and persisting geopolitical uncertainties, heightened volatility in Gold is expected to continue. Traders should proceed with caution and adjust risk management strategies in this high-volatility environment.
Price could also be driven by President Trump's policies, geopolitical moves and economic decisions which are sparking uncertainty.
H4 Chart:
M15 Analysis:
-> Swing: Bullish.
-> Internal: Bullish.
Analysis and bias was not met with pricing printing a bullish iBOS.
Price has printed a bearish CHoCH to indicate bearish pullback phase initiation.
Price is now trading within an established internal range. I will however continue to monitor price.
Intraday Expectation:
Price to trade down to either discount of internal 50% EQ or M15 demand zone before targeting weak internal high priced at 3,086.090.
Note:
With the Federal Reserve maintaining a dovish stance and ongoing geopolitical tensions, volatility in Gold prices is expected to remain elevated. Traders should exercise caution, adjust risk management strategies, and stay prepared for potential price whipsaws in this high-volatility environment.
M15 Chart:

XAU/USD 26 March 2025 Intraday AnalysisH4 Analysis:
-> Swing: Bullish.
-> Internal: Bullish.
Bias and analysis remains the same as analysis dated 23 March 2025.
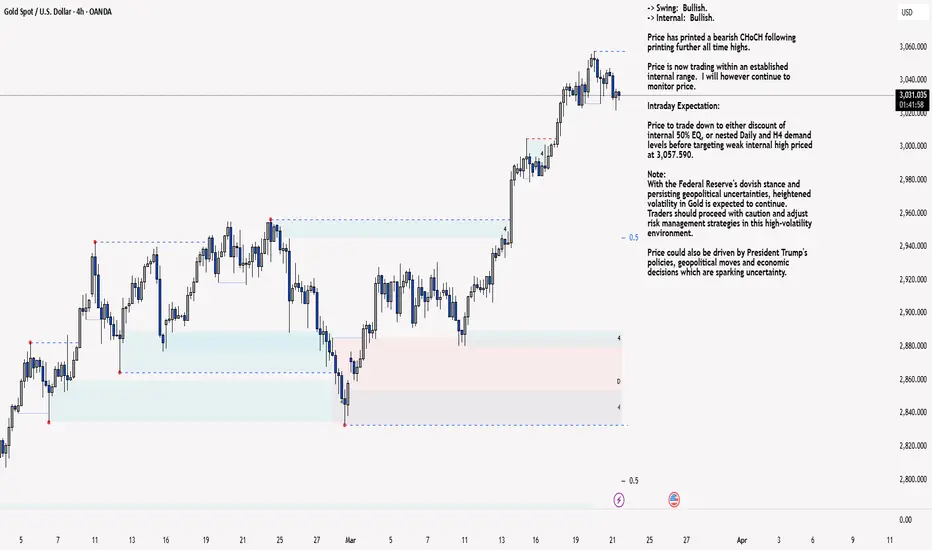
Price has printed a bearish CHoCH following printing further all time highs.
Price is now trading within an established internal range. I will however continue to monitor price.
Intraday Expectation:
Price to trade down to either discount of internal 50% EQ, or nested Daily and H4 demand levels before targeting weak internal high priced at 3,057.590.
Note:
With the Federal Reserve's dovish stance and persisting geopolitical uncertainties, heightened volatility in Gold is expected to continue. Traders should proceed with caution and adjust risk management strategies in this high-volatility environment.
Price could also be driven by President Trump's policies, geopolitical moves and economic decisions which are sparking uncertainty.
H4 Chart:
M15 Analysis:
-> Swing: Bullish.
-> Internal: Bearish.
Analysis and bias remains the same as analysis dated 24 March 2025.
As per analysis dated 19 March 2025 whereby I mentioned as an alternative scenario that internal range has significantly narrowed. All HTF's require a pullback, therefore, it would be completely viable if price printed a bearish iBOS.
This is how price printed, by printing a bearish iBOS.
Price has yet to print a bullish CHoCH to indicate bullish pullback phase initiation, however, price has traded into premium of 50% internal EQ, therefore, I am happy to confirm internal range.
Intraday Expectation:
Price has traded in to premium of 50% EQ and has mitigated M15 supply zone.
Technically, price to target weak internal low priced at 2,999.465.
Note:
With the Federal Reserve maintaining a dovish stance and ongoing geopolitical tensions, volatility in Gold prices is expected to remain elevated. Traders should exercise caution, adjust risk management strategies, and stay prepared for potential price whipsaws in this high-volatility environment.
M15 Chart:

Safe-Haven Demand Keeps Gold ElevatedGold edged above $3,020 on Wednesday, near record highs, supported by safe-haven demand amid uncertainty over upcoming US reciprocal tariffs. Trump's April 2 tariff plan is expected to be more targeted than past proposals but still signals a major escalation in trade tensions.
Markets now await Fed officials’ speeches and Friday’s US PCE data for policy clues. Meanwhile, a U.S.-brokered pause in sea and energy attacks between Ukraine and Russia, along with possible sanctions relief for Moscow, slightly eased bullion's appeal.
Key resistance stands at $3082, with further levels at $3100 and $3,150. Support is at $3000, followed by $2,980 and $2,916.

XAU/USD 25 March 2025 Intraday AnalysisH4 Analysis:
-> Swing: Bullish.
-> Internal: Bullish.
Bias and analysis remains the same as analysis dated 23 March 2025.
Price has printed a bearish CHoCH following printing further all time highs.
Price is now trading within an established internal range. I will however continue to monitor price.
Intraday Expectation:
Price to trade down to either discount of internal 50% EQ, or nested Daily and H4 demand levels before targeting weak internal high priced at 3,057.590.
Note:
With the Federal Reserve's dovish stance and persisting geopolitical uncertainties, heightened volatility in Gold is expected to continue. Traders should proceed with caution and adjust risk management strategies in this high-volatility environment.
Price could also be driven by President Trump's policies, geopolitical moves and economic decisions which are sparking uncertainty.
H4 Chart:
M15 Analysis:
-> Swing: Bullish.
-> Internal: Bearish.
Analysis and bias remains the same as yesterday's analysis dated 24 March 2025.
As per analysis dated 19 March 2025 whereby I mentioned as an alternative scenario that internal range has significantly narrowed. All HTF's require a pullback, therefore, it would be completely viable if price printed a bearish iBOS.
This is how price printed, by printing a bearish iBOS.
Price has yet to print a bullish CHoCH to indicate bullish pullback phase initiation, however, price has traded into premium of 50% internal EQ, therefore, I am happy to confirm internal range.
Intraday Expectation:
Price has traded in to premium of 50% EQ and has mitigated M15 supply zone.
Technically, price to target weak internal low priced at 2,999.465.
Note:
With the Federal Reserve maintaining a dovish stance and ongoing geopolitical tensions, volatility in Gold prices is expected to remain elevated. Traders should exercise caution, adjust risk management strategies, and stay prepared for potential price whipsaws in this high-volatility environment.
M15 Chart:

XAU/USD 24-28 March 2025 Weekly AnalysisWeekly Analysis:
Swing Structure -> Bullish.
Internal Structure -> Bullish.
Analysis and bias remains the same as analysis dated 16 March 2025.
In my analysis dated 27 October 2024 I mentioned (below) that price could potentially print higher in order to reposition CHoCH. This is exactly how price printed. CHoCH positioning has been brought significantly closer to current price action.
The remainder of my analysis and bias remains the same as analysis dated 09 February 2025.
Price has printed a further bullish iBOS.
Price is currently trading within an internal low and fractal high. CHoCH positioning is denoted with a blue dashed line.
Price Action Analysis:
In my analysis dated 27 October 2024, it was noted that the first sign of a pullback would be a bearish Change of Character (CHoCH), indicated by a blue dotted line. Price's consistent upward momentum had repositioned previous CHoCH much closer to recent price levels as expected for weeks. Current CHoCH positioning is quite a distance away from price, therefore, it would be viable if price continued bullish to reposition CHOCH.
Note:
It is highly unlikely price will "crash" as many analysts are predicting. My view is this is merely a corrective wave of the primary trend.
Given the Federal Reserve's dovish policy stance alongside heightened geopolitical risks, market volatility is likely to remain elevated, influencing intraday price swings.
Price could also be driven by President Trump's policies, geopolitical moves and economic decisions which are sparking uncertainty.
Weekly Chart:
Daily Analysis:
Swing -> Bullish.
Internal -> Bullish.
Price continued bullish repositioning bearish CHoCH positioning closer to current price action.
Price is now trading within an internal low and fractal high.
Expectation is for price to print bearish CHoCH to indicate, but not confirm bearish pullback phase initiation. CHoCH positioning is denoted with a blue dotted line.
Note:
With the Fed maintaining a dovish policy stance and the continued rise in geopolitical tensions, we should anticipate elevated market volatility, which may impact both intraday and longer-term price action.
Price could also be driven by President Trump's policies, geopolitical moves and economic decisions which are sparking uncertainty and the repricing of Gold.
Daily Chart:
H4 Analysis:
-> Swing: Bullish.
-> Internal: Bullish.
Analysis and bias remains the same as analysis dated 21 March 2025.
Price has printed a bearish CHoCH following printing further all time highs.
Price is now trading within an established internal range. I will however continue to monitor price.
Intraday Expectation:
Price to trade down to either discount of internal 50% EQ, or nested Daily and H4 demand levels before targeting weak internal high priced at 3,057.590.
Note:
With the Federal Reserve's dovish stance and persisting geopolitical uncertainties, heightened volatility in Gold is expected to continue. Traders should proceed with caution and adjust risk management strategies in this high-volatility environment.
Price could also be driven by President Trump's policies, geopolitical moves and economic decisions which are sparking uncertainty.
H4 Chart:

XAU/USD 21 March 2025 Intraday AnalysisH4 Analysis:
-> Swing: Bullish.
-> Internal: Bullish.
Price has printed a bearish CHoCH following printing further all time highs.
Price is now trading within an established internal range. I will however continue to monitor price.
Intraday Expectation:
Price to trade down to either discount of internal 50% EQ, or nested Daily and H4 demand levels before targeting weak internal high priced at 3,057.590.
Note:
With the Federal Reserve's dovish stance and persisting geopolitical uncertainties, heightened volatility in Gold is expected to continue. Traders should proceed with caution and adjust risk management strategies in this high-volatility environment.
Price could also be driven by President Trump's policies, geopolitical moves and economic decisions which are sparking uncertainty.
H4 Chart:
M15 Analysis:
-> Swing: Bullish.
-> Internal: Bullish.
You will note how price has mitigated M15 demand zones at the extreme of strong internal low. The remainder of my analysis and bias remains the same as analysis dated 19 March 2025.
Price has continued to surge to new all time highs, largely fuelled by geopolitical tensions, gold is solidifying itself as a safe haven asset.
Price has printed a further bullish iBOS followed by a bearish CHoCH to confirm internal structure.
Intraday Expectation:
Price has mitigated M15 demand zone. Technically price should target weak internal high priced at 3,057.590.
Alternative scenario:
You will note internal range has significantly narrowed. All HTF's require a pullback, therefore, it would be completely viable if price printed a bearish iBOS.
Note:
With the Federal Reserve maintaining a dovish stance and ongoing geopolitical tensions, volatility in Gold prices is expected to remain elevated. Traders should exercise caution, adjust risk management strategies, and stay prepared for potential price whipsaws in this high-volatility environment.
M15 Chart:
Gold Nears $3,030 on Fed Cut HopesGold hovered near $3,030 on Friday, close to record highs and heading for a third straight weekly gain. The rally is driven by dovish Fed signals and strong safe-haven demand. The Fed reaffirmed plans for two rate cuts in 2025 amid rising economic uncertainty, while Powell downplayed Trump’s proposed tariffs as temporarily inflationary but saw no urgency to cut rates.
Geopolitical tensions also supported gold, with Israel escalating operations in Gaza, Hamas striking Tel Aviv and the U.S. continuing airstrikes in Yemen. Markets are also watching the April 2 deadline for Trump’s reciprocal tariffs, fueling trade concerns. Gold is up over 15% year-to-date.
Key resistance stands at $3082, with further levels at $3100 and $3,150. Support is at $3000, followed by $2,980 and $2,916.

Gold Holds Near Record $3,050Gold hovered near a record $3,050, supported by Fed rate cut expectations and safe-haven demand. The Fed reaffirmed plans for 50 bps cuts this year amid rising economic uncertainty, driving gold.
Middle East tensions escalated as Israel resumed ground operations in Gaza after an airstrike ended a two-month ceasefire. The US continued strikes on Houthi targets, with Trump warning Iran over future incidents.
Trade concerns persisted ahead of new tariffs in April, following the US’s 25% duty on steel and aluminum in February.
Key resistance stands at $3082, with further levels at $3100 and $3,150. Support is at $3000, followed by $2,980 and $2,916.

XAU/USD 18 March 2025 Intraday AnalysisH4 Analysis:
-> Swing: Bullish.
-> Internal: Bullish.
Price has printed a bullish iBOS, however, I will apply discretion and not classify as a bullish iBOS due to very insignificant pullback which would distort internal range. Therefore, I have marked the iBOS in red.
Intraday Expectation:
Await for price to indicate pullback phase initiation by printing bearish CHoCH. ChOCH positioning is denoted with a blue dotted line.
Note:
With the Federal Reserve's dovish stance and persisting geopolitical uncertainties, heightened volatility in Gold is expected to continue. Traders should proceed with caution and adjust risk management strategies in this high-volatility environment.
Price could also be driven by President Trump's policies, geopolitical moves and economic decisions which are sparking uncertainty.
H4 Chart:
M15 Analysis:
-> Swing: Bullish.
-> Internal: Bullish.
Since yesterday's analysis, price has continued to surge to new all time highs, largely fuelled by geopolitical tensions. Gold is solidifying itself as a safe haven asset.
Whilst price has not pulled back to discount of 50% I am happy to classify as a bullish iBOS due to time spent.
Price has printed a bullish iBOS followed by a bearish CHoCH to confirm internal structure. I will however continue to monitor price.
Intraday Expectation:
Price to continue bearish to complete it's bearish pullback phase to either discount of internal 50% EQ or M15 demand zone before targeting weak internal high, priced at
Note:
With the Federal Reserve maintaining a dovish stance and ongoing geopolitical tensions, volatility in Gold prices is expected to remain elevated. Traders should exercise caution, adjust risk management strategies, and stay prepared for potential price whipsaws in this high-volatility environment.
M15 Chart:

Gold Surges Past $3,000 Amid Fed UncertaintyGold surged past $3,000, hitting a record high as safe-haven demand grew ahead of the Fed's rate decision. While rates are expected to remain unchanged, investors await economic projections and Powell’s remarks for policy clues amid trade tensions. Market jitters also rose after Trump warned Iran over Houthi rebel attacks and planned talks with Putin on ending the Ukraine war.
Key resistance stands at $3045, with further levels at $3100 and $3,150. Support is at $3000, followed by $2,980 and $2,916.

XAU/USD 17 March 2025 Intraday AnalysisH4 Analysis:
-> Swing: Bullish.
-> Internal: Bullish.
Analysis and bias remains the same as analysis dated 16 March 2025.
Previous analysis and bias was not met as price did not target weak internal low.
Price has printed a bullish iBOS followed by a bearish CHoCH.
Price is currently trading within an established internal range.
Intraday Expectation:
Price to either trade down to discount of 50% internal EQ, or Daily/H4 demand zone before targeting weak internal high priced at
Note:
With the Federal Reserve's dovish stance and persisting geopolitical uncertainties, heightened volatility in Gold is expected to continue. Traders should proceed with caution and adjust risk management strategies in this high-volatility environment.
Price could also be driven by President Trump's policies, geopolitical moves and economic decisions which are sparking uncertainty.
H4 Chart:
M15 Analysis:
-> Swing: Bullish.
-> Internal: Bullish.
Price has printed a bearish CHoCH confirming internal range, however, price has not in any way pulled back significantly enough to classify current internal high as an iBOS, should price print higher than current internal high.
Remainder of analysis and bias remains the same as yesterday's analysis dated 13 March 2025
Analysis and bias has not been met, largely due macroeconomic events, particularly the Trump trade tariff war, which is causing uncertainty within the markets which is supporting Gold price.
Price has printed a bullish iBOS.
Within the structure following the iBOS, price has printed a several bearish CHoCH's with very minimal pullbacks before continuing bullish.
In order not to distort internal structure range I will apply discretion and not classify bearish CHoCH without considerable pullback.
Intraday Expectation:
Await for price to print Bearish CHoCH which is supported by a pullback relative to recent price action.
Note:
With the Federal Reserve maintaining a dovish stance and ongoing geopolitical tensions, volatility in Gold prices is expected to remain elevated. Traders should exercise caution, adjust risk management strategies, and stay prepared for potential price whipsaws in this high-volatility environment.
M15 Chart: