XAU/USD 12 March 2024 Intraday AnalysisH4 Analysis:
-> Swing: Bullish.
-> Internal: Bearish.
Analysis/Bias remains the same as analysis dated 07 March 2024.
Price has printed a bullish CHoCH according to analysis and bias dated 28 February 2025.
Price is currently trading within an established internal range.
Intraday Expectation:
Price is now trading in premium of 50% internal EQ where we could see a reaction at any point. Price could also target H4 supply zone before targeting weak internal low, priced at 2,832.720
Note:
With the Federal Reserve's dovish stance and persisting geopolitical uncertainties, heightened volatility in Gold is expected to continue. Traders should proceed with caution and adjust risk management strategies in this high-volatility environment.
Price could also be driven by President Trump's policies, geopolitical moves and economic decisions which are sparking uncertainty.
H4 Chart:
M15 Analysis:
-> Swing: Bullish.
-> Internal: Bearish.
Analysis and bias remains the same as analysis dated 03 March 2023.
As mentioned in my analysis dated 28 February 2025, whereby price printed a bullish CHoCH but stated I would continue to monitor price.
On this occasion I have marked the previous bullish CHoCH in red as price did not pull back deeply enough to warrant internal structure breaks, additionally, there was minimal time spent .
Price has printed a further bullish CHoCH which is now confirmed. Price is not trading within an established internal range.
Intraday Expectation:
Price to continue bullish, react at either premium of internal 50% EQ, or M15 supply zone before targeting weak internal low priced at 2,832.720.
Note:
With the Federal Reserve maintaining a dovish stance and ongoing geopolitical tensions, volatility in Gold prices is expected to remain elevated. Traders should exercise caution, adjust risk management strategies, and stay prepared for potential price whipsaws in this high-volatility environment.
M15 Chart:
Golddollar

Recession Fears Support Gold's StabilityGold held steady above $2,910 per ounce, maintaining a 1% gain. Investor sentiment shifted after Trump reversed his plan to double tariffs on Canadian steel and aluminum, just hours after the announcement. Ontario Premier Doug Ford also paused a 25% surcharge on US electricity exports.
Trade uncertainties and US recession fears continued to support gold, though geopolitical tensions eased as the US restored military aid to Ukraine following a 30-day ceasefire agreement with Russia. Markets now focus on upcoming US CPI data for clues on the Fed’s rate outlook.
Key resistance stands at $2,923, with further levels at $2,955 and $3,000. Support is at $2,860, followed by $2,830 and $2,790.

Trade Uncertainty and Fed Stance Keep Silver Prices ElevatedSilver held at $32.50 per ounce after a 4.4% weekly gain, as trade tensions and U.S. inflation data kept investors cautious. Uncertainty grew after Trump warned of new tariffs on Canadian dairy and lumber, following a U.S. delay on 25% tariffs for Canadian and Mexican goods. Canada upheld retaliatory measures, while China’s tariffs on U.S. agriculture took effect. Concerns deepened after Trump avoided recession and inflation questions in a Fox News interview. Fed Chair Powell signaled no rush for rate cuts despite rising economic risks.
If silver breaks above $32.75, the next resistance levels are $33.15 and $33.80. On the downside, support is at $31.00, with further levels at $30.20 and $29.75 if selling pressure increases.

XAU/USD 28 February 2025 Intraday AnalysisH4 Analysis:
-> Swing: Bullish.
-> Internal: Bearish.
Price has printed a bearish iBOS as per alternative scenario mentioned over the last few weeks.
Price is now trading within an internal high and fractal low.
Bullish CHoCH positioning is marked with a blue dotted line.
Intraday Expectation:
Await for price to indicate bullish pullback phase initiation by printing a bullish CHoCH.
Note:
With the Federal Reserve's dovish stance and persisting geopolitical uncertainties, heightened volatility in Gold is expected to continue. Traders should proceed with caution and adjust risk management strategies in this high-volatility environment.
Price could also be driven by President Trump's policies, geopolitical moves and economic decisions which are sparking uncertainty.
H4 Chart:
M15 Analysis:
-> Swing: Bullish.
-> Internal: Bearish.
Price has printed a bearish iBOS in accordance with analysis and bias dated 26 January 2025.
You will note price has printed several bullish CHoCH's followed by bearish iBOS's, however, I have left them unmarked due to low volume candles printing erratically. This would in-turn distort internal structure.
Price has printed a further bullish CHoCH, which indicates, but does not confirm bullish pullback phase initiation, however, I will continue to monitor price action.
Intraday Expectation:
Price to continue bullish, react at either premium of internal 50% EQ, or M15 supply zone before targeting weak internal low priced at 2,851.115.
Note:
With the Federal Reserve maintaining a dovish stance and ongoing geopolitical tensions, volatility in Gold prices is expected to remain elevated. Traders should exercise caution, adjust risk management strategies, and stay prepared for potential price whipsaws in this high-volatility environment.
M15 Chart:

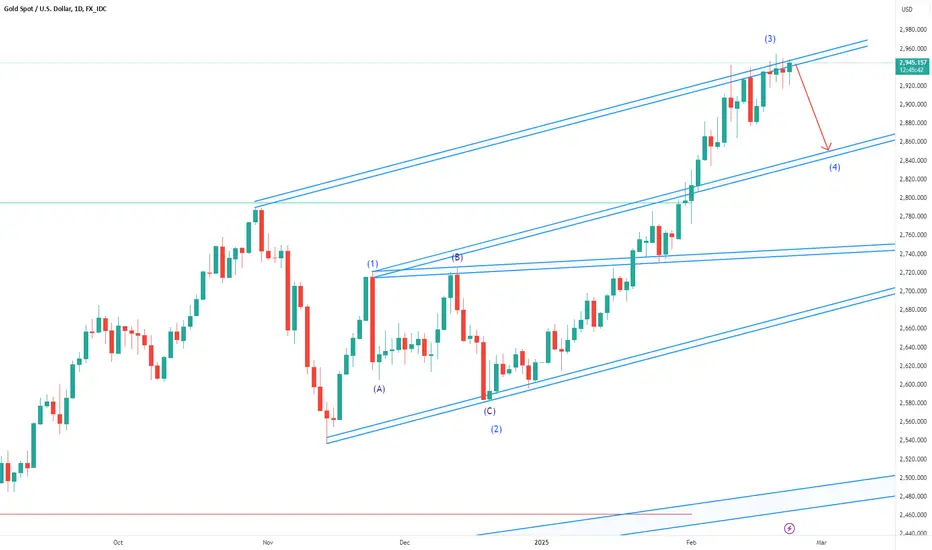
#Gold Wave 4 soon$3000 is a psychological level. So, I believe wave 3 should end here. It could go a little higher ~$3030ish. Then will drop about 5%-7% to conclude wave 4.
Overall I am bullish on Gold (XauUsd).
#XAU
TVC:XAU
XAU/USD 31 January 2025 Intraday AnalysisH4 Analysis:
-> Swing: Bullish.
-> Internal: Bullish.
Price has finally printed a bullish iBOS followed by bullish BOS according, and in-line with previous analysis.
Price has printed a bearish CHoCH to indicate, but not confirm bearish pullback phase initiation.
Price is now trading within an established internal range, however, I will continue to monitor this due to CHoCH positioning so close to recent price action.
Intraday Expectation:
Price to continue bearish to complete it's pullback phase. Technically price should trade down to either discount of internal 50% EQ or H4 demand zone before targeting weak internal high priced at 2,801.010.
Note:
With the Federal Reserve's dovish stance and persisting geopolitical uncertainties, heightened volatility in Gold is expected to continue. Traders should proceed with caution and adjust risk management strategies in this high-volatility environment.
H4 Chart:
M15 Analysis:
-> Swing: Bullish.
-> Internal: Bullish.
Analysis/Bias was accurate with price targeting weak internal high.
Price is now trading within an established internal range, however, I will continue to monitor as price has previously printed a bearish CHoCH and continue higher with very minimal pullback.
Intraday Expectation:
Price to continue bearish, react at either discount of internal 50% EQ, or H4/M15 demand zone before targeting weak internal high priced at 2,801.010.
Note:
With the Federal Reserve maintaining a dovish stance and ongoing geopolitical tensions, volatility in Gold prices is expected to remain elevated. Traders should exercise caution, adjust risk management strategies, and stay prepared for potential price whipsaws in this high-volatility environment.
M15 Chart :

GOLD - XAUUSDWe will look at the logarithmic chart of gold starting from 1975.
We see the two cycles. I drew a line along the tops of these peak values and made a parallel one, thereby forming an upward trend channel.
If we talk about the Elliott Waves, then we'd the peak of the third wave in 2011 - the strongest wave and it's during the 2007-2008 crisis.
Now we're on the cusp of a real breakthrough and amid of the potential instability in the world, gold will be a protective asset. There are many fundamental factors for its growth.
On the other hand, if we talk about local movement, then we've broken through the resistance of triangle below and made the first wave up, after which there should be a correction - either in a small triangle or to the support line of the global channel, and after that, there'll be the strongest impulse of the third wave which will break 1900+.
In my analysis, I say that it's the global 5th uptrend wave and we'll see some updating of new highs over the next few years.
Best Regards EXCAVO.

XAU/USD 15 January 2025 Intraday AnalysisH4 Analysis:
-> Swing: Bearish.
-> Internal: Bullish.
Analysis/Intraday expectation remains the same as analysis dated 16 December 2024.
Price is clearly unable to target weak internal. This is due to the fact that Daily and Weekly Timeframe remain in bearish pullback phase.
Price Action Analysis:
Technically price is to target weak internal priced at 2,721.420. Price has sweeped liquidity,
for two possible reasons.
1. To assist price to complete bearish pullback phase, react at either discount of internal 50% or H4 demand zone before targeting weak internal high.
2. To assist Daily and H4 TF's to complete bearish pullback phase with price to print a bearish iBOS and target strong internal low priced at 2,536.855.
Intraday Expectation:
Intraday expectation and alternative scenario as per points 1 and 2.
Note:
With the Federal Reserve's dovish stance and persisting geopolitical uncertainties, heightened volatility in Gold is expected to continue. Traders should proceed with caution and adjust risk management strategies in this high-volatility environment.
H4 Chart:
M15 Analysis:
-> Swing: Bearish.
-> Internal: Bearish.
Analysis and intraday expectation remain the same as yesterday's analysis dated 14 January 2025.
Price Action Analysis:
Yesterday's Intraday expectation was not met with price failing to target weak internal high, printing a bearish iBOS. Internal structure has now aligned itself with swing structure.
This could potentially be an early indication that both Daily and H4 pullback phases are incomplete. It would also be useful to remember that Weekly TF remains in its bearish pullback phase.
Price subsequently printed a bullish CHoCH thereby confirming internal range and indication of bullish pullback phase initiation.
Intraday Expectation:
Price has yet to trade in to premium of internal 50% EQ or M15 supply zone. Expectation is for price to target weak internal low, priced at 2,656.880.
Note:
With the Federal Reserve maintaining a dovish stance and ongoing geopolitical tensions, volatility in Gold prices is expected to remain elevated. Traders should exercise caution, adjust risk management strategies, and stay prepared for potential price whipsaws in this high-volatility environment.
M15 Chart:

XAU/USD 11 December 2024 Intraday AnalysisH4 Analysis:
-> Swing: Bearish.
-> Internal: Bullish.
Bias/analysis remains the same as analysis dated 25 November 2024.
Price Action Analysis:
As mentioned in yesterday's analysis dated 24 November 2024, whereby price was expected to print a bearish CHoCH. This is how price printed.
Currently, price is trading within an established internal range.
Intraday Expectation:
Price is anticipated to trade down to either discount of internal 50% EQ, which is marked in blue, or H4 demand zone before targeting weak internal high priced at 2,721.420.
Note:
With the Federal Reserve's dovish stance and persisting geopolitical uncertainties, heightened volatility in Gold is expected to continue. Traders should proceed with caution and adjust risk management strategies in this high-volatility environment.
H4 Chart:
M15 Analysis:
-> Swing: Bearish.
-> Internal: Bullish.
Price Action Analysis:
As mentioned in my analysis dated 25 November 2024, H4 TF is now trading in discount of internal 50%. This suggested that bearish momentum on M15 may face limitations, which it did.
Price printed as per alternative scenario, printing a bullish iBOS.
Price subsequently printed a bearish CHoCH indicating bearish pullback phase initiation.
Internal range is now established.
Intraday Expectation:
Price to trade down to either 50% internal EQ, or M15 demand level before targeting weak internal high.
Alternative Scenario:
Current internal range is fairly extensive, therefore, requiring a deeper pullback to internal 50% EQ and/or M15 demand level.
Price could potentially target weak internal high and print a bullish iBOS to narrow the depth of the internal range.
Note:
Given the Federal Reserve's dovish stance and persistent geopolitical tensions, volatility in Gold prices is likely to remain elevated. Traders should remain cautious and prepared for potential price whipsaws in this high-volatility environment.
M15 Chart:

XAU/USD 27 November 2024 Intraday AnalysisH4 Analysis:
-> Swing: Bearish.
-> Internal: Bullish.
Bias/analysis remains the same as analysis dated 25 November 2024.
Price Action Analysis:
As mentioned in yesterday's analysis dated 24 November 2024, whereby price was expected to print a bearish CHoCH. This is how price printed.
Currently, price is trading within an established internal range.
Intraday Expectation:
Price is anticipated to trade down to either discount of internal 50% EQ, which is marked in blue, or H4 demand zone before targeting weak internal high priced at 2,721.420.
Note:
With the Federal Reserve's dovish stance and persisting geopolitical uncertainties, heightened volatility in Gold is expected to continue. Traders should proceed with caution and adjust risk management strategies in this high-volatility environment.
H4 Chart:
M15 Analysis:
-> Swing: Bearish.
-> Internal: Bearish.
Yesterday's analysis and bias dated 26 November 2024 remains the same.
Price Action Analysis:
Intraday expectation and analysis dated 25 November 2024 printed as anticipated, with price successfully printing a bearish iBOS after targeting the weak internal low.
A correction from yesterday's intraday expectation: instead of targeting the weak internal high, price was expected to target the weak internal low.
Price has since printed a bullish CHoCH, indicating, but not confirming, bullish pullback phase. We are now trading within an established internal range.
Intraday Expectation:
Price is anticipated to trade up to either the internal 50% EQ or the M15 supply zone before targeting the weak internal low at 2,605.310.
Alternative Scenario:
The H4 timeframe has printed a bearish CHoCH, indicating the initiation of a bearish pullback phase coupled with the fact that H4 TF is now trading in discount of internal 50%. However, this suggests that bearish momentum on M15 may face limitations as the broader H4 phase unfolds.
Note:
Given the Federal Reserve's dovish stance and persistent geopolitical tensions, volatility in Gold prices is likely to remain elevated. Traders should remain cautious and prepared for potential price whipsaws in this high-volatility environment.
M15 Chart:

XAU/USD 29 October 2024 Intraday AnalysisH4 Analysis:
Analysis/bias remains the same as analysis dated 27 October 2024.
-> Swing: Bullish.
-> Internal: Bullish.
Gold’s rally persists amid the Fed’s dovish tone and heightened geopolitical tensions, solidifying its safe-haven appeal.
Price has printed a bearish Change of Character (CHoCH), signaling, but not yet confirming, the start of bearish pullback phase.
Intraday Expectation: Despite the bearish CHoCH, price has yet to pull back into the internal 50% EQ discount. We could see a reaction at the H4 supply level before any confirmation of bearish pullback initiation.
Technical Note: The strong high at 2,758.525 is anticipated to remain protected. However, with CHoCH positioning on the daily timeframe somewhat distant, price may print a bullish iBOS in the near term to align with the daily timeframe’s movement.
H4 Chart:
M15 Analysis:
-> Swing: Bullish.
-> Internal: Bearish.
Analysis/intraday expectation remains the same as analysis dated 24 October 2024.
Yesterday's intraday expectation was not met, as price failed to target the weak internal high and instead printed a bearish Internal Break of Structure (iBOS). This aligns with the H4 timeframe being in a pullback phase.
As previously highlighted, price remains highly volatile, driven by ongoing geopolitical tensions and the Fed's softer stance.
Price has since printed a bullish Change of Character (CHoCH), suggesting but not confirming the initiation of a bullish pullback phase. Currently, price is trading within a well-established internal range.
Intraday Expectation: Price is reacting around the 50% equilibrium of the internal range and may also react at nested H4 and M15 supply levels before targeting the weak internal low.
M15 Chart:

#Gold, C&H Pattern Target Almost ReachedGold's cup and handle pattern target, $2795, almost reached. This year gold is up 32%. Very little, only $60, left for target to be fully reached. Those who were patient won.

Gold's Next Move: Will It Rebound to $2720 After a Pullback?This analysis offers an exploration of XAUUSD (Gold) price fluctuations. Recently, Gold traded at approximately $2400—a crucial support level—and subsequently commenced an ascent within a broadening wedge formation. After surpassing the $2400 threshold, it corrected toward the support line of the wedge; however, it then surged upwards, breaking the $2635 mark. The price later encountered the resistance line, but it has since begun to decline. I anticipated that Gold might retreat to the support line of the wedge before rebounding and transcending $2635 once more, aiming for $2720.

XAU/USD 10 October 2024 Intraday AnalysisH4 Analysis:
-> Swing: Bullish.
-> Internal: Bearish.
Intraday expectation/Bias remains the same as yesterday's analysis dated 09 October 2024.
Analysis dated 06 October 2024 was accurate, with price targeting the weak internal low and printing a bearish iBOS.
We are now trading between an internal high and fractal low.
CHoCH positioning is still quite a distance from current price, so it’s possible that price may print new lows to bring CHoCH closer to current price.
Intraday Expectation: Price is expected to print a bullish CHoCH to indicate the initiation of a bullish pullback phase, keeping the above scenario in mind.
I advise caution due to ongoing geopolitical tensions and the Fed's dovish stance. However, we will remain systematic in our approach.
H4 Chart:
M15 Analysis:
-> Swing: Bullish.
-> Internal: Bearish.
Intraday expectation/Bias remains the same as yesterday's analysis dated 09 October 2024.
Analysis (08 October 2024) was accurate, with price pulling back, printing a bullish Change of Character (CHoCH), reacting at the premium of the 50% internal equilibrium (EQ), and then targeting weak internal low, ultimately printing a bearish iBOS.
We are now trading between an internal high and fractal low.
Intraday Expectation: Price is expected to print a bullish CHoCH, indicating the initiation of a bullish pullback phase. Bullish CHoCH positioning is marked with a blue dotted line.
Price is likely to react at the premium of the 50% EQ or the M15 supply zone before targeting the weak internal low.
M15 Chart:

XAUUSD - Dirty TradingRange ZoneFX:XAUUSD is currently trading in a tight range between $2,635 support and $2,670 resistance. This narrow range has been challenging, with several fakeouts making it tricky to navigate. The support zone around $2,635 is holding strong, while the $2,670 resistance has prevented further upside movement.
CAPITALCOM:GOLD traders should watch for clear breaks above or below these levels before committing to positions. Expect more choppy action within this “dirty” range until a decisive breakout occurs.

XAU/USD 04 October 2024 Intraday AnalysisH4 Analysis:
intraday expectation remains unchanged from yesterday's analysis (02 October 2024).
-> Swing: Bullish.
-> Internal: Bearish.
Price has continued its surge, reaching all-time highs with minimal pullbacks.
The bearish swing pullback phase has been confirmed by a bearish Internal Break of Structure (iBOS), which has also established the current swing range. At present, we are trading between the swing high and internal low.
Price has now printed a bullish Change of Character (CHoCH), suggesting, but not confirming initiation of a bullish pullback phase.
Additionally, the price has reacted from the premium zone above the 50% internal equilibrium (EQ).
Intraday Expectation: The expectation is for price to target a weak internal low.
H4 Chart:
M15 Analysis:
-> Swing: Bullish.
-> Internal: Bullish.
Price did not meet yesterday's intraday expectation, as the internal structure flipped from bearish to bullish, with the price printing a bullish Internal Break of Structure (iBOS).
A bearish Change of Character (CHoCH) has been printed, indicating the initiation of a bearish pullback phase, and an internal range has been established.
It is expected that the price will trade down to the premium zone of the 50% internal equilibrium (EQ) or the M15 demand zone.
Intraday Expectation: Technically, the price is expected to target the weak internal high.
Given that the H4 timeframe appears to be in a bearish pullback phase, any bullish momentum is likely to be short-lived.
With rising geopolitical tensions, coupled with a dovish stance from the Fed, Gold is expected to remain highly volatile in the short term.
M15 Chart:

XAU/USD 02 October 2024 Intraday AnalysisH4 Analysis:
-> Swing: Bullish.
-> Internal: Bearish.
Price has continued its surge, reaching all-time highs with minimal pullbacks.
The bearish swing pullback phase has been confirmed by a bearish Internal Break of Structure (iBOS), which has also established the current swing range. At present, we are trading between the swing high and internal low.
Price has now printed a bullish Change of Character (CHoCH), suggesting, but not confirming initiation of a bullish pullback phase.
Additionally, the price has reacted from the premium zone above the 50% internal equilibrium (EQ).
Intraday Expectation: The expectation is for price to target a weak internal low.
H4 Chart:
M15 Analysis:
-> Swing: Bullish.
-> Internal: Bullish.
The price met expectations by targeting a weak internal low and printing a bearish Internal Break of Structure (iBOS).
As previously noted, price action has been erratic due to ongoing macroeconomic data and heightened geopolitical tensions.
Since the last analysis, the price printed a double bullish iBOS, likely driven by the escalation of geopolitical tensions.
The price has also printed a bearish Change of Character (CHoCH), suggesting, but not confirming the initiation of a bearish pullback phase.
Currently, price is positioned at the extreme of a strong internal low, with wicks into this level but no decisive close below.
Intraday Expectation: The price is expected to target a weak internal high. However, caution is advised, as the H4 timeframe has confirmed the swing pullback phase with a bearish iBOS, which could limit further upside momentum.
With rising geopolitical tensions, Gold is likely to remain highly volatile in the short term.
M15 Chart:

XAUUSD Short - You turned bullish? Great! Let's dump it!Fun fact about us, degen retail traders: We love to turn bullish at around the 3rd day if we broke a prior major resistance where the majority was short. I'm careful and betting 1:1 for now.

XAU/USD 12 September 2024 Intraday AnalysisH4 Analysis:
Intraday analysis/bias remains the same as yesterday's analysis dated 11 September 2024.
-> Swing: Bullish.
-> Internal: Bullish.
Following bullish iBOS price did not pull back to either H4 POI's or discount of internal 50% EQ which indicates XAU strength.
Recent economic data, particularly from the US has influenced market sentiment such as softer US employment data leading to an expectation of a more softer approach from the Fed which typically supports Gold prices.
Intraday expectation: Whilst price has continued bullish it is my concern that price did not pull back deep enough to grab liquidity in order to sustain a bullish push. Looking to the left price has made several failed attempts. Price should technically target weak internal high.
H4 Chart:
M15 Analysis:
-> Swing: Bullish.
-> Internal: Bearish.
Due to several factors such as geopolitical tensions and many macroeconomic factors XAU continues to surge.
Nonetheless, I will continue with systematic rules of analysis.
Technically price should target weak internal low, therefore, my bias will remain unchanged until M15 candle break and close above swing high.
Price is currently reacting at another M15 supply zone.
Intraday expectation: Price is close to extreme premium of internal 50% EQ. Price to target weak internal low. My bias will remain unchanged until and unless M15 candle close above strong swing high.
M15 Chart:

XAU/USD 06 September 2024 Intraday AnalysisH4 Analysis:
Intraday expectation, analysis and bias remains the same as analysis dated 23 August 2024.
-> Swing: Bullish.
-> Internal: Bullish.
Price has printed a bullish iBOS.
After an iBOS (Internal Break of Structure) we expect a bearish pullback.
Price has printed bearish CHoCH which indicates, but not confirms bearish pullback phase initiation
Intraday expectation: Whilst price did continue bearish as part of bearish pullback phase, I am concerned that price has not, as yet, pulled back deep enough into either H4 demand zone or discount of 50% EQ, therefore, it is my view that price will seek further liquidity before a sustained bullish move to target weak internal high.
H4 Chart:
M15 Analysis:
Intraday expectation, analysis and bias remains the same as analysis dated 05 September 2024.
-> Swing: Bullish.
-> Internal: Bearish.
Due to several factors such as geopolitical tensions and many macroeconomic factors XAU continues to surge.
Nonetheless, I will continue with systematic rules of analysis.
Technically price should target weak internal low, therefore, my bias will remain unchanged until M15 candle break and close above swing high.
Price has targeted weak internal low but the move was not sustained which indicates that price may be seeking further liquidity.
We are seeing a secondary reaction to previous M15 supply zone.
Intraday expectation: Price is in premium of internal 50% EQ. Price to target weak internal low. My bias will remain unchanged until and unless M15 candle close above strong swing high.
M15 Chart:

XAU/USD 03 September 2024 Intraday AnalysisH4 Analysis:
Intraday expectation, analysis and bias remains the same as analysis dated 23 August 2024.
-> Swing: Bullish.
-> Internal: Bullish.
Price has printed a bullish iBOS.
After an iBOS (Internal Break of Structure) we expect a bearish pullback.
Price has printed bearish CHoCH which indicates, but not confirms bearish pullback phase initiation
Intraday expectation: Whilst price did continue bearish as part of bearish pullback phase, I am concerned that price has not, as yet, pulled back deep enough into either H4 demand zone or discount of 50% EQ, therefore, it is my view that price will seek further liquidity before a sustained bullish move to target weak internal high.
H4 Chart:
M15 Analysis:
-> Swing: Bullish.
-> Internal: Bearish.
Price is stuck within an internal range and is most probably awaiting a catalyst (macroeconomic or geopolitical)
Technically price should target weak internal low and is currently reacting at premium of internal 50% EQ, however, price has ben printing low volume bars with no clear internal range direction.
Intraday expectation: Price is in premium of internal 50% EQ with strong high remaining protected. Price to target weak internal low. My bias will remain unchanged until and unless M15 candle close above strong internal high.
M15 Chart:

XAUUSD - 1H Bearish signsOANDA:XAUUSD is showing clear signs of weakness after struggling under resistance at $2,525. The recent break of trendline support, followed by a pullback, sets the stage for a significant drop. A logical stop loss above the resistance and a target near the bottom of the trading range could offer a solid risk-reward opportunity. Expect a move below $2,500 soon.

XAU/USD 26 August 2024 Intraday AnalysisH4 Analysis:
Intraday expectation, analysis and bias remains the same as analysis dated 23 August 2024.
-> Swing: Bullish.
-> Internal: Bullish.
Price has printed a bullish iBOS.
After an iBOS (Internal Break of Structure) we expect a bearish pullback.
Price has printed bearish CHoCH which indicates, but not confirms bearish pullback phase initiation
Intraday expectation: Whilst price did continue bearish as part of bearish pullback phase, I am concerned that price has not, as yet, pulled back deep enough into either H4 demand zone or discount of 50% EQ, therefore, it is my view that price will seek further liquidity before a sustained bullish move to target weak internal high.
H4 Chart:
M15 Analysis:
-> Swing: Bullish.
-> Internal: Bearish.
As mentioned in previous analysis whereby we needed to be mindful that H4, following bullish iBOS, has yet to initiate bearish pullback, therefore, it would not be unexpected if strong internal low was to be targeted. This is exactly what price printed, printing a bearish iBOS.
Price has printed bullish CHoCH indicating bullish pullback phase initiation.
Intraday expectation: Price is currently positioned almost in extreme of internal 50% EQ. Strong high to remain protected. Price to target weak internal low.
M15 Chart:
