Bitcoin price is inch closer to ATH* Bitcoin is in a massive rally.
* It is now trading 118% above from it's $28k support
* After a proper retest to it's $59500 support we can expect a bull run to it's ATH
Goldencross

Trend reversal pattern in VeChain* VET in 4H time frame appears with Inverted Head and Shoulder pattern and it's neckline as resistance around $0.125.
* Inverted Head and Shoulder is a trend reversal pattern occurs during the bearish market
* If the price breaks the above resistance we expect the bullish move.

Will XRP continue the bull run ?* XRP in Weekly time frame forms a Symmetrical triangle pattern
* Symmetrical triangle appears pattern when the price consolidates between two trendlines slightly sloping towards eachother.
* The Below Ascending trendline works as support to the price and the above Descending trendline works as resistance. The price is squeezed till it breaks the pattern and continues the move.
* In order to continue the bull run XRP needs to break the above trendline.

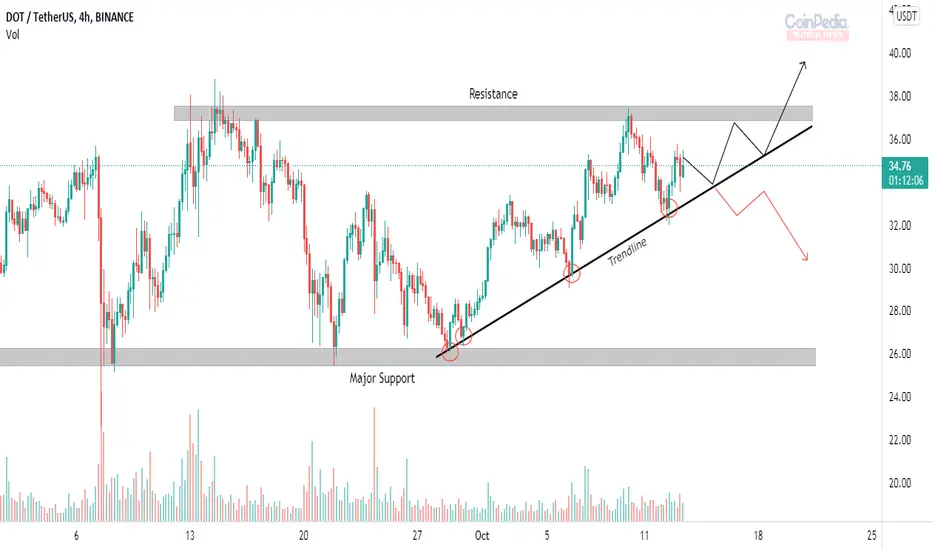
Polkadot analysis in 4H time frame* Polkadot is moving within a range between it's resistance around $38 and it's major support near $26.
* The below ascending trend-line is working as support for the price. In order to continue the uptrend DOT needs to break the above resistance.
* If the price breaks the below trend-line the price will drop till it's support zone.
"I’m Ridin’ Sol-ana" Again ??? SOLANA GOLDEN CROSSSolana Golden Cross alert
I have two perspectives that may take Solana for a bullish ride
1 - respecting to the support line which I drawn
2 - 50 MA crossed above 200 MA (Golden Cross)
If SOL respect to my prediction it would meet the resistances showed in the chart and I have little hope that SOL hit a new ATH
I'm just sharing my ideas only. Please be kind enough to manage your risk accordingly.
Have a nice day :)

GOLD is Consolidated I take this for long time because it's going to take time for breakout support. Once it touch to 1780-85 then it should reflect till that time we are not opening any order.
Here scenario is bearish and we all need a best point to place order. Have patience’s don’t be hurry good time is yet to come.
Remember one thing we are not going to place BUY order, next movement will be retest so don’t anguish.
Place your order below 1762-70, our target will be 1745, 1723, 1717 and below.
LIKE OUR IDEA FOLLOW COMMENT

What I expect of bitcoinA chart where we see golden crosses and death crosses, I expect some volatility before bitcoin can take off again. The second golden cross would mean a bull cycle again imo.
I'm prepared for take off
Not financial advice :)

BITCOIN IS ABOUT TO PUMP HARD! My thoughts for the coming days.Namaste.
Getting straight to it.
Looking at the daily chart we can see that Bitcoin formed a very interesting Death Cross on the 30th of April which sent Bitcoin price violently down.
The procedure was also aided by another two Death Crosses formed on 24th of May and again 13th of July with the last one sending the price to its historical previous lows AND support levels at which point the bulls put a stop on it and took over.
Take note that the entire procedure took 81 days and sent the price of Bitcoin down by a whopping 50% !!!
Shortly after that, on the 3rd of August a Golden Cross was formed followed by an almost immediate break out of the resistance (Red line) opening the door to testing the previous ATH.
Another Golden Cross was formed on the 19th of August which is still active.
Currently the price broke below its current support line (Green) and its testing it for a breakout above.
Take note that after the price broke out below this trend line it has on both occasions found support at the 25 (Blue) and 200 (Pink) SMA levels.
Looking at the uptrend caused from the 3rd of August we see a 29% increase in 14 days and from the one from 19th of August which is still very active is a 10% increase in 15 days and its still going.
A total of 31 days so far and an increase of 39%.
If the price breaks above the current resistance (Green line) and maintains that level (retests and holds strong) and if we see the RSI breaking above its current resistance (Red line), I believe we will see a third Golden Cross (Red 100 SMA over Pink 200 SMA) which by then the price should have already tested the previous ATH and would be ready to create and all new and fresh ATH.
FOR ALL THE BEARS OUT THERE:
Looking at this from a bearish view.
Should the case be that the price is rejected from the current resistance level and starts dropping and IF a candle closes below the 200 SMA (Pink) with high Volume (this is important as recent candle close below had low volumes) then to me its a signal that we are in BEAR MODE. I would be shorting at this point and/or waiting to buy in (Green targets).
SUMMARY:
BULL MODE: My targets are in Red.
BEAR MODE: My targets are in Green.
This is just my thoughts and NOT a trading advice.
Do your own due diligence and if you find you agree with my idea then it is up to YOU how you choose to invest your capital.
MAKE SURE YOU HAVE A STOP LOSS.
Have a great one :)

Its UPtober! Bitcoin Price Surges 10% Nearing The $50k MarkThe Next resistance lies at the $48,000 level, overcoming this resistance bitcoin price might possibly hit above the $50,000 level. On the flip side, if the BTC/USD fails to hold above $48 level immediate support at $46,500 comes into play. In the event of Extended losses, the crypto might test the next key support near USD 46,200, followed by $45,500.

BTC/USDT Upwards breakout imminent. Bitcoin ETF approval in Oct?Intro:
- Bitcoin is the first of its kind as cryptocurrency.
- The whole crypto market follows in some way the movements of the Bitcoin price while being much more volatile.
Daily chart:
- Price keeps hovering above 40k and so far stays below the descending purple line.
- Volume is on a steady decline since Mai. Larger volume spikes are in red which confirms that we currently are going down.
- RSI analysis shows the same descending behavior while we can see that it's consolidating into a narrow range between the green and orange line.
- Support lines are at 41k and 30k.
- Resistance lines are at 48k and 59k.
Expectation:
- We expect a breakout above the purple line and a solid recovery into October.
- Looking forwards into October where we might see an ETF approval for Bitcoin. This would be in favor for the whole market
Basic rules:
- Never buy the top/ ATH
- Take profit as long as you can (also partial profit is profit)
- Use Stop/loss for leveraged positions
- If you are not experienced, don't leverage in the first place
Enjoy the ride and don't be too greedy.
If you like the content, please like, comment and give this channel a follow.
We would love it if you could share your thoughts in the comments.
Discussions are very welcome here.
Always do your own research and keep in mind that my charts and comments cannot be considered financial advice.
Cheers
ps.
Chart explanation:
Main lines:
- Green lines are tested support lines.
- Orange lines are resistance lines or, if we are above, possible support lines which were not tested yet.
- Cyan line is for volume trendline.
- White lines are Fibonacci retracement levels
Helplines:
- Purple lines are trendlines we take a look at.
- Blue, green, white and pink lines are 200MA, 100MA, 50MA and 20MA.
- Yellow lines are for visual help only.
Specials:
- Boxes represent either entry zone or support zone . Check the description.
- Cameras represent MA crossings. Yellow camera stands for a golden cross while the cyan camera stands for a death cross.

UAL - Recent Death Cross on DailyUAL daily chart presented showing Golden and Death Cross prints over the last few years.
UAL recently (late August) printed a death cross on the daily - in which the 50-day MA crossed down past the 200-day MA
A Death Cross print doesn't ALWAYS imply a significant sell-off (see chart), however, chart harmonics seem to be supportive of more down here/soon.
UAL Bulls BEWARE!
No active trades.
Not financial advice.

30 m golden cross on BTCUSDSo with this candle just opening, looks like the market watching is agreeing that this golden cross should happen on the 30m timeframe.. would be nice sign for the bulls if this does cross nicely like it's looking to!
especially to see her close above the 44248 would be bullish as thats the level of the daily ichimoku TENKAN.. That might spell some bullishness into the daily close, something that would be much needed for the bigger timeframes.

🚨BTC Macro Cycle: "Hidden Death Cross" & "True Golden Cross"🚨In this idea, I identify what I call the 'Hidden' Death Cross & 'True' Golden Cross.
They are the the cross of the weekly 50 SMA & 50 EMA.
- With 8/8 historical cross cycles completed, this is statistically significant in the macro economic trend of Bitcoin and currently has a with 100% success rate.
a. "Hidden Death Cross" consistently delivers a significant market contraction
b. "True Golden Cross" consistently delivers a significant market expansion
This trend displays significant statistical probability, and while I propose we cannot expect future cycles to repeat past results, we can assume there is a high likely hood of the trend repeating in some form and used past results as guidelines for future performance.
Weekly "Hidden Death Cross" Data
5 Hidden Death Cross (HDC);
1. 26-Sep-2011: -60%
2. 07-Jul-2014: -73%
3. 28-May-2018: -62%
4. 24-Feb-2020: -61%
5. 30-Aug-2021: .......
6. .......................
Success Rate: 100%
Failure Rate: 0%
Average Contraction: -64%
2 Standard Deviations Range (99% Confidence):
Min -57% / Max -71%
BTC Weekly "True Golden Cross" Data
4 True Golden Cross (TGC);
1. 16-Jul-2012: +16'890%
2. 20-Jul-2015: +7'192%
3. 29-Apr-2019: +179%
4. 03-Aug-2020: +531%
5. ......................
Success Rate: 100%
Failure Rate: 0%
Average Expansion: +6'198%
2 Standard Deviations Range (99% Confidence):
Min - / Max 15'000%
Comparison wit the famous Daily Death Cross & Golden Cross Trend
BTC Daily "Death Cross" Data
BTC Daily: 7 Death Cross (DC);
1. 10-Apr-2014: +56%
2. 07-Sep-2014: -69%
3. 15-Sep-2015: +23%
4. 04-Apr-2018: -60%
5. 22-Oct-2019: -29%%
6. 26-Mar-2020: +50%
7. 23-Jun-2021: -22%
8. .......................
Success Rate: 57%
Failure Rate: 43%
Average Contraction: -50%
2 Standard Deviations Range (99% Confidence):
Min -20% / Max -70%
BTC Daily "Golden Cross" Data
BTC Daily: 5 Golden Cross (DC);
1. 08-Apr-2012: +24'169%
2. 13-July-2014: -23%
3. 21-July-2015: -30%
4. 02-Nov-2015: +6722%
5. 25-Apr-2019: +163%
6. 17-Feb-2020: -62%
7. 23-May-2020: +643%
8. 15-Sep-2021: .......
9. ........................
Success Rate: 57%
Failure Rate: 43%
Average Expansion: +7'924%
2 Standard Deviations Range (99% Confidence):
Min - / Max 21'000%
Additional Hidden Trend
Daily Death Cross & Golden Cross Triplets.
In addition to the standard crosses, we can identify a pattern of 3 crosses together;
1. Daily Death Cross, Golden Cross, Death Cross: This results in a bear market with a 100% success rate
2. Golden Cross, Death Cross, Golden Cross: This results in a bull market with 100% success rate
I will be posting on these trends more, since they are statistically significant and I believe will continue to display similar results, regardless of the FOMO or FUD that may be happening at the time.
What are your thoughts?
yemala

🚨💡BTC: 'Hidden' Death Cross 100% Probability of Correction💡🚨Remove the Noise!! This is pure mathematics, statistics and probability.
The 'Hidden' Death Cross & 'True' Golden Cross are the cross of the weekly 50 SMA & 50 EMA, which with 8/8 historical cross cycles completed, consistently (100% of cross cycles) result in a significant market contraction or expansion.
Note: I am bullish on BTC, but these macro economic cycles must complete and ignoring statistical probability because of over bullish dreams, sentiment or "conviction" is likely the no. 1 fallacy of most traders in all markets.
In the following historical analysis, I identify each cross,
For contractions, I use the price at the date of the Hidden Death Cross, to the lowest price to determine the price drop percentage.
5 Hidden Death Cross (HDC);
1. 26-Sep-2011: -60%
2. 07-Jul-2014: -73%
3. 28-May-2018: -62%
4. 24-Feb-2020: -61%
5. 30-Aug-2021: -....
- 100% Probability of Market Contraction
- Average contraction: 64%
Standard Deviation (Confidence);
- SD 1 (90%): Max 68% / Min 60% Correction
- SD 2 (95%) Max 69% / Min 59% Correction
- SD 3 (99%): Max 71% / Min 57% Correction
Market expansions are identified from the price at the date of the True Golden Cross, to the highest price to determine the price increase percentage.
4 True Golden Cross (TGC);
1. 16-Jul-2012: +16'890%
2. 20-Jul-2015: +7'192%
3. 29-Apr-2019: +179%
4. 03-Aug-2020: +531%
5. ......
- 100% Probability of Market Expansion
Expansion values too variable for significant deviation estimation
Conclusion:
I am a TA traditionalist, I believe that the price reflects all known / unknown information and that price action reflects human behaviour in reaction to the changing nature of the information to establish the best possible price at that moment in time.
Based upon the mathematical analysis of the price action, for example tracking moving averages, we can identify the trends in human behaviour and apply statistical probability to these trends.
As can be observed above, the statistical probability of this trend is considerably strong, with a 99% confidence of a drop in the range of 57% to 71% after the Hidden Death Cross that happened the 30th of August 2021.
What do you think?
yemala

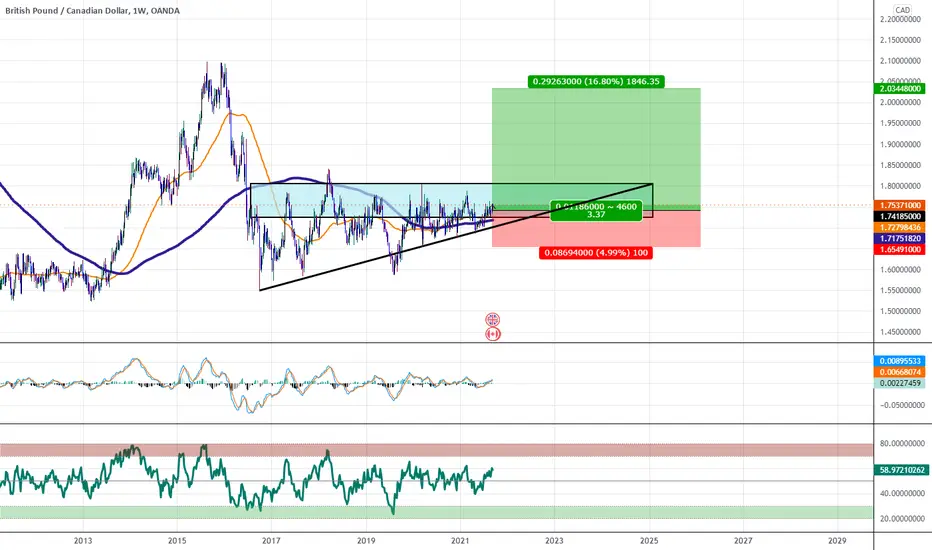
Ascending Triangle Attempting Bullish Breakout On WeeklyIn the situation that the USD Becomes the safety net of the market, one has to wonder what would happen to the Exotic/ Risk On Pairs vs the more mature pairs. I think you will see the GBP and the EURO dramatically increase in value against many pairs while the majority of the market shifts towards USD while on the other hand you will see the CAD, JPY, and CHF among many others losing value.
A giant inverse head and shoulders pattern forming???Is this the biggest inverse head and shoulders pattern in the history of btc? It could be... What about the golden cross? wOw

EURUSD ShortThe bearish pressure on EUR continues and we can see more drop from this level to form a double bottom or drop even lower.
The 1 hr macd is below 0 and we have the EMA cross in favour of the sell with a retest of the 200-hour EMA.

ENJUSDTPERPIt 's a pretty nice gesture . Ow ! Ow !
the triangle is broken , no pullback.
I 'll wait for the pullback and I 'll trigger my store till it comes to the end.

WHAT HAPPENS IF BITCOIN BREAKS THROUGH?! (100K?)Bitcoin has been really bearing the last few days but it has bounced back and fighting to break through, as you can see the previous candles I have circled struggled to break through that area, I am hoping to see it breakthrough this time. Will do a better-analyzed chart showing what I am expecting once it has broken through and what my targets are.

RAY movingWill RAY break back above the recently lost support level or this will be just a bearish retest before moving down. We have to wait and see, but it's a good chance to start trade, long or short, doesn't matter... Broke that descending trendline and looking bullish. Looks like a golden cross on MACD will be printed, already got one on SRSI. Se maybe we will see a break above, but things can change fast... Don't miss this one... Good luck traders

Golden Cross! Will BTC go ballistic or ??Exciting moment for Bitcoin as we await a mega shift in momentum. Bullish fractals here and there
Hopefully this Golden cross plays out well.
1. MACD gave the first signal for a shift in momentum weeks ago.
2. Tonight or in the next few days, the 50/200 MA should also give it go signal.
what are your thoughts about BTC?.
while we HOPE things go as planned, I remain,
Short Term Bullish
Medium term Bearish and
Long Term Bullish.

Simple analysis for Bitcoin* Bitcoin in Daily time frame is in a consolidation between it's resistance around $52k and it's support near $42k.
* The zone around $42k is working as strong support for the price.
* In order to continue the further bull run Bitcoin needs to bounce back from the support and break the above resistance.
* If the price breaks the support zone of $42K it can drop till the lower trendline.

🔥 Bitcoin Golden Cross Soon: What Happened Before?It's likely that Bitcoin will soon see a Golden Cross occur. This happens when the 50-day simple moving average (blue) crosses the 200-day simple moving average (yellow) from below. The only way in which this cross will not occur will be if we see a substantial 10%-20% drop again.
The Golden Cross pattern usually signals the start of a new huge bullish move for Bitcoin. Let's take a look at what happened before.
As you can see, the Golden Cross occurred 6 times in the history of Bitcoin. 4/6 times we've seen a substantial move from Bitcoin after the occurrence. Be aware that it has also often happened that Bitcoin went down in the short-term after the Golden Cross.
What's also interesting to see is that the moves after the Golden Cross seem to become less intense. Be aware that we only need a +225% increase to have a $100k per BTC valuation.
Do you think we will get a big bullish move after the Golden Cross? Share your thoughts🔥.
