TRU or TRUfi Chart predictionTRU is in a multi-month support zone. You can buy more TRU at $0.077.
Hold term - Long Term.
Future Potential: TRUFi's decentralized finance (DeFi) platform enables efficient and transparent borrowing and lending. As the DeFi ecosystem grows, TRU could play a crucial role in addressing liquidity issues and offering financial services to the unbanked.
Latest News: TRUFi Partners with Major Financial Institution for Increased Liquidity
The SEC alleges that nearly half a billion dollars in TrueUSD (TUSD) is not properly backed, affecting pairs on major exchanges like Binance, Bybit, Gate.io, and Bitget.
TrueUSD is accused of using phony attestation reports, having opaque ownership structures, and secretly investing backing assets in risky, illiquid ventures.
The SEC's complaint suggests that since March 2020, TrueUSD's "commodity fund" misappropriated user funds, with 99% of TUSD's backing assets being illiquid as of this month.
Major investors like a16z, BlockTower, and Alameda Research invested $12.5 million in TrueUSD's governance token, TRU, despite the alleged misappropriation.
Binance listed TrueUSD and later made it the only stablecoin with fee-free trading, leading to $1.5 billion in TUSD mints, which the SEC claims were never fully backed.
The article emphasizes the need for radical transparency in the crypto industry to prevent fraud and suggests continuous scrutiny of major projects to avoid reliance on regulatory bodies like the SEC for cleanup.
Goldencross

Inverted Head & Shoulders, Cup & Handle, Bull Flag GME DailyHey, everyone. It's that time again for the latest market update on GME. The charts are buzzing with activity, and we have some exciting developments to share.
Currently, we are trading within a substantial Bull Pennant on both the 15-minute and 1-hour charts. This indicates strong consolidation and potential for a significant move upwards. Additionally, we have a Bull Flag on the 4-hour chart, adding to the bullish sentiment.
On the daily timeframe, we've formed an impressive Cup & Handle, an Inverse Head & Shoulders, and a Bull Flag for the handle of the cup. These patterns are powerful indicators of potential upward momentum.
But that's not all! We are also in the midst of a significant Golden Cross on both the daily and weekly charts. This crossover of moving averages is a strong bullish signal, suggesting that we could be on the verge of a major uptrend.
Here’s a detailed technical breakdown:
15-minute chart: Bull Pennant
1-hour chart: Bull Pennant
4-hour chart: Bull Flag
Daily chart: Cup & Handle , Inverse Head & Shoulders , and Bull Flag
Weekly chart: Bull Flag & Golden Cross
For those who are new to these updates, it's worth noting the historical context: The last time GME had a Golden Cross on the weekly chart was back in January 2021. Following that, GME saw an incredible 12,000% run over just 183 trading days.
With the return of the Kitty and all systems go across all timeframes, the stage is set for a potentially explosive movement. Stay tuned and be ready for what promises to be an exhilarating ride.

Propy resetting stochrsi just in time for golden crossYou can see here on the daily chart how propy hit the exact target of this 4hr chart inverse head and shoulders pattern of $1.93 and then instantly corrected and has now corrected enough to reset the daily stochrsi indicator just in time for its golden cross. Having price action be this close to the 50 and 200mas at the time of the cross is almost always a good sign that the cross will be sustained and validated as well. If so once price action climbs above the horizontal brown line and flips it to solidified support then the next target should be 2.76. That target then places us above the green trendline which will lead eventually to another breakout validation with an even bigger breakout target but we will focus more on that one once we get there. For now the focus is on breaking above the brown trendline and sustaining the golden cross. *not financial advice*

More proof Goldencross works immediately in this phase of bullJust like the char I posted before this one, I’m posting this simply to lllustrate how the golden cross (orange line crossing above the blue line) immediately resulted in a very pivotal bullish pump that coincided with a major fulcrum point on the chart recently on multiple different charts. More times than not in the other market cycles, when a golden cross occurs it usually takes a few weeks afterwards to know whether that cross will have its desired outcome or instead end up being a fakeout but lately I’ve noticed multiple charts have seen an instantaneous pump on the exact day of the golden cross, which is making me think that once we enter the 2nd parabolic phase of a bull market that that is when you can anticipate a golden cross to have its immediate intended effect its suppose to have with much much higher probability than all the other market phases including even the 1st half of the bull market. Anyways I wanted to illustrate that hypothesis here with the XLM chart as you can clearly see it’s a text book example, and I will try to put a link below to the previous example where this occurred as wel a link to the total2 chart which will have its golden cross in the next 102 daily candles.l One major reason I want to illustrate this is because within the next 1-2 daily candle closes the Total2 (aka altcoin market) chart is going to have its golden cross and it is currently trying to confirm the breakout upward from a cp and handle pattern which is a huge fulcrum point for it. So should the trend of instantaneous golden cross pump effects occurring the same daily candle as the cross itself, this could clue us into exactly when the real full on alt season will be about to kick off (which if correct, will be ignited by a big confirmation breakout pump within the next 1-3 daily candles). *not financial advice*

XRP will RunXRP is currently in a consolidation phase as it seeks to establish new highs and lows. The Relative Strength Index (RSI) indicates that XRP is undervalued, suggesting it is aiming to find new lows at higher price levels. The candlestick patterns are following an upward trend line, and both the 20-day and 200-day moving averages remain positive after experiencing a golden cross around November 10th. There are many positive signals that support a bullish outlook for XRP.
Fundamental analysis indicates that XRP has a promising future, with new leadership at the Securities and Exchange Commission (SEC) and fresh partnerships fostering the institutional adoption of blockchain technology. These initial price movements are just the start of increased exposure for XRP.

Waves in a sleepy head inverse head & shoulders patternOnce price action wakes up the sleepy head pattern it can rise to $4.60 which is like a 10% gain from here if it were to hit the full breakout target. *not financial advice*

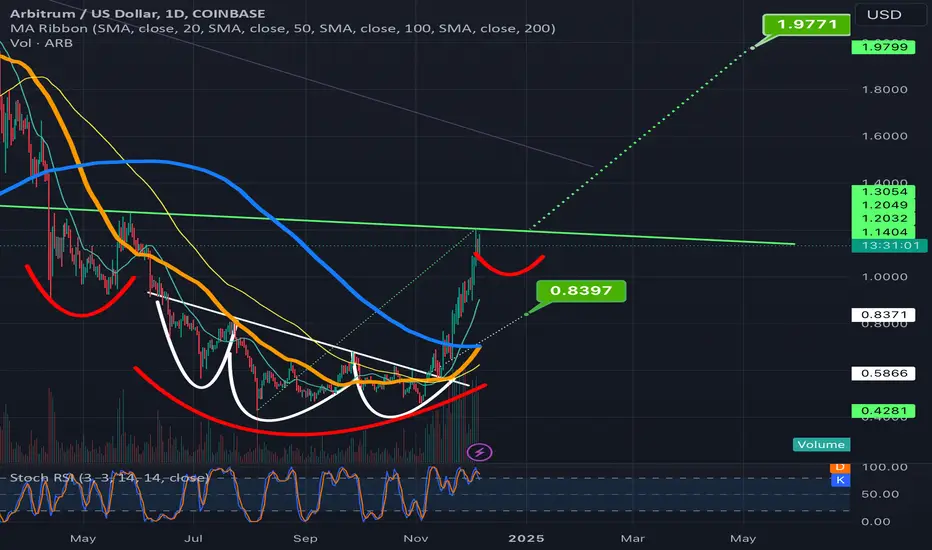
Arbitrum set to goldencross on next daily candle; invh&s in playWe can see after triggering the breakout of the smaller inverse head and shoulders and blowing past that target arbitrum has reached the perfect level that will cause this new inverse head and shoulders to materialize by correcting here and forming a right shoulder. We can also see that Arbitrum is just 1 day away from having it’s daily golden cross and considering many inverse head and boulder patterns in the altcoin market lately have been forming remarkably tiny right shoulders, Arbitrum also could follow suit and break up from the inverse head and shoulder neckline far sooner than you would normally ever expect these kind of patterns to do so. Also a chance it could form a normal shoulder here as well we wll know soon enough *not financial advice*
Dash breaking up from double bottom on same day as goldencrossI’m starting to think my hypothesis has been proven at this point as yet another alt coin has its massive breakout pump on the exact same day pill candle it has its golden cross on. Dash now joins the countless other alt coins who have also broken up from the chart patterns with a big pum the day fo their golden cross. *not financial advice*

Freshly goldencrossed Fetch heading towards inverse h&s targetGoldencross just occurred and so far fetch is responding with a green candle. It has been slowly climbing up its inverse head and shoulder measured move line but we could see it do something similar here to how Render reacted recently. I expect price to hit both of these targets in the near future *Not financial advice*

Freshly goldencrossed Fetch heading towards inverse h&s targetGoldencross just occurred and so far fetch is responding with a green candle. It has been slowly climbing up its inverse head and shoulder measured move line but we could see it do something similar here to how Render reacted recently. I expect price to hit both of these targets in the near future *Not financial advice*

Atomusd at the goldencross starting lineIn a very similar inverse head and shoulders that digibyte jsut successfully broke out of with the same kind of little right shoulder. For now there’s been no confirmation of a breakout or even solidified support on the neckline just yet so price could easily dip back below the neckline here, however considering the golden cross has occurred it wouldn’t surprise me if the neckline is confirmed solidified support n quick order. *not financial advce*

DAG looks to trigger c&h & double bottom after golden crossThis project known as Constellation with the ticker DAG has seen quite a bullish pulse lately with its golden cross, it now has et some resistance on both the double bottom neckline and the cup and handle rimline but I wouldn’t be surprised if it overcomes that resistance in the near future. *not financial advice*

CRV built a burj khaifa on its goldencrossCRV easily could just keep going parabolically vertical here but this would also be a very nice place to catch its breath and attempt to complete the right shoulder to an inv h&s pattern. Just in case I will be watching this trendline to see if it can break above it in the next few candles or not *not financial advice*

Digibyte looks like it’s validating the invh&s breakoutDigibyte shown here on the daily chart showing a nice bullish impulse firmly above the neckline of its inverse head and shoulders pattern. Already well on the way to the breakout target here so very likely validating the breakout. Also doing so a day or so before it has its golden cross. Once it reaches the full breakout target it’s likely to test the next potential resistance of the yellow horizontal trendline. That trendline is actually the neckline of a larger double bottom pattern. Wouldn’t be surprised with the golden cross so close by that whatever resistance that double bottom neckline provides doesn’t last very long *not financiala dvice*

Qnt forming right shoulder on invh&s while retsting channel ttl I’m hoping the right shoulder quant is now forming here by retracing after reaching that top purple horizontal line, will be a very short shoulder with help from it’s recent golden cross and hopefully the support from the top trendline of the yellow channel that quant just recently broke above. Usually a right shoulder would last for a much longer period of time than I have drawn this one to last in order to be ore proportional with the left shoulder(not shown here), however loopring and a few other charts recently have had very small asymmetric right shoulders on the inverse head and shoulders patterns that their price broke upward from so that may also be the case for quant’s right shoulder as well. We will see soon enough, if Quant is to follow suit with the rest of the altcoin market it’s recent golden cross should give it the bullish momentum it needs to complete this right shoulder as a very small shoulder indeed.

Root network nearing golden cross as it completes right shoulderHere we see Root network should have a golden cross in a few days and is currently correcting a slight bit which is in the process forming a right shoulder to this inverse head and shoulders pattern. Fro this level alone, were Root network to hit the inverse head and shoulders breakout target it would be a 103% gain or so, however odds are good it dips a slight bit more for the lowest portion of the right shoulder which will simply mean even larger gains fro the lowest depths of the right shoulder. *not financial advice*

CRV potentially breaking above a Double bottom neckline hereCurve like any other altcoins has responding very parabolically to its goldencross. It has now gone above a potential double bottom neckline, however, as much as it has pumped recently I would not be surprised to see it correct back down below this neckline for a bit. If it does that it may form another neckline slightly higher for a potential inverse head and shoulders pattern. If it does just continue up fro here instead then the target shown on the above chart is the ost probable one to expect. *not financial advice*

Quant on the rise after goldencross helps confirm triangle breakQuant essentially confirmed its breakout upward from the symmetrical white triangle around the exact same time it had its goldencross. You can also see a light yellow channel it has also broken up from, upon reaching the target of the white symmetrical triangle breakout, Quant should then be able to break upward from the blue channel as well which has a breakout target that can send Quant back to retesting it’s previous all time high. *not financial advice*

Apecoin chart per request.I’m not entirely sure how this chart will play out, currently looks like this chart’s price action is heading towards this brown trendline that will either serve as a double bottom neckline or if it holds resistance for a candle or few t will become the top trendline of a valid descending channel at that point, either way the target would be the same for a breakout from either pattern, won’t be able to dial in the exact placement of the dotted goldenrod colored measured move line until price chooses where it’s going to trigger the breakout but I believe I have arbitrarily placed it in a close enough radius to get a within the ballpark of a decent price target guesstimation. Once again we see a big bullish pump coinciding with the golden cross as well. *not financial advice*

ZRX confirms inverse head&shoulders breakout during goldencrossYet another chart proving how immediately bullish the golden cross has been on the day of the cross as it once again results in a breakout validating pump here.

XVG going parabolic upon 1day golden crossYet another shining example of apparently hall all boats rise thanks to the golden cross. Right when golden cross occurred Verge goes parabolic. It has now broken confidently above this inverse head and shoulders pattern and still would make 54% gains from its current spot to hit the full breakout target of the inverse head and shoulders pattern. Though Verge has long been considered a dead coin, I do recall talk that it may possibly one of the few cryptos that is currently ISO20022 compliant right now so that is indeed an advantage it has going for it right now. Possibly not so dead afterall, but this could also be a case of “All boats rise” with the current parabolic market conditions. Also wanna give a proper shoutout to my friend Saeid for believing in this one. Saeid focuses more on elliot waves and harmonic chart patterns and is a solid analyst himself, and he believed in XVGs potential to do something lke this much mroe than I did. *not financial advice*

Goldencross even causes coins like EOS to go parabolic
You know when even a long considered dead coin like EOS also responds with a parabolic pup on the day of its golden cross that at this point my hypothesis has to be proven. This is like the 20th example I’ve given of this occurring the same day as a chart’s golden cross. Remember this behavior the next time alt season begins during the second parabolic leg of a bitcoin bullrun. Anyways I never expected to chart an EOS chart but here we are. Would normally never hold this coin but do see it as an opportunity to at least take a position in it to its eventually double bottom breakout target. *not financial advice*

Arbitrum is back!ARB (Arbitrum) is making a major comeback, climbing back to the $1 mark!
After facing turbulence in the market, ARB is showing signs of resilience and strength. But here's where it gets even more exciting — we're potentially witnessing the formation of a *Golden Cross*!
For those who are familiar with technical analysis, a Golden Cross occurs when a short-term moving average (like the 50-day) crosses above a long-term moving average (such as the 200-day), signaling a possible breakout and a bullish trend ahead.
Could this be the start of a new uptrend for Arbitrum? With growing interest in Ethereum Layer 2 solutions, ARB's return to the $1 level could just be the beginning of something much bigger. The network’s speed, scalability, and low transaction costs continue to make it a standout player in the Ethereum ecosystem.
As more users flock to decentralized applications (dApps) and DeFi platforms, Arbitrum is well-positioned to capitalize on the growing demand. If the Golden Cross plays out as expected, we might see a surge in price momentum, attracting more investors and traders looking to ride the wave.
While the market is still volatile and unpredictable, ARB's return to $1 is a promising signal of potential bullish action in the near future. Keep an eye on the charts, because things could heat up fast!
