S&P Since Inception to 2020 weekly Golden Cross #2 Gain#3 length1958-2020. we just behind Mid 70s to the End of 90s .
Goldencross

XRP Making Moves Today Or Tomorrow The setup I've been pointing out is at hand. Lets see what is the outcome!
Every time I want to sell this asset I am lambasted by the irony of this situation. Regardless of the SEC issue and the ensuing bloodbath XRP has endured we have been consolidating in a price range that was very crucial just before the 2017 pump.
The SEC thing is far from over and could still go either way. Everyone who is saying it will certainly go one way or the other is cringe. Are you a fortune teller? Nobody knows is the reality.
Not Financial Advice.

GOLD - intresting buy zone I think first the market maker will hunting the stop loss.
Then they'll go up where there's liquidity.
liquidity is a stop loss.
Dear followers, the best "Thank you" will be your likes and comments!
Before to trade my ideas make your own analysis.
Thanks for your support!


OXT Bullish Setup This coin makes big & fast bullish moves.
It's been lagging relative to the rest of market.
I see a short term opportunity here.
Potential to retest August highs.
Not Financial Advice.

Golden Cross formed early in DecemberThings are looking good for the FTSE 100.
Not only has a Brexit deal been agreed, but 2 vaccines approved for use.
Early in December we saw a golden cross form on the daily chart.
For those who don't know, a golden cros is formed on the 50 and 200 MDA and is a good indicator ( along with the above ) as strong upword trend.
It seems a 7000 recovery is likely

NLOKNLOK stock seems ready for bullish momentum.
there are divergences everywhere, as the price had 2 lower hight, but MACD and RSI (which is above 50) have both higher hight. plus the volume has been lowering in the past 2 weeks' bear trend, which DOES NOT confirm the downtrend.
the price itself is also just above the MA 200, and the MA 20 and MA 50 just made a golden cross, which could happen soon too between MA 20 and MA 200.
right now, we are on top of the triangle, which is NOT a good thing, because it could fall all the way back to $18, losing $3 (10%+).
BUT, if it DOES exist the triangle, we can see a higher high, at least $24.30, which is All-Time High as we can see here.
it also shows how the price has been moving between the MA 200 in the monthly chart, and the upper trendline (resistance)
can the price break the high resistance? idk, we will see.
is the price in the upper part of the MA 200- resistance trend? yes, so pay attention and DO NOT buy long unless some bullish sight shows up.
last thing: I suggest NOT to buy and hold, but to do weeks or months trade here since it is risky until it does not break over the top resistance.

Sundial, potential jackpot #BullishAFSundial growers has been getting a lot of volume these past two months, even having a day where it achieved 2billion volume . This resulted in a golden cross, which will result in a bull run for sundial. After breaking out twice, and finding support after each break out. Sundial has extremely high potential to repeat this pattern and beat the previous break out high of $.98 cents. There are a ton of catalysts for this company that ALL point towards positive price movement. let’s start off with the fact that sundial has cleared all debt. Sundial is the ONLY cannabis company to have no debt. Sundial has a very low market cap compared to other cannabis companies. Tilray , Auroa, and Cronos group have market caps of 1billion +. I believe that sundial has room to grow its market cap, atleast to around 1billion. If you research sundial’s website they offer a wide array of great cannabis products, which they are constantly improving. Sundial is trying to make stronger thc potentcy in bud which is a great sign of strong future growth and progress. With Biden being elected, the house looking at the PACE bill, the culture right now with marijuana, and a stimulus check around the corner..marijuana industry as a whole is a ticking time bomb. I think sundial has the best profit potential. Price target 2.5 long, 1.38 swing.

EUR/NZD🇪🇺🇳🇿 to bounce from the Uptrend lineEUR/NZD🇪🇺🇳🇿 The pair has been moving inside the Ascending Triangle. As the Golden Cross and Deep Stochastic oversold suggest the price is going to bounce from the Uptrend line.
If you like the idea PLEASE don't forget to hit the LIKE 👍👍👍button
Also share your thoughts and charts here in the comment ⌨️ section

USDCHF long ideaDXY broke his falling wedge and now he is getting stronger than before, however USDCHF has also broken the falling channel and made a successful re-touch, accessing a long oder targeting easy 75pip, technically a golden crossover in a matter of hours In progress!

CARG - Unusual Call options activityLarge activity in CarGurus since this name typically trades less than 400 contracts per day. On Dec 11, 5,000 Dec $25 calls closing for $3.40. 5,000 Dec $27 calls bought for $2.00. 3,800 Jan 2021 $29 calls are trading; most bought for $1.55. The golden cross is almost there (50 dma cross over 200 dma). Analyst Davidson gave the stock an upgrade friday. Beware FOMC is Dec 16th, Good Luck this week!

Gold - can go lower.The trend line acts as support.
A breakdown of the trend line will give a good entry point.
Support 182, next support at 1800.
I talked in my posts about down move
You will learn the best place where we can trade this instrument at low risk.
Write in the comments all your questions and instruments analysis of which you want to see.
Friends, push the like button, write a comment, and share with your mates - that would be the best THANK YOU.
P.S. I personally will open entry if the price will show it according to my strategy.
Always make your analysis before a trade.

Federal Bank - Fresh Rally ?Call it a VCP or a Cup and Handle Breakout.
Golden Cross just happened on Daily Chart.
*****
Help Me to Help Us.
I believe in keeping the chart simple with minimal drawings & easy to interpret.
Always keep a stop loss to rescue you out of troubles.
So kindly express any disagreement & improvements so that we learn & earn together.
Please support the effort and appreciate it with a Like if you felt it deserves it and Following me would only add on to the motivation.

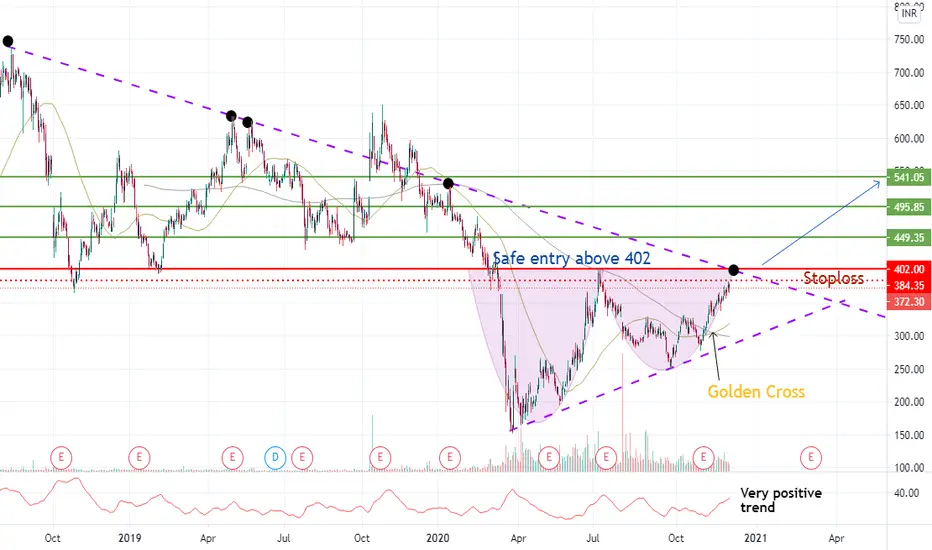
Bandhan Bank - Can it break the stiff resistance on 5th attempt?At 402 , there is a strong resistance from a long trend line.
Safe playing investors should enter only above 402 on "closing basis" for the targets in green in due course.
However, the ADX > 25 indicates a very strong trend at the moment backed by a Golden Cross recently.
So risky investors can take a chance entering at CMP- 373 for a target of 402 which is about 8% but a strict stop loss is mandatory. This 8% target might be achieved in the next few intraday sessions as well.
*****
Help Me to Help Us.
I believe in keeping the chart simple with minimal drawings & easy to interpret.
Always keep a stop loss to rescue you out of troubles.
So kindly express any disagreement & improvements so that we learn & earn together.
Please support the effort and appreciate it with a Like if you felt it deserves it and Following me would only add on to the motivation.
HATHWAY | Bullish setupHathway cable & DA Weekly is looking bullish:
MACD crossover on the weekly
weekly MAs setting up for a golden cross.

GOLDEN CROSSDigihost Technology's 50-day moving average line just crossed above its 200-day moving averge line, forming a GOLDEN CROSS, a strong BULLISH signal.
TradingView's tecnnical analysis summary for this stock is BUY:
www.tradingview.com
According to the Wall Street Journal, this stock has a price target of $2.00:
www.wsj.com
That is more than 419.48% higher than the currrent price of $0.385.
GLTA!


Gold - beautiful testing levelthe mirror level kept the fall.
The power for further fall is exhausted.

XRP Moon Cycle/Lambo SeasonThe Chart
- Green and Red Line on the chart represent the two different moving averages. (Top) From this we are able to see when a "Golden Cross" which represents a Bullish or Bearish sentiment that historically is followed by very high volatility. I circled the areas where the cross is occurring.
- Then the RSI. Currently XRP remains in high risk situation. Not necessary a bad thing. It implies there is current high volatility taken place. It sits above the 70 spot range. I like to compare the RSI to the energy source of the coin.
- On the bottom. Much more complicated. The ADX & DI. Simplest way to describe it. It showcases the strength of the next move. Today, you can see a wide open mouth gap be taken place. Compare historically.... very bullish sign for XRP.
I also published a simpler chart on XRP that explains WHY XRP. Fundamentally speaking, this coin has the best real world use case that crypto has to offer.
“People always want investments to go up like a line.…That’s just not reality. You make 80% of your money in 20% of the time in investing and you have to be patient.” - -
- Jeffery Gundlach
Quote that I like for XRP^

GOLD - price approaches the leve 7 times alreadyIf there is an accumulation above the level.
we can see a breakdown.
The price approaches the level 7 times already.
if the price goes above the level of 1874. cancel the breakdown.
Friends, push the like button, write a comment, and share with your mates - that would be the best THANK YOU.

Golden Cross on CBA EMA'sThe golden cross is a technical chart pattern indicating the potential for a major rally. The golden cross appears on a chart when a stock's short-term moving average crosses above its long-term moving average. The golden cross can be contrasted with a death cross indicating a bearish price movement

Confused GOLD 🥇 Sideways Trendthe detail is shown in the above Idea.
In my view, in this week, Gold Continues Sideways Trend Between Several Channels because of US-Market Confusing Situation After Vaccine News Considering Hammering In golden Line.
I hope that This Idea is Useful for Gold Traders.
