XAUUSD Gold | SWING - 25. AUGU. 2020Hello Traders Welcome Back.
***
Here is the full analysis for this pair, let me know in the comment section below if you have any questions, the entry will be taken only if all rules of the strategies will be satisfied. I suggest you keep this pair on your watchlist and see if the rules of your strategy are satisfied.
***
Please consider to put a like to my idea for supporting me & subscribe for more ideas.
Goldencross

XAUUSD Gold vs US Dollar | SWING - 25. AUGU. 2020Hello Traders Welcome Back.
***
Here is the full analysis for this pair, let me know in the comment section below if you have any questions, the entry will be taken only if all rules of the strategies will be satisfied. I suggest you keep this pair on your watchlist and see if the rules of your strategy are satisfied.
***
Please consider to put a like to my idea for supporting me & subscribe for more ideas.

Gold - preparing for a move upwardsHi all traders.
Gold on h4 is showing as a potential inverted h&S confluence with 200ma with rsi pointing in the upwards direction.
With so many confluence, the possibility of a strong move upwards by gold is possible.
If neckline is broken , we will see some bull strength and for further confirmation, trend line must be broken.

Litecoin Golden Cross + Inv H&S Breakout Can Take it to $105Looking very bullish here for litecoin as it inches above the neckline of a very tiny shouldered inverse head and shoulder pattern. These type of head and shoulders patterns are great because many technical analysts end up missing spotting them before it's too late. This coupled with the golden cross happening now on the daily is a very good sign for litecoin to regain some of the ground it has lost over the bear market. As always, we still need to wait for confirmation that it has broken out of the pattern but if we get that confirmation $105 is the target.

Gold Buy.. Bullish! long!DISCLAIMER:
My analysis is just a trading idea! As a trader you should consider your own risk:reward ratio and do proper lot sizing according to your margin and leverage level.
Good Luck!

GOLD NEXT POSSIABILITY(HEAD & SHOULDER PATTERN)Head & shoulder & ABCD PATTERN is formed Above is free 4H chart explanation No Daily changes so far after a very Bearish E.U. session opening on usually volatile Hourly candles. We can easily spot on Hourly 4 chart how the current slow falling consolidation is repeating the pattern of March 7 - 20 sequence. Stock markets and Bond notes are on usual levels but of course it all really depends on U.S. session opening Bell on Monday. One of the most volatile Trading days was on Wednesday’s session according to the Historical Data with a 27.80 point differential on Daily chart , also seen by the wide margin (Neutral) on mostly all Hourly charts. Technical analysis could be immediately effective(60-40%) on such high volatility levels. Price-action was close to reaching the Short-term Resistance of the Higher Low much sooner than we expected as the market turned this fear into a Volatility similar to the Covid parabola early in February-March, which could be the reason of this unexplained Gold decline. As it happened then, the market psychology is similar, (both ways around) and as soon as the Stock markets recover, Gold's move will deflate and reach at least the Fibonacci retracement from yesterday’s session bottom. The Hourly 1 chart is nearly Oversold and the RSI in particular above the 3 month Support. Hourly 4 chart printed clear Head and Shoulders formation, on the other hand - MA50 was broken on yesterday's session multiple times. This just shows the continued high degree of volatility and how unstable the market (along with most asset classes) has become. As for the current situation, Gold broke the 1-Month Support and automatically should be call for 1,900.50 (which represents Monthly Low) extension but, by recent experience , we will position ourselves accordingly and continue monitoring the market. Technically, breaking above #MA50 brings 1,971.80 Resistance in motion while below it, 1,900.50 (Support). We will Trade the breakout for longterm but as you know SCALPING IS THE KEY ;)
Entries should be taken only if all the rules of entries are satisfied.

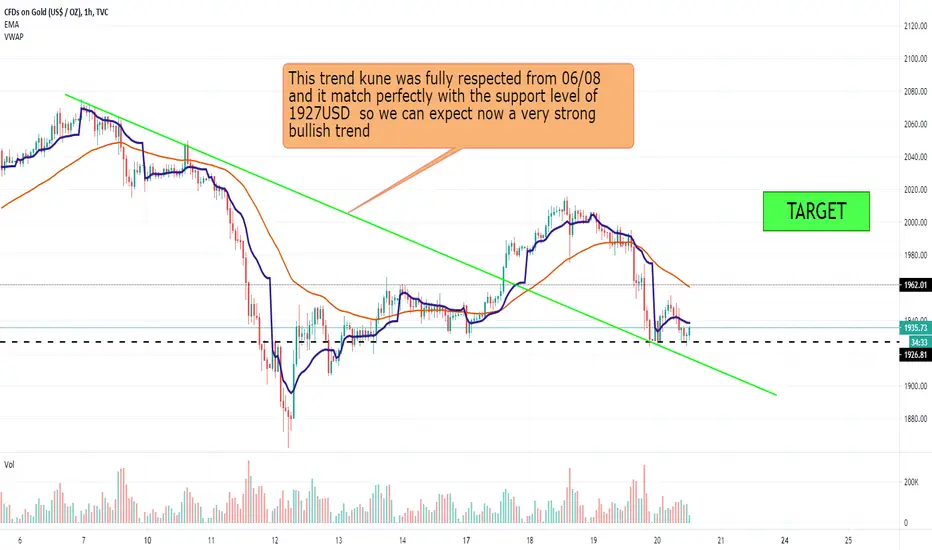
GOLD ANALYSIS AND FORECAST FOR THE NEXT WEEK UNTIL 28th AUGUSTPlease share with me your thoughts,
Regards


APEX FROZEN FOODS - Wait for breakoutCMP 266
A 3 VCP has been formed and is trading at the resistance.
It is also within the 'Ascending Triangle' .
A GoldenCross is also being awaited soon.
On the upside the potential of gains is good at 19.5% and 28% above the resistance of 330.
*****
Help Me to Help Us.
I believe in keeping the chart simple with minimal drawings & easy to interpret.
So kindly express any disagreement & improvements so that we learn & earn together.
Please support the effort and appreciate it with a Like if you felt it deserves it and Following me would only add on to the confidence.

KUSAMA (KSM:BTC) broke back up above 200 SMA on the 30 mins ...KUSAMA (KSM:BTC) broke back up above 200 SMA on the 30 mins after period of continued rejection..
Kusama was originally planned as a testnet for Polkadot, but from what I am hearing so far, it could become its own independent chain in its own right (at the same time as functioning as a test net for Polkadot too) -- where certain projects (that were not successful with securing a Polkadot slot) will instead run exclusively on the Kusama platform rather than migrating onto the Polkadot network.
(Correct me if I am wrong on the fundamentals side of things, I'm focused mainly on TA). :)
---
TA
KSM now supported above orange 200 SMA on the 30mins
Need to wait to see if it will continue sideways, continuing to be supported above the 200 SMA, to eventually turn the bearish Ichicloud bullish again, before a recovery can be expected.
Bullish wicks and 21EMA/50SMA bullish cross registered (circled in main chart) on the 30 mins.
PRISM Oscillators Analysis
Hidden Bullish Divergence adhered.
Transparent blue Volume falling off significantly as price increase though.
Acceleration heading up, pulling up Momentum
Still waiting patiently for confirmation for a suitable entry as a long-term investment, with a couple of small stop-limit buys modulated by a combination of Cyber Ensemble and PRISM Oscillators Set, and Ichicloud state, set for now.

GOLDEN CROSS50MA about to cross up on the 200MA, bullish signal.
Entry is yet to be determined, Stop loss will be the 200 MA.
First goal price will be $27 (or $25 since there's a pretty noticeable resistance line right around $25)

Macro Ascending Triangle for BNS?On the RSI there's noticeably a triple bottom coinciding with three touch points on the upward sloping support of the Ascending Triangle.
If you move the chart left there's the first touch point of four on the upward sloping support of the ascending triangle dating back in 2003.
On a 5 year chart attached to this all time log scale chart there's been a golden cross on the KST that isn't noticeable here, the golden cross is recognizable on a 1 year chart as well.

Ascending Triangle formation for TNY.The green upward sloping line of support has held multiple touch points, potentially indicating the pattern is a Ascending Triangle.
Notice the RSI is respecting the blue downward sloping resistance of what appears like a bull flag or descending triangle.
The KST is on the verge of forming a bullish cross potentially where I have placed the finger pointing upward, previous example can be seen in April and June.

GOLD XAU/USD - SWING - 18. AUGU. 2020Welcome to the Day Trading Setup (GOLD)!
This is my personal view of price action
***
4 four hours
drop
***
Forex Swing
SELL GOLD
Entry Level @ $2,076
SL @ $2,094
TP @ $1,965
(Remember to add a few points for all levels - different brokers!)
***
Leave us a comment or want to keep our content free and dynamic.
Have a wonderful day!
***
Please consider to put a like to my idea for supporting me & subscribe for more ideas.
***
right Now

Inverse Head & Shoulders in play on the XRPBTC 1 day chartLooks like we may see a bullish breakout of this inverse head and shoulders pattern coincide with the XRPBTC goldencross...seen lots of fakeouts in the past so I'm not gonna get too excited about this one just yet but will definitely be keeping my eyes on it because if this pattern confirms XRP should see some significant upside against btc. We also appear to be beginning to break up from a bullflag with a very long pole.

Gold Buy Setup for 2000 and 2045DISCLAIMER:
My analysis is just a trading idea! As a trader you should consider your own risk:reward ratio and do proper lot sizing according to your margin and leverage level.
Good Luck!


NBEV Golden Cross on daily!MA50 crossing MA200 on daily chart.
It's resting on the ~2.20 support.
Is it the time to pack the bags?

Gold - in the process of correctionGold is currently making an adjustment. In a few I think it will fall by 1940/1920. Then my expectations are for a new record and a higher peak as if the trend of rising gold prices continues. The expected levels to reach are 2100/2150. This is my forecast for the next 2 weeks. Success!

RUT- The final golden cross for the major indexsAccording to Finviz, more than 75% of stocks are above SMA50 and close to 60% of stocks are above SMA 200. Furthermore, SPX has stayed above 3200 for a month.
Historically, DJI is usually the first index to recover after the market crash because investors want to put their money in safe mega cap and blue chip stocks
during the bottom-out process and time of uncertainty.
However, Covid-19 is producing the favorable environment for e-commerce company and internet/IT services company that power e-commerce to thrive, leading to the NDX's wild surge and SPX & DJI's unusual lag.
Russel 2000, the small cap index, is usually the last one to join the rally because it is usually deemed as a risky investment by investors, especially during the time of uncertainty.
Therefore, when investors flock to RUT (Russel 2000), it could signal and reaffirm the bullish sentiment among investors, drawing the last of doubters and FOMOers into the market.
That time could be now.

LYC Bullish move above 2020 highLYC broke it's bull flag patter at end of July and is now set to break it's 2020 high and then the chase is on for the 52 week high ($2.95) with the 1st profit target being the Fibonacci level of 0.786 which is a $2.73 share price. Recent supporting bullish activity on the chart is the golden 50 and 200 moving average cross occurring. Add to this that rare earths sector which LYC operate in is currently in flavour as well. My opinion is bullish on this with a 1st proft target of $2.73 before some consolidation and a run towards the 52 week. This is only my opinion and you should always do your own research before investing.

FROM 2012 TO NOWADAY - GOLD ANALYSIS -Well i think that the 3 trend lines will act as a key levels in the upcoming days
And the market will go down with a huge probability if the volume confirm the new downtrend,
Thanks for watching
