BULLISH GOLDEN CROSS ON JUNIOR GOLD MINERS 15MINA BULLISH TECHNICAL DEVELOPMENT ON THE 15M JUNIOR GOLD MINERS GDXJ CHART
AMEX:GDXJ AMEX:JNUG BMV:JNUG CURRENCYCOM:JNUG CURRENCYCOM:JDST BVL:JNUG BMV:JDST CURRENCYCOM:JDST OANDA:XAUUSD OANDA:XAUCAD AMEX:GDX AMEX:BTG NYSE:AUY BCBA:AUY AMEX:SILV NASDAQ:PAAS AMEX:SGDJ AMEX:SILJ SWB:G2XJ
SOIURCE: www.investopedia.com
What is a Golden Cross?
The golden cross is a candlestick pattern that is a bullish signal in which a relatively short-term moving average crosses above a long-term moving average. The golden cross is a bullish breakout pattern formed from a crossover involving a security's short-term moving average (such as the 15-day moving average) breaking above its long-term moving average (such as the 50-day moving average) or resistance level. As long-term indicators carry more weight, the golden cross indicates a bull market on the horizon and is reinforced by high trading volumes.
www.investopedia.com():max_bytes(150000):strip_icc():format(webp)/GoldenCross-5c6592b646e0fb0001a91e29.png
KEY TAKEAWAYS
The golden cross is a technical chart pattern indicating the potential for a major rally.
The golden cross appears on a chart when a stock’s short-term moving average crosses above its long-term moving average.
The golden cross can be contrasted with a death cross indicating a bearish price movement.
Goldencross

Gold - Reversal?Break above the descending broadening wedge that has formed
This may be a nice buy opportunity
Not as nice as the previous couple buy opportunities on gold that have presented themselves


LONG - CELR - Trading OpportunityWith BTC's sudden fall it is now the perfect time for some alts to strike back with a strong rebound of previous supports. BINANCE:CELRBTC looking pretty strong right here bouncing from a golden cross on the 12h chart, the volume that's been coming in the past few weeks is pretty insane as well.
This is a play that will take some time to play out so patience is key.
Entry: 0.00000029
Target 1: 0.00000037
Target 2: 0.00000043
SL: 0.00000026
CryptoCue is not providing investment advice and is not taking subscribers’ personal circumstances into consideration when discussing investments. Investment involves a high degree of risk and should be considered only by persons who can afford to sustain a loss of their entire position.
CryptoCue is not registered, licensed or authorized to provide investment advice and is simply providing an opinion, which is given without any liability or reliance whatsoever. The information contained here is not an offer or solicitation or recommendation or advice to buy, hold, or sell any security. CryptoCue makes no representation as to the completeness, accuracy or timeliness of the material provided and all information and opinions provided by CryptoCue are subject to change without notice and provided on a non-reliance basis and without acceptance of any liability or responsibility whatsoever or howsoever arising. You hereby irrevocably and unconditionally waive, release and discharge: (a) any and all accrued rights and/or benefits you may have against CryptoCue in respect of any opinion expressed or information conveyed by CryptoCue at any time; (b) any and all Claims you may have against CryptoCue arising out of any opinion expressed or information conveyed by CryptoCue at any time; (c) CryptoCue from all and any claims (whether actual or contingent and whether as an employee, office holder or in any other capacity whatsoever) including, without limitation, Claims you may have against CryptoCue arising out of any opinion expressed or information conveyed by CryptoCue at any time. ("Claims" shall include any action, proceeding, claim, demand, judgment or judgment sum of whatsoever nature or howsoever arising.) You hereby agree to indemnify and hold harmless CryptoCue in respect of any and all Losses paid, discharged, sustained or incurred by CryptoCue in the event of bringing any Claim against CryptoCue. (“Losses” shall include any and all liabilities, costs, expenses, damages, fines, impositions or losses (including but not limited to any direct, indirect or consequential losses, loss of profit, loss of earnings , loss of reputation and all interest, penalties and legal costs (calculated on a full indemnity basis) and all other reasonable professional costs and expenses and any associated value-added tax) of whatsoever nature and/or judgment sums (including interest thereon).

Bitcoin Daily Bullish SignalsOn the daily Bitcoin chart we can spot several bullish signals:
- Touch support line of parallel channel
- Golden cross 50MA over 200MA
- Hidden bullish divergence on RSI
Target 1: Psychological resistance @10k
Target 2: Long-term resistance line (white) @10.4k

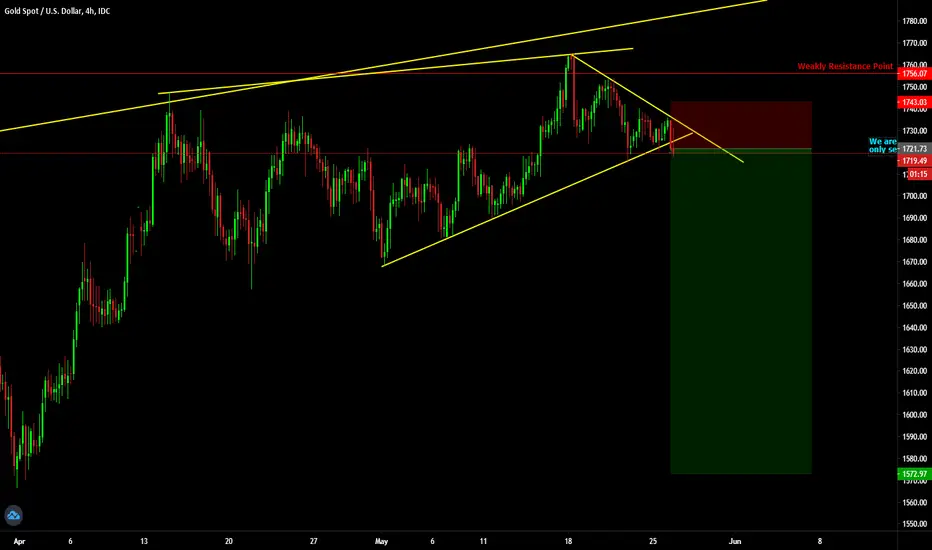
GOLD - Going sell ___ Hy! Smart Trader, Welcome to My Analysis and forecasting Section on Trading view. Follow me for more update
We are Creative price action Trader. Join with us as we document the in's and out's of my trading journey. we are publish Multiple Time frame Analysis and forecasting (totally Free)
Never Trade alone
we really hope you enjoy All trade..
Disclaimer:
the content on this analysis is subject to change at any time without notice, and is provided for the sole purpose of assisting traders to make independent investment decisions.
_______________________________________________________________________________________________
Thank you for your support!

Bitcoin: DOWN to 8200$?Leave a comment and like this idea to support my work and the production of more analysis.
I see a possible movement downwards, and I expect it to happen soon. Why I say that? Volumes are coming and from the local bottom of the Volumes we are now facing new volumes coming.
Let's see.
I would like to know your opinion! Share here your thoughts and let's debate together.
Mike

LRN 50/200 Cross + Wedge BreakoutCurrently trading in an expanding channel/megaphone pattern with a local wedge forming in the gap. I like the $25 - $26 area to initiate a long as that was a prior breakdown and breakout level, and at that price a wedge breakout and MACD cross should have occurred. Additionally, the 50 MA is setting up for a cross of the 200 MA at a very aggressive slope. If you were to examine the 5 and 20 SMA (which are normally part of my analysis but have been removed due to the business of my annotations) you would see they are also setting up in a very bullish manner. RSI holding strong during consolidation and MACD cross appears set to cross tomorrow. Take a moment to look at how the stock has historically respected support/resistance and channels. This setup is very reminiscent of my 'BDSI long' idea which is at the very bottom of my page so I hope you take a look at that and see the similarity and most importantly the resulting success of that setup.

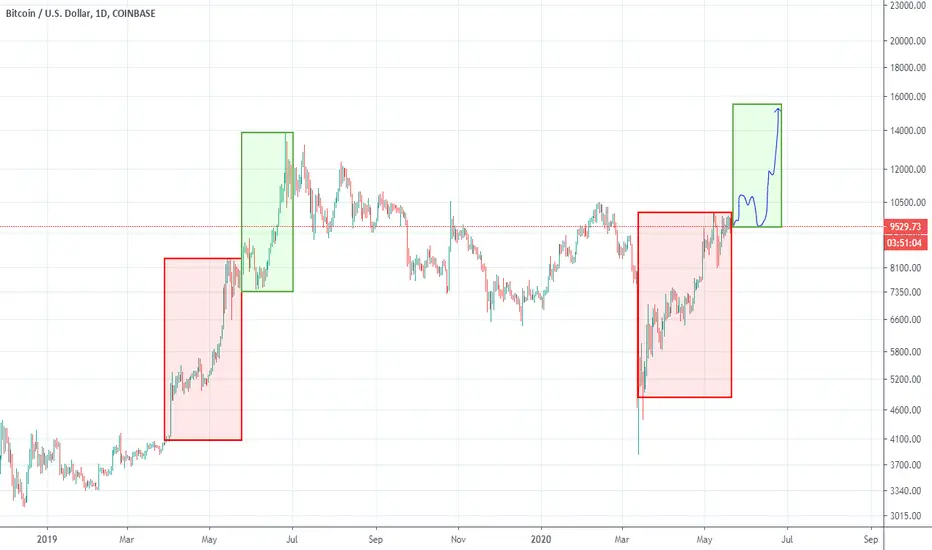
History doesn't repeat itself, but it does rhymeLast year in March, euphoria was setting in and the thought of the bear market ending was getting everyone excited. Around April 1st, Bitcoin took up and had an explosive move to the upside. Fast forward to May 2019, Bitcoin paused for wave 3 of it's 5 waves up. What's interesting about this move is the similarities we can see in the current move. This year bitcoin had a massive dump in march, and the spring-boarded back up. We are now hovering in the ~9500 range. If you compare the two moves, you can see some close correlation with not only the waves up, but the price action. If this is a repeat of last year, we can see bitcoin making a higher high on longer time frames, confirming the end of the bear market and potential for sustained long term growth for the next few years. COINBASE:BTCUSD

Short trade in the Goldwait for the pullback, and buy the Gold, the TP will be 11 ticks and SL will be 4 ticks

GOLD 85% confirm TradeLike comment and follow
and if you are facing any problem in trading feel free to leave a message

GBPJPY Daily - a possible scenario Clear and simple. We go short to catch 180-200 pips on the way down and from there (126.000 area) the price may bounce back from a solid support and go higher.
Trade safe and follow us!

Ascending Triangle breakout for Bitcoin?Inside of the ascending triangle on a micro scale Bitcoin is forming a cup & handle, there is merit potentially for a inverted H&S as well.
The RSI is displaying a inverse H&S, interesting because the moving averages are about to converge
Only time will tell, but a golden cross followed by an immediate death cross seems like a future occurrence.
3 GOLDEN CROSSES!!This is a huge blow up of the Daily on Bitstamp.. go to your charts and see, and back-test all 3 GOLDEN CROSSES Now in process of playing out now! All are still Valid Golden Crosses in Play at the same time!!
The 12HR, 1DAY, AND 2DAY. Using the 55EMA crossing up over the 200EMA.. usually comes back and tests the 50EMA or the 21EMA and Blast-off

ENJ/BTC 533% This Alt is Ready to Explode? ENJ being one of the most promising project and the alt that hasn’t been popped yet.
When it does it goes insanely new highs, basically new ATHs.
Reason why I am bullish:
Hit the bottom and reversed already.
Rejected from the first Resistance and jumped from the support around 1257.
Trading above the 50D and 200D MA which is a very bullish sign when it comes to alts.
Every time it has hot the lower support line which also happens to be the bottom it has gone insanely high:
First time: 2063%
Second Time: 761%
This time I am expecting as per the chart that we may see almost a 534% gain in ENJ from here.
Incoming Golden Cross.
Accumulation: 1190 to 1370
Targets:
TP1: 1700
TP2: 2395
TP3: 3418
TP4: 4779
TP5: 6373
TP6: 8600
(This is not a financial advise)
Trade with caution.
I have my bag ready.
Please hit that like button if you like my idea and do share your views in the comment section.
#Peace

$FB Golden Cross - Medium Term Target $24850D EMA Crossing over 200D EMA on Daily Chart - positive sign and used as a buy signal for many investors.
FB broke through gap fill resistance at $210 last week...pulling back to close just above that line today.
Assuming a close above $210 tomorrow, this can be viewed as a successful retest of $210 now as support.
Fueled by the moving average crossover and overall bullish near term market trend, we should see a strong drive back to all-time high area (~$224) by end of next week. There's a good reason why Facebook is always a top holding of hedge funds.
See chart for a possible path over the next month.
Target: $248 by mid to late June
*This analysis assumes neutral to positive developments in coronavirus/reopening economy situation over the next month.
Educational not investment advice.

KEY REASONS WHY GOLD PRICES IS ABOUT TO EXPLODEGold prices are slightly lower today as risk appetite of trader and investor has been increased due to the significant gains we have witnessed in the global equity market and in crude oil prices today. The precious metal sector has also been pressured as reports came out that Major countries in Europe and North America are beginning to open up their local economies gradually. Germany’s highest court said today that the European Central Bank exceeded its powers by launching a massive quantitative easing effort in 2015, and ordered the German government ”to take active steps” against the program in its current form. This would be bullish for the precious metal sector in the long term as it once again raises serious doubts about the long-term sustainability of the European Union.
The coronavirus outbreak, which was first detected in China, has infected people in 185 countries. Central banks all around the world have slashed interest rates and injected trillions of dollars in order to prevent the economy from complete collapse. But with numerous countries have been put under strict lockdown, major industrial production chains and global economic activity have been brought to a halt. The IMF described the decline as the worst since the Great Depression of the 1930s. Although it said that the coronavirus has plunged the world into a “crisis like no other”, it does expect global growth to rise to 5.8% next year if the pandemic fades in the second half of 2020.
Fed purchased almost $2 trillion in Treasurys due to which the Fed’s balance sheet has reached a record of $6.6 trillion, up from $4.2 trillion in February. The Fed balance sheet has increased over twice the rate compared to the 2008 housing crisis. We have also seen the price of a barrel of West Texas Intermediate (WTI) turned negative for the first time in history. Deflation could become a very severe threat to the underpressure economy. We are already witnessing Inflation in the wealthiest countries collapsing at the fastest pace since the financial crisis, as the coronavirus outbreak sinks the world into the deepest recession. Too much money printing by the Fed could eventually lead to hyperinflation and could trigger a downward fall in the U.S dollar.
New unemployment figures reached 3.84 million last week due to the pandemic crisis. Consumer spending has been reduced significantly due to rising unemployment and uncertainty, which compose two-thirds of U.S. GDP. Chairman Powell stated that he sees consumer spending continually declining and called the current situation the worst crisis he has seen in his lifetime. Powell acknowledged that the US entered a recession. The Fed has already cut its benchmark fed funds rate close to zero and purchased almost $2 trillion in Treasurys due to which the Fed’s balance sheet has reached a record of $6.6 trillion, up from $4.2 trillion in February.
U.S-China trade war which has been the major geopolitical and macroeconomic factor for the precious metal sector could get escalated pretty quickly as Donald Trump threatens China with new tariffs.”We signed a trade deal where they’re supposed to buy, and they’ve been buying a lot, actually. But that now becomes secondary to what took place with the virus,” Trump said. “The virus situation is just not acceptable.”
Under the normal seasonality for gold, may usually is not a good month and tends to be bearish for the gold however we are not in normal seasonality conditions and even though we might witness slight correction in the gold prices it would be a mistake to try to capture an extra dollar or two at the risk of missing the next major move up. We’re looking at support around $1,630.In may we would also see many economies slowly begin to re-open however we believe economies re-opening will not have much of an impact on gold as It’s going to take much longer to unfreeze the economy than it took to freeze it. The possibility of the second wave of the virus is also imposing a serious threat for the world economy which could end up increasing the longer-term economic damage from the virus.
Implications on Gold
Gold tends to surge in uncertainty and there are lots of uncertainty that exist right now which could drive the prices of the precious metal sector substantially higher. We don’t know how this virus is going to impact our lives?.how long the shutdown will continue? What if the second wave of the virus emerges?. How fast can businesses re-open? will coronavirus change the world permanently? Those are just big unknowns right now which would be supportive for the sector. The statement released by Federal Reserve along with the statements made by Chairman Powell has also increased the bullish outlook for gold. Under the normal seasonality for gold, may usually is not a good month and tends to be bearish for the gold however we are not in normal seasonality conditions and even though we might witness slight correction in the gold prices it would be a mistake to try to capture an extra dollar or two at the risk of missing the next major move up. In may we would also see many economies slowly begin to re-open however we believe economies re-opening will not have much of an impact on gold as It’s going to take much longer to unfreeze the economy than it took to freeze it. The possibility of the second wave of the virus is also imposing a serious threat for the world economy which could end up increasing the longer-term economic damage from the virus. The uncertainty driven by the pandemic, the influence of COVID-19 on global markets, and the global expansion of central-bank balance sheets will ultimately be very positive for gold. We believe Gold could test $1740-$1760 zone and It wouldn’t take a whole lot to push gold up to $1,900.Although the long term picture for the yellow metal is extremely bullish, in the short term Gold needs to pull itself back above the $1700 soon in order to support the strong bullish sentiments. Major supports resides at $1657,$1600,$1550, and $1450.Breaking below the March low of $1450 would indicate the end of the gold’s bull market. However, with keeping the bearish aspect in mind we don’t think gold would fall significantly from the price it’s currently trading at and even though we might witness slight correction in the gold prices it would be a mistake to try to capture an extra dollar or two at the risk of missing the next major move up.

2DAY GOLDEN CROSS IN PLAY2 DAY AND 12 HR GOLDEN CROSSES...Marked by the little Black Arrow...Soon to add the Daily Golden cross this week! Play with the Chart, BTC fell back to the previous formation the bottom of the flag is now resistance, back below the major 3 year Triangle trend in Red. Weekly could not close above 3 year trend line and may back-test the Golden pocket on the Fib 61.8-65%... to $6K... right around the 200EMA & 200MA...black and red horizonal rays.... then all the supports around $8k before that...And don't forget...the CME GAPS at 10K and 11800K, so....
which way will BTC go ???
Maybe up?
Maybe down?
Maybe sideways?
All we know for sure is it won't go backwards! ...lol
Bull Long Term

The bulls havn't lost yet!Welcome to my daily market update (11/05/20):
• Damn, I wanted to post yesterday a market update but a few minutes right before I was done, the market went crazy, which is extremely fun!, my expectations were right, and we finally received my weekly red candle (Or did we? Few more hours to go xd), so I delayed my update until now.
• So what we have so far on mid-term for bullish?
- We are still riding the mid-term bullish trend, and just corrected to 0.6’ fib levels (Which is very good for such recovery), and used daily e50+e200 as support (Golden cross upon us?):
- We still have a gap to fill on after daily+weekly close:
- And we created a higher low on 4h (The real question is if we will create a higher high as well?):
- Now it’s good place to ladder bullish position, if we create higher high then most likely we are going to pass this 4h e21, and shoot to close CME:
• And what we have on the mid-term bear side?
- We are under the 4h e21 which we were riding so far, so it will act as resistance now.
- We didn’t create higher high yet so we might still create a lower high and a lower low, and on this case our next target is7750:
• Now don’t get me wrong, the mid-term is still bullish and might break through the the big-term trend, but we should not forget some keypoints:
1. All markets (Such as DowJones and S&P500 and others) pretty much exhausted with this recovery, and might start crushing the second wave (BTC will also crush on such moment, again)
2. Our big-term is still in this bearish channel (And now we have enough liquidity to push down, especially if close below the weekly e21):
3. The halving bullish narrative is almost over, the moment we pass this event, a lot of retail (And especially whales) might just dump their profits since the event is over.
• My recommendation for now, is to stay with the mid-term bullish trend which isn’t invalidated yet.
I personally as you well know, am a speculations trader, and thus I keep on focusing the shorts as I did so far, until we pass 10500 with enough confirmations that we are on a bullish market again.

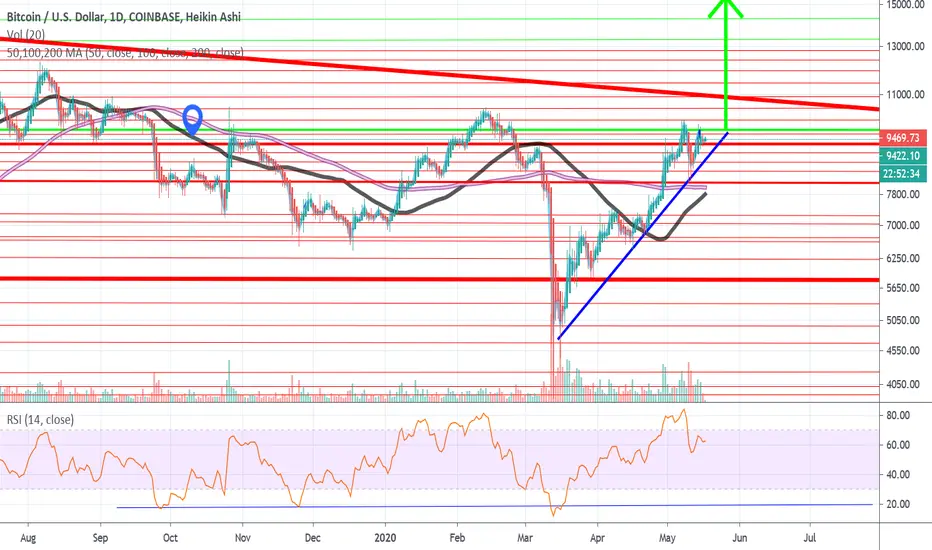
Bitcoin Long-Term AnalysisAfter some heavy corrections due to playing out some divergences and negative momentum, now Bitcoin tested the 12H and 2D Golden Crosses. So far so good.
But the Change of behavior is when a 12H candle closes below MA200 and/or a 2D candle close below MA200 . that is when I say this is not a healthy correction and probably BTC will test mid $ 6000 s.
Also, the 61.8 is at $ 8200 . so that would confirm that level as a change of behavior.
But as long as that wouldn't happen, Bitcoin is not in danger. I am long from $ 8200 (now it's risk-free) and my Stop would be the condition above that I said. (but not in weekends)

Bitcoin Golden CrossBitcoin just confirmed 50/200 moving average golden cross in the 12 hour chart!!!
