The bulls havn't lost yet!Welcome to my daily market update (11/05/20):
• Damn, I wanted to post yesterday a market update but a few minutes right before I was done, the market went crazy, which is extremely fun!, my expectations were right, and we finally received my weekly red candle (Or did we? Few more hours to go xd), so I delayed my update until now.
• So what we have so far on mid-term for bullish?
- We are still riding the mid-term bullish trend, and just corrected to 0.6’ fib levels (Which is very good for such recovery), and used daily e50+e200 as support (Golden cross upon us?):
- We still have a gap to fill on after daily+weekly close:
- And we created a higher low on 4h (The real question is if we will create a higher high as well?):
- Now it’s good place to ladder bullish position, if we create higher high then most likely we are going to pass this 4h e21, and shoot to close CME:
• And what we have on the mid-term bear side?
- We are under the 4h e21 which we were riding so far, so it will act as resistance now.
- We didn’t create higher high yet so we might still create a lower high and a lower low, and on this case our next target is7750:
• Now don’t get me wrong, the mid-term is still bullish and might break through the the big-term trend, but we should not forget some keypoints:
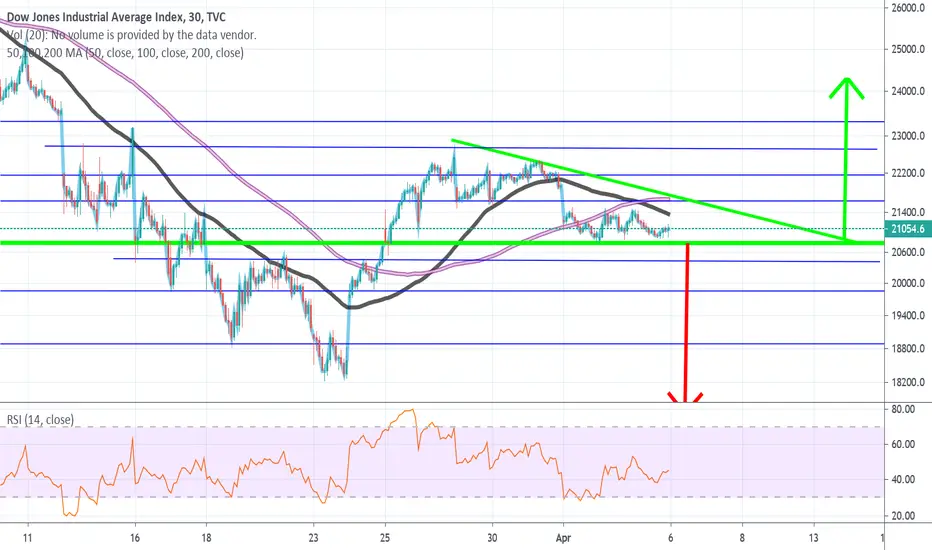
1. All markets (Such as DowJones and S&P500 and others) pretty much exhausted with this recovery, and might start crushing the second wave (BTC will also crush on such moment, again)
2. Our big-term is still in this bearish channel (And now we have enough liquidity to push down, especially if close below the weekly e21):
3. The halving bullish narrative is almost over, the moment we pass this event, a lot of retail (And especially whales) might just dump their profits since the event is over.
• My recommendation for now, is to stay with the mid-term bullish trend which isn’t invalidated yet.
I personally as you well know, am a speculations trader, and thus I keep on focusing the shorts as I did so far, until we pass 10500 with enough confirmations that we are on a bullish market again.
Goldencross

Bitcoin Long-Term AnalysisAfter some heavy corrections due to playing out some divergences and negative momentum, now Bitcoin tested the 12H and 2D Golden Crosses. So far so good.
But the Change of behavior is when a 12H candle closes below MA200 and/or a 2D candle close below MA200 . that is when I say this is not a healthy correction and probably BTC will test mid $ 6000 s.
Also, the 61.8 is at $ 8200 . so that would confirm that level as a change of behavior.
But as long as that wouldn't happen, Bitcoin is not in danger. I am long from $ 8200 (now it's risk-free) and my Stop would be the condition above that I said. (but not in weekends)

Bitcoin Golden CrossBitcoin just confirmed 50/200 moving average golden cross in the 12 hour chart!!!

Bitcoin Mid-Term AnalysisAfter some ranging price action, now the 12H Golden Cross and EMA21 tests are confirmed.
The 2D Golden Cross is on the way but not confirmed yet. As you can see MA200 on 2D TF is good support.
If a 4H candle closes below $ 8617 or wick below $ 8527 , it would probably test the lower support zone ($ 7800 ~$ 7900 ).
If a 12H candle close above $ 9070 or a 4H candle close above $ 9200 , it would probably first test $ 9300 and upper resistance zone ($ 9600 ~$ 9700 ).
Prices are on BitMEX.

GOLD possibilities ( Video analysis coming out as well)This is a good time to enter on Gold if the Gold crosses the 1665 level then we can enter in sell with tp@1597
second possibility which has the highest prosperity is entering in Gold now in buy with tp@1774 we can monitor the trend at 1750 if we find Gold retracing from 1750 level we can close out otherwise we can wait till 1750
For more analysis on different pairs leave the name of the pair in the comment section but first we need to like and follow
give feedback in the comment section

BTC going to touch 10366 or 11K before ABC?hello traders,
hope you catch some of the wildest pump in history,....
next levels are a lot harder to predict since we are closing to halving, so playing with 50% of the usual position is recommeded.
lets get to the analise:
Please note we have touched 9400 and diped to 8666 which now acts as Support, as long as it acts as S, next level can be breached, and that is 9666 and it could take us to 10366 and 11k dip or 10366 and dip or straight to 11k and dip, either way it looks like it has some more room to the upside, also the 50 and 200 emas are still very apart, and they kinda need to come to 4% of difference to be claimed as TOP, or the golden cross should be made and we start dipping again.
anyway, it looks like the top is still far away, also after ABC or after halving retracement ....BTC and crypto as whole is in crazy good condition to be bulish on the long TM, ...lets see how far will it bring us.
p.s. no position in BTC, only alts/usd atm, crazy btc :)

Gold confirm 400 pips upcomingGold will be flying to 1750 or even higher starting from today ,
if you want analysis on more pairs first like and follow then leave the name of the pair in the comment section

Gold - on 8 years old all the time highGold on all timeframes is a bullish scenario, but we have to keep in mind that we are 8 years old all the time high. There is not enough physical gold - the gold derivatives markets may have the same situation as oil, only in the opposite direction. If shorts can't deliver the bullions required by futures contracts, expect huge volatility and panic in the market. Many ETFs on gold guarantee physical strength, but as much physical gold is simply not in the world as many derivatives on it. Futures contracts can be secured with gold, which has not even been mined in the mines yet, but will be mined in the near future, but this future may not come so soon, given the quarantine of gold mines. Whoever trades futures and wants to sort, make sure you understand the terms of the contract if your shorts can't be closed by the market.
Dear followers, the best "Thank you" will be your likes and comments!

Gold entries for the coming weekIf you want analysis on more pairs
leave the name of the pairs in the comment section
Do like and subscribe

Bitcoin 2D Golden/Death CrossesBitcoin 2D (Golden/Death) Crosses case study shows that after these crosses, price action will test one or more EMAs to confirm the cross and Bots & Algos.
Will it happen again this time?
With every 2D Candle close, the momentum between EMA200 and EMA55 becomes stronger to the downside.
Meanwhile, Bitcoin could test the 2 EMAs but the change of behavior is when a candle closes above EMA200.
So as long as BTC is below EMA21, I am Bearish. but if a candle closes above EMA200 ( fake the death cross ) - based on PriceAction - I become Neutral or Bullish.

Golden ratio for the golden crossMonero fibonacci spiral, looks like a buy
Golden cross can be seen
Price can be seen in green box to climb the fib spiral

Gold futures - shorts from the level? on the monthly timeframe came to the level on the overvalued ATR.
on the weekly timeframe the level is the same, came up on a normal ATR if you compare the last 5 candles.
on the daytime timeframe closed under the level. Could be a breakthrough, but only after consolidation.
I'm counting on a false positive.
on a 4:00 timeframe. wasn't going to make it to the level.
indicators AO, RSI show that the price goes up without a driving force.
the scenario on the chart.

RSI "DEATH CROSS" & "GOLDEN CROSS" during Pandemic VolatilityJust a quick idea that shows how, as the Covid-19 crisis worsened, the RSI "Death Cross" clearly indicated the huge drop off in price that was about to occur.
Conversely, despite record unemployment claims in the US, when the RSI "Golden Cross" recently occurred, the price was able to break through previous resistance.

We buy pandemic fear (part 4)?We still estimates golden cross on dailly 50 vs 200 to happen in near future, and that will be our exit again. If we have done wave3 or not, i dont know, but yesterday dip to 7066 may be that wave4. Anyway in case we havent done wave 3 yet, there are some levels where wave 3 should take its turn, expecting btc to do some sideway stuff arround 7666 before continuing to its abcd target explained in buy pandemic fear part 2 arround 8750. Anyway lets stick to simple system rn, and that is we are bullish untill golden cross happens, on the actually cross we estimate short term bearishness and long term bullishnes so closing positions on next wave is crucial if high leverage.
anyway
fresh entry: 7166 and 7320
tp:?
SL:?
size: medium

Ascending Triangle or Head & Shoulders?On the RSI there's a H&S patter so visible if I need to draw it I'm not sure you're familiar with a Head & Shoulders pattern.
What Is A Head And Shoulders Pattern?
A head and shoulders pattern is a chart formation that resembles a baseline with three peaks, the outside two are close in height and the middle is highest. In technical analysis, a head and shoulders pattern describes a specific chart formation that predicts a bullish-to-bearish trend reversal. The head and shoulders pattern is believed to be one of the most reliable trend reversal patterns. It is one of several top patterns that signal, with varying degrees of accuracy, that an upward trend is nearing its end.
Key Takeaways
A head and shoulders pattern is a chart formation that resembles a baseline with three peaks, the outside two are close in height and the middle is highest.
A head and shoulders pattern describes a specific chart formation that predicts a bullish-to-bearish trend reversal.
The head and shoulders pattern is believed to be one of the most reliable trend reversal patterns.
What Does The Death Cross Tell You?
The death cross occurs when a short-term moving average (typically 50-day SMA ) crosses over a major long-term moving average (typically 200-day SMA ) to the downside and is interpreted by analysts and traders as signaling a definitive bear turn in a market.
The opposite of the death cross occurs with the appearance of the golden cross, when the short-term moving average of a stock or index moves above the long-term moving average. Many investors view this pattern as a bullish indicator. The golden cross pattern typically shows up after a prolonged downtrend has run out of momentum. As is true with the death cross, investors should confirm the trend reversal after several days or weeks of price movement in the new direction. Much of the process of investing by following patterns is self-fulfilling behavior, as trading volumes increase with the attention of more investors who are driven in part by an increase in financial news stories abut a particular stock or the movement of an index.
Limitations Of Using The Death Cross
All indicators are “lagging,” and no indicator can truly predict the future. Once & while a death cross can produce a false signal, and a trader placing a short at that time would be in some near-term trouble. Despite its apparent predictive power in forecasting prior large bear markets, death crosses also do regularly produce false signals. Therefore, a death cross should always be confirmed with other signals and indicators before putting on a trade.

When everybody is selling GOLD,we sell it with "BIG BOYS"As we know that US NFP results are not in usd favour thats why everybody buying GOLD without keeping in mind that USD stabilize its economy while fightng with corona disease.thats the reason we are here selling GOLD with full confidence.Best resistance area is 1620 and retarace untill 1597.there is a strong support at 1597 Thats why we can be able to buy gold with full confidence.

Bull Flag or Descending Triangle. What Does The Death Cross Tell You?
The death cross occurs when a short-term moving average (typically 50-day SMA ) crosses over a major long-term moving average (typically 200-day SMA ) to the downside and is interpreted by analysts and traders as signaling a definitive bear turn in a market.
The opposite of the death cross occurs with the appearance of the golden cross, when the short-term moving average of a stock or index moves above the long-term moving average. Many investors view this pattern as a bullish indicator. The golden cross pattern typically shows up after a prolonged downtrend has run out of momentum. As is true with the death cross, investors should confirm the trend reversal after several days or weeks of price movement in the new direction. Much of the process of investing by following patterns is self-fulfilling behavior, as trading volumes increase with the attention of more investors who are driven in part by an increase in financial news stories abut a particular stock or the movement of an index.
Limitations Of Using The Death Cross
All indicators are “lagging,” and no indicator can truly predict the future. Once & while a death cross can produce a false signal, and a trader placing a short at that time would be in some near-term trouble. Despite its apparent predictive power in forecasting prior large bear markets, death crosses also do regularly produce false signals. Therefore, a death cross should always be confirmed with other signals and indicators before putting on a trade.
Possibly Bull Flag or Descending Triangle as well, outlined in dark Green.
The Difference Between A Death Cross And A Golden Cross?What Does The Death Cross Tell You?
The death cross occurs when a short-term moving average (typically 50-day SMA) crosses over a major long-term moving average (typically 200-day SMA) to the downside and is interpreted by analysts and traders as signaling a definitive bear turn in a market.
The opposite of the death cross occurs with the appearance of the golden cross, when the short-term moving average of a stock or index moves above the long-term moving average. Many investors view this pattern as a bullish indicator. The golden cross pattern typically shows up after a prolonged downtrend has run out of momentum. As is true with the death cross, investors should confirm the trend reversal after several days or weeks of price movement in the new direction. Much of the process of investing by following patterns is self-fulfilling behavior, as trading volumes increase with the attention of more investors who are driven in part by an increase in financial news stories abut a particular stock or the movement of an index.
Limitations Of Using The Death Cross
All indicators are “lagging,” and no indicator can truly predict the future. Once & while a death cross can produce a false signal, and a trader placing a short at that time would be in some near-term trouble. Despite its apparent predictive power in forecasting prior large bear markets, death crosses also do regularly produce false signals. Therefore, a death cross should always be confirmed with other signals and indicators before putting on a trade.
potential super long bull pennant on xrpeth?At least on the bittrex exchange we saw a ridiculously long bull wick recently on xrpeth...Afterwards we formed an equilateral triangle and both its bottom and top trendlines were drawn better by wicks than candle bodies...thus meaning we should measure the pole of the symmetrical bull pennant by the wicks as well...If this is indeed the case and we measure the pole by the wick, then that gives this bull pennant some tremendously bullish upside that could easily lead to a sustained golden cross on the xrpeth chart which no doubt if it hit that target would allow xrp to easily reclaim the number 2 spot from ethereum. I assume the wick isnt as big on other exchanges though so if thats the case this may not be a valid emtric to rmeasure the breakout target on but either way looking at the volume that came ion as we broke above the top trendline of the symmetrical triangle..it should be enough of a bullish breakout target to lead us to a potential golden cross even if we cant measure it by the poles massive bullwickm. If the golden cross is sustained I amy have to flip my eth holdings to xrp at least temporarily.

Gold double headed bullflagA double headed bullflag formation, first one could also be interpreted as a falling wedge. Included PT and SL for those making active plays in this trade. GL all :)

Golden Cross in 2h chart ? We have a good resistance on the bull flag and a golden cross coming maybe on the 2h chart.
Its a very good sign for BTC.

Successful IH&S Breakout on Gold; Should Sustain Golden Cross.After initiating the golden cross on gold it soon after break above the inverse head and shoulder neckline and then proceeded to reach the breakout target and a few pips above before correcting which to me signals this golden cross should likely be sustained.

Amazon - Medium and long term BullRSI: Support level 32-35 - resistance level 70-75 - currently at 50: Medium buy
WMA: 50 day WMA crossed above it's 200 day WMA in Jan: Strong buy
Trend lines:
- 5 year trend line supports long term bull with higher lows: Stong buy
- Oct 18'-Feb19' highs is Aug19'-Dec19 lows i.e previous resistance level becomes new support level: Stong buy
- Ascending triangle: Medium buy
Short term could fall back to $1750 level if it losses support at $1900. However if it gains momentum and the bulls can keep it above $1900 for the next few days then the next resistance level will be $2000.
Long terms Amazon seems like a safe bet to me.
(This is a personal opinion and should not be considered an advise).
What's y'all take on Amazon both short and long term?
