my buy orders for small retracement for pitchfork and fibonacciset Limit Buy Orders at this levels they are very good entry points
Goldenpocket

ZEL - Buying OpportunityUptrend Confirmed due to recent price action which has confirmed a reversal by pumping upwards and forming a higher high.
1. Price has formed a higher high
2. It has formed a Golden Cross
3. Recent sessions' price action, ( Bearish Candles) indicate that the stock price is pulling back
4. I will be confident to buy in the $2.72 - $2.82 region (Buy Zone) as it is in the 50%-61.8% Fib Retracement Zone (Golden pocket)
5. There is a gap window between $2.73 - $2.96 region (another confluence of Support)
Please note these are my own notes, by no means trading advice. Please do your own research before entering into any trade.

WEB - Giving a Buying OpportunityBullish trend confirmation indications:
1. Made a Higher High
2. Made a Golden Cross
3. Impulsive price action with High Volume
4. After the impulsive break, price is correcting and consolidating.
5. I would be a confident buyer within the Buy Zone which is the Fib Retracement Level Zone of
50-61.8 % and the Gap Window Zone. The ideal level zone is between $4.30 - $4.70. That will be a trade with confluence.
6. Good Buying Opportunity if it closes positive or prints Bullish candlestick patterns in the Buy Zone area
with bullish price action follow through with a potential gain of 120%.
Please note these are my own notes, by no means trading advise. Please do your own research before entering into any trade.

Uptrend Confirmed - Next Buying OppurtunityRecent price action has confirmed a reversal by pumping upwards and forming a higher high.
1. Price has formed a higher high
2. It has formed a Golden Cross
3. Recent sessions' price action, ( Bearish Candles) indicate that the stock price is pulling back
4. I will be confident to buy in the $4.15 - $4.30 region (Buy Zone) as it is in the 50%-61.8% Fib Retracement Zone (Golden pocket)
5. There is a gap window between $4.30 - $4.50 region (another confluence of Support)
6. There is a trendline support in the same region which is the third confluence.
Please note these are my own notes, by no means trading advice. Please do your own research before entering into any trade.

AllianceBlock pullback from ATH; golden pocket retest in playWith this lowcap pulling back from ATH after a massive blue sky breakout, I am eyeing a retrace to the golden pocket for a re-entry.

NMRUSDT - 12H Trend Lines + Fibonacci Golden Pocket ResistanceWatching that bottom diagonal trend-line as a potential entry on support.

VET/USD High odds reversion to the mean, LONG, BULLISH There is a high probability ' reversion to the mean ' trade in play (Pitchfork median line). The ideal entry was the 0.618 retracement however there is still a 1:1 Risk: Reward trade from here. Usually I prefer a 1:3 R:R however this trade has an 80% probability of playing out. Therefore it is worthy of consideration. Looking at the bigger picture, VET appears to be in a wave 3 with the target for this wave being +157%. I see massive long term growth potential in this project. As a result of my conviction, I will be cautious of taking too much off the table at these targets. I believe VET is a long term hold.
What kind of trade is this?
High time frame swing trade
Low time frame reversion to the mean.
Long term hold.
Looking at the Macro environment, what is the trend?
LONG. Bullish .
Pending US Election results may still cause short term volatility . Long term elections have little impact on the market
DJI & NDAQ recently made new ATH's. Trending higher but monitor this closely
Gold & Silver has been on a beautiful run but now correcting. Looking for continuation at key levels
Vaccine with 90% success has been found for Covid19
More stimulus expected soon
Sector leaders Bitcoin and Ethereum been trading in a positive direction with higher highs and higher lows since the bottom in March of this year.
What are the key points to be taken from the VET Macro Technical analysis?
Broke through long term resistance in Jun & re-tested the Support through Oct- Nov
Potential to form a Massive cup & handle Pattern
Order block has been tested
Golden pocket has been tested
Long term resistance has broken and turned into Support
This recent test is a higher low
Appears to be in wave 3 of an Elliott wave count.
What are the key levels For VET?
Reversion to the mean
This trade has an 80% potential for a 25-35 % profit. The longer it takes to play out the higher the potential profit.
If this trade takes 3 weeks to play out the target will be in in confluence with the cup and handle formation target at 0.02325
Entry: anywhere here (~.017)
Target (median line of pitchfork) currently at 0.021619.
Stop: 0.01185
R:R 1:1
Elliott wave 3rd wave & Cup & handle
The target for the 3rd wave is in confluence with the target for the cup and handle and has a potential for 157% profit.
Entry: anywhere here (~.017)
Target: 0.0439
Stop: 0.01185
R:R 1:5
The following are assuming the 3rd wave ends in the high probability zone
4th wave entry: 0.0305
5th wave target: 0.0522
Are there any news catalysts?
Yes. Bullish.
Too many to list. VET is an absolute beast and is severely undervalued IMO.
National level partnerships with the Chinese Gov.
Over 100 partnerships with fortune 500 companies
I am unaware of any other project in this sector with as many high level partnerships as VET. (If you know of one please let me know in the comments below)
Considering the points mentioned above has allowed me to set a LONG ONLY bias. This means until circumstances and the trend change, I will ONLY be looking for entries to trade VET LONG.
(The trend is your friend)
What is my trading plan moving forward?
Look for LONG entries on the lower time frames for short & medium term swing trades
Wait for larger pullbacks and retests on high timeframes to build larger LONG positions with the intentions of holding for much higher targets.
Continue with this strategy until a 'reason2sell' is present, for this trade that will be; Break of the 0.618 of the most recent swing or my targets are met.
Note; I hold core positions in VET with no stops. I see those positions as long term investments and this forms part of my long term strategy. I would need to see significant change in the Fundamentals to alter this strategy.
Cup & handle, Golden zone, S/R flip, Order block, MACD crossing bullish:
Never Trust. Verify.
D.Y.O.R . Not Financial Advice, this is my trading journal.
Always remember: Technical Analysis is not about being right, it's about increasing your odds.
Be prepared to be wrong. Risk management is key . Capital preservation above all else.


First 19000, then 30% correction. Buy zone at 14000.This is a mid-term analysis.
First, excuse me for oversaturated chart. There are too many lines but I just wanted to share my plan to trade Bitcoin because I think everything just lines up so nicely. I didn't have time to make new chart so I hope you can read this one as is.
Bitcoin could go straight to 19300 (white arrow) or fall to Fibonacci Golden pocket at 16640 and bounce there (yellow arrow). Near future will tell that.
Either way, after topping out between 19300 and 19600 , 30% correction will follow. All the way to another Golden pocket (white dashed line). I have buy orders between 14000 and 13300. If the 20-Weekly Moving Average holds, Bitcoin will shoot above ATH. The 20-Weekly MA and its projection are blue lines.
I'm just starting to post my ideas so I would appreciate a like. You can also follow this idea to get future updates.

47% profit expected on NEXO. Fundamental and technical reasons!FUNDAMENTALS
First of all if you don't know Nexo, do a quick research about them. It's a "crypto bank", offering loans for your crypto as collateral. So you don't need to sell Bitcoin if you need money for a car or bathroom renovation for example. Just deposit Bitcoin to Nexo and take a loan in fiat. When you repay your loan, you get ALL your Bitcoins back. Especially now that we are in bull run, you don't want to sell Bitcoin and miss on gains.
Another service that Nexo offers is "Earn" on your crypto and fiat. Last week they also announced improved version of this Earn feature, they call it NEXONOMICS: nexo.io
Holding NEXO tokens gives you big discount on loan interest rate and it also increases your APY (annual percentage yield) if you decide to use Earn feature. Nexo has better rates than competition and what is very nice, your funds are not locked. It's a flexible stake so you can withdraw them any time!
Price already increased a little bit after Nexonomics announcement last week, but check this (from the article I linked above): "The full scope of Nexonomics, including a variety of upcoming upgrades and functionalities, will be revealed progressively through December 2020 ."
TECHNICAL ANALYSIS
Now let's move to some technical reasons why I expect a 47% increase at minimum! As you can see Nexo is about to break out of this pink/magenta descending trendline. If you want to trade this more conservatively, wait for stronger confirmation of breakout. However I already bought NEXO because I wanted better entry price.
Furthermore, 20 and 50-Day EMA are about to form a bullish cross and this doesn't happen very often. However when it does, a big upward trend follows. Check the history yourself.
About my target. My target is Golden Pocket (0.618 Fibonacci level) which is at 0.0000194. It could go higher as well.

Low Volume + Weak Price movement = ROCKET!ETH is preparing for the move! At the current state of the asset, the price does not show any strength or weaknesses of either Bulls or Bears. The decreasing volume is suggesting that the asset is going through the accumulation phase. At the same time, the price is bouncing around the POC of the current month.
Trading Plan COINBASE:ETHUSD :
There are two potential scenarios that we would monitor.
First of all, in the short run, the price should reach the bottom of the trading channel at around $356. This will act as a line of support, however, it is possible that we may experience the strength of the bears and If the price would manage to break below that level with good volume, then the upward move scenario is cancelled and the price will start to decrease in the attempt to form the double bottom, around the Macro Upward Trend line.
If, however, the price will be able to hold the level of $356, then there is a good chance for the asset to gain in value and aim towards the level of 400$. Along with the upward movement, we should experience the first resistance level at around $366. If the price will go beyond the 400$ (with good volume), then it would aim for the golden pocket between $420-$426.

A very real possibility.We seemed to be quietly forming a potential inverse cup and handle on the 1 day chart here. If this pattern were to validate it has a breakdown target around 7.3k very very close to the macro fibonacci golden pocket. I've also said that in bull markets bitcoin historically has shown it tends to retrace no more than 32-41% during bull market corrections and a fall to this zone would bring us exactly to a 41% correction from our recent high. A plethora of confluence only improves the probabilities of this potential Inverse C&H's validation. Of course the way it comes into the left side of the cup is slightly suspect though so I'm not 100% sold on this pattern yet but will be keeping a close eye on it.

#ETH Golden Pocket ZoneHi Traders,
ETH is making an H&S pattern for now. If we take the EW, then the retracement gives us a possible zone of 230$ a 260$. Golden Pocket zone is @240$.
Trade safe!

Current 1 day chart chess board. Currently in a 1day chart bear pennant that has a breakdown target of 8.4k or so but could see a reversal at the golden pocket in the 9.2-9.5k range instead of reaching the entire breakdown target. We've also already tested the weekly chart 21 ema(not shown here) as confirmed support so there's a chance of a reversal here but seeing as how we have yet to fill the 9.7k CME futures gap(not shown here) I have a feeling we at least will send a bottom wick down to do that. It is unlikely it will stop there however as too many traders will be anticipating a reversal right after the gap fill so I'm guessing it will overshoot the gapfill target and head lower than 9.7k At this current point and time anything is possible but based on the current shape of the descending bear pennant it looks like we should see some form of a breakdown or breakout around september 14th if not earlier. Setting phasers to neutral for now.

Golden Pocket for BTC Tested, @ Center of Large Reg Trend LineBTC retraced to the Golden Pocket... the 61.8-65% Golden Pocket and the Long Term Regression Trend Line Middle bar is currently acting as Support, all lines up together

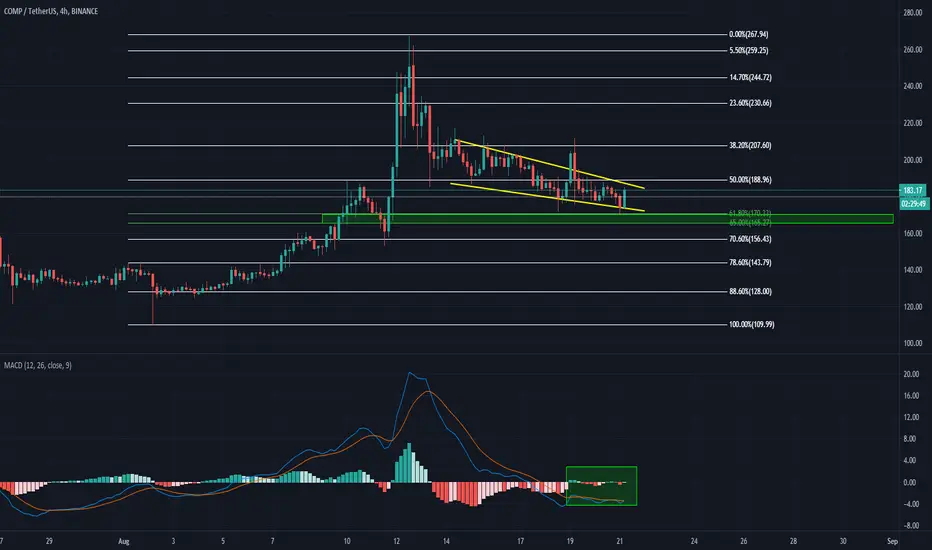
COMPUSDT about to reverse maybe ?COMPUSDT is finishing its correction move as it comes close to the golden pocket.
MACD is squeezing signing of a possible volatility expansion is coming.

USDCAD LONGAre we seeing the start of some USD strength?
Nice bullish candle to break the descending trendline and 50MA
Would like a pullback to retest the trendline and reject the golden pocket area of the FIB creating a new higher low.

TSLA Golden ScaffoldingLearning about how the .681, 1.618, 2.618, 3.618 and 4.618 interact to create supper charge support/res. Any theories out there on the mystery of the 1.65? is it related to the .5? Does it take into account the rounding errors in the golden ratio?

Golden Pocket Short Setup on PullbackLooking to enter shorts on a pullback to retest the broken ascending trendline and the currently descending trendline in confluence to our 0.618-0.65 fib retracement area, ultimately creating a golden pocket to open our positions from. Furthermore, there is a strong historical S&R zone which can act as a rejection spot for the price.

IMM 50% BREAK!!Immutep Ltd is a biotechnology company working primarily in the field of cancer immunotherapy using the LAG3 immune control mechanism. The company was originally built on CVac, a therapeutic cancer vaccine.
Break out of ascending Triangle confirms, Targeting Supply @ 0.30
- Ascending Triangle Confirms
- 4th touch on Fib .236 breaks
- Measured move lines up with Supply
- RR 3.33:1
- Supply sitting in the Golden Pocket
- MACD still spread BUT starting to turn
- Ichimoku BULLISH and clear to run
Aware of the GAP at 0.15 - 0.165 but with more positive news it will stay unfilled for the foreseeable future. Also Bearish Divergence on the 4HR but again I do not think it is strong enough currently.
These Ideas are NOT 'Financial Advice'!. Scenarios are based off a mixture of TA and Fundamentals current at the time. All IMO GLTAH. Happy Hunting!!!

GVT - Huge Head & shoulder formingThis will be a good one to hold for a while, looking to enter at Fibonacci retracement which lines up perfectly with possible Right shoulder forming
I am using Loose stops as I was hunted on my tight stops yesterday
This is based on weekly timeframe so let the price action develop on mentioned levels
I have also started sending Proper signal in telegram channel as some of you are not able to interpret from charts

AFTERPAY - NEW ATH or 50% RETRACE?AFTERPAY (ASX:APT) New ATH or in need of a retrace (A sign of darker times ahead though IMO)
3 Scenarios to play out in the next week.
1: Now that we have popped back into long term uptrend and with the amount of people using the service due to Covid-19 (with no end in site) $50 mark looking very achievable.
-Current Support holding
-Bouncing off long term Uptrend Trendline
-Covid-19 still taking its toll on the world
-Fib Extension 1.272 within Rising Wedge
-New ATH territory
-Volume still present in the market
2: After a 440% run wheres the retrace?? Is now the time? (Short Term Retrace)
-440% run without a retrace
-Covid-19 Restrictions 'Softening'
-MACD Death Cross inbound
-RSI Overbought Territory
-Fib Retrace .236 within reach
-Parabolic Uptrend will crack
-Healthy market run needs good market structure
3: A larger retrace is required
- Punch through the Fib .236 and head for the .382 & Strong Equilibrium
-Fill GAP between .236 - .382
-MACD Cross and Spread
-Crack RSI uptrend
-New Market Structure will form LL, LH
-Parabolic trend will break
A Revolutionary Company that was founded 5 Years ago. with over 40,000 Merchants Worldwide and 7 million users and GROWING, Afterpay has smashed the market post Covid-19 dump with a full retrace as their platform has capitalised on the state of the Global Economy during this time (Someone had to) with over $250 Million in Revenue (JUNE 2019) in excited to see what the End of Financial Year brings for APT.
These Ideas are NOT 'Financial Advice'!. Scenarios are based off a mixture of TA and Fundamentals current at the time. All IMO GLTAH. Happy Hunting!!!
