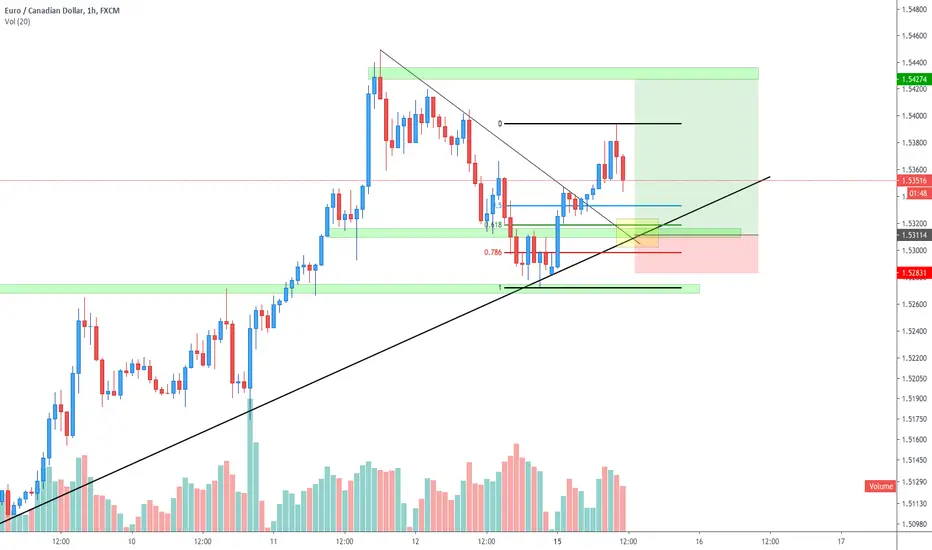
The Golden Pocket | Long SetupEURCAD approaching back down to retest the respectable ascending trendline and the recently broken descending trendline. We will be looking to open long positions on a pullback near the 0.618 fib level, which ultimately corresponds well with a previous level of strong support - creating this zone of confluence.
Goldenpocket
#Bitcoin - Longing againI see good confluence here on the chart with Fibonacci & ascending triangle support trendline, daily also possible bullish diversion printing, we might not get to 11k but even 1000$ move to 9700 is good for leverage trades.
Laddering longs till 0.75 (using only 5% of balance)

Pullback Expected | Long SetupAfter successfully breaking out of our descending trendline, we will now be looking to potentially retest it. Currently, the market is trending within a respectable parallel channel. A zone of confluence is created when the previous broken trendline and the current ascending trendline, meet each other. Furthermore, we have a clear 0.618 Fib retracement - lying right in between the two trendlines creating this "golden pocket", where we could consider opening a long position.

#EURPLN - Possible double topGonna risk a short, there is huge FVG below & possible double top forming, expecting at least a move down to golden pocket 0.618-0.65
i have set only 25% of bids set for now, res i will update once we get there, i don't follow FA but i know it plays a role so if you are not risk taker be patient

EURUSD LONGWere looking at a change in direction for this pair.
We have seen a break of the descending trendline after a lot of bearish movement. Forming a new higher high, likely to be a small pullback/retest before making further upside movement. A good entry would be in the golden pocket area/rejection of the 50MA.

BTCUSD - SHOT from 8.1K rangeIF BTC rich 8.1K zone it will be strong action. It will be the end of 4 wave There is a golden pocket. If BTC will be rejected it will a big drop.

Chainlink/USD Short Bearish Golden corner pocket...Missed the entry but there might be one more push up before it heads down...
Short:
Entry at the .618
Stops at the .707
First Target: high volume node
Second target: Pitchfork median line


Will the golden Fib Maintain support?The 2 main gaps below (8.5k and 7.7k) have now been filled and in doing so on the weekend, we've now created a rather large gap above current price action that will eventually be getting filled as well. The question is whether or not there will be any further downside before that. We can see we are still well under a very a very precarious head and shouylders pattern here but one good sign is the golden fib retracement level(aka the 61.80) is currently been holding support on the daily closes. This is one of Bitcoins absolute favorite fib levels to reverse trend at so it is definitely probably that we could bounce back up from here...if not and we also fail to maintain the 7777 horizontal as support the next likely support is the horizontal around 7428 or so...if we were to go down that far before reversing back upward we would start painting the 2nd shoulder of a very symmetrical textbook looking inverse head and shoulder pattern on the weekly chart that would have a breakout target of 14k. However, if we were to reverse the trend here at the golden fib and go up from here it would also still be a valid inverse head and shoulders the second shoulder just wouldn't be quite as symmetrical. Ultimately as long as we don't dip below 6.3k before finally seeing a trend reversal back upward we will secure our follow up daily higher low after having our first daily chart higher high in awhile which would still be a bullish sign and keep the macro price action in the bulls control. Even if we dipped all the way to our previous low we would still have a double bottom in play that would have the same breakout target as the inverse head and shoulders would...as long as we don't go below 6.3k the bulls still have control but I think we will either see the golden fib maintain support or the 7428 horizontal with the absolute worse case scenario being we dip back to 6.3 and bounce to validate a double bottom. As always this is not financial advice but I personally will be laddering in small buys each rung down, dollar cost averaging/ buying the dip.

Resistance at trendline, retrace to Golden PocketThis is six times now that we've interacted with this trend line. Our latest $1K+ run-up since last week has been parabolic; volume is diminishing; RSI is in overbought territory--I think there is a good probability of a retrace down to one of the Golden Pockets identified on the chart.
The Lesser Golden Pocket is measured from the run-up starting around $8265, and I've marked that Golden Pocket at $8679.
A larger retrace to the Greater Golden Pocket measured from around $6850 would be to $7786; but, it seems that all of the work the Bulls have put in to get out of the descending channel and, now, above the daily 200MA wouldn't be given up that easily.
I am out of the market, waiting patiently for the retrace. However, I would gladly flip bull, if we get confirmation of a higher high on the weekly above the range of $9550-9750.
Stay safe. Wash your hands. Wear a mask in public.

Golden Corner Pocket & ABCD Pattern XTZ/BTCXTZ/BTC has made an ideal retrace to the golden zone and is now mirroring the ABCD bullish pattern that began early November 2019 which led to a 165% gain in a 41 day period. Bullish. Strong Buy.

DASH Golden Pocket| EMA Cross| Higher LowHello Traders!
Today’s chart update will be on DASH which has respected the golden pocket Fibonacci retracement level and is putting in a potential higher low.
Points to consider,
- Bullish Trend
- Fibonacci levels respected (Golden Pocket)
- Stochastics in upper regions
- RSI respecting trend (Bullish Divergence)
- EMA’s cross bullish
- Volume increase required
DASH is putting in a potential new higher low as it tests its up trending line, which has held true at current given time.
Fibonacci levels such as the; .618 & .650 (golden pocket), held true, DASH has bounced of this zone, signalling strong buy pressure.
Stochastics currently in upper regions, can stay trading here for an extended period of time, however lots of stored momentum to the downside. RSI respecting its trend line, diverging from price (bullish divergence), as it makes higher lows whilst the price makes lower lows.
EMA’s crossed bullish, must hold price as support when testing key levels to maintain a bullish bias. Volume needs to increase for follow through, otherwise a fake out will be imminent from current levels.
Overall, in my opinion, DASH will continue this upside potential as long as bull volume comes to fruition whilst the EMA’s acts as support.
What are your thoughts?
Please leave a like and comment,
And remember,
“Fear, inherently, is not meant to limit you. Fear is the brain’s way of saying that there is something important for you to overcome.”
― Yvan Byeajee

Bitcoin - Big players are using these levels, so why not you? Before reading, please show me some love by liking and commenting! It's free, so why not?
In this post I want to show you the power of the Golden Pocket (0.618 -0.65 Fibonacci retracement). After one year in a downtrend, we finally saw that price increased and reached a high of $13920 on Bitmex.
But why did the price stop exactly at this level?
For those who think that TA is not working, here is the answer:
Fibonacci is a fantastic tool that works in all markets of the world, and when you understand how to use it, it make the difference between an amateur and a pro trader.
In this example, since we are looking for a short opportunity, we just took the high that we reached the 11 December 2017 and the low of 10 December 2018. And what do you notice? Yes, price stopped exactly at this Golden Pocket.
Is this a coincidence? Not at all.
Why this level is very important and why do you see price rejection most of the time at this level?
Because big players are using it, financial institutions with large capitals that have very complex trading algorithm use it every single day, whether it is for scalping, day trading or swing trading.
Now when using the Golden Pocket we don't want to blindly long or short at this level. What we are looking for is confluence with at least something else.
In this case, what made this trade a high probability one is the fact that the Golden pocket was sitting exactly at the previous weekly level of $13873 (previous support that became resistance) which is enough of a confluence to take the trade.
Big players are using those levels, so why not you?
If you love this content please support me by sharing, commenting and following me! Thank you and ...
Have an amazing day!

BTC is a showing us something - You need to check this chartBefore reading please show me some love by liking my post and following me - it's FREE and easy, so why not :)
Bitcoin is showing some interesting things. Each time we had a impulsive move upward, take a look at where price stopped (before continuation down). Yes exactly at the Golden Pocket (between the 0.618 and 0.65) Fibonacci.
Is that a coincidence? I don't think so as this zone is very often acting as support or resistance depending on the trend direction and TF.
Bitcoin price is exactly at the golden now!
Will this time be different than the past 2 rejections? I don't think so as we are still in a downtrend (big picture) without higher highs + where can see some bearish divergence in the 4H and a descending volume.
2 options now:
1) Aggressive: Start to build a position with a SL 2% above the previous wick and add more when the price shows more bearish signs.
2) Conservative: Wait for a nice red daily candle to start building your position.
Please encourage me by commenting below if you agree or disagree with my analysis and I will continue posting every day!
Thank you,

How High Will BTC's Rally Go?How high will Bitcoin's rally go?
Well no one knows. But here are two levels to watch....
We have significance confluence of fib levels based off the major highs and lows from the last two years. The Golden Pocket level has been very significant in both directions. We also have confluence of a third Golden Pocket with the downwards sloping resistance.
I agree with Crypto Sniper Francis Hunt that these rallies are like mini after shocks from the 2017 euphoria. What we are seeing is probably a new smaller rally within a long term continuation pattern, rather than the beginning of a new macro bull move. The new local high probably will not reach 2019 highs.
If the Golden Pocket is respected a third time we could be looking in the region of $11.4k, but we will see a lot of resistance on the way plus another key level at the 0.5 line around $10.2k.
Or it could reverse later today and make a new bottom. Be prepared either way :)

Whale Reaccumulation Zone?Pattern suggests possible reaccumulation by a handful of whales on Bitfinex, where Longs skyrocket to all time highs on taps to the .618 and .65 retraces of the macro bull run which began back in April. Meanwhile funding rate on Bitmex remains fairly neutral, suggesting the Longs are from Bitfinex only.
A long squeeze, if it happens, may not kick in fully unless we break the local low of $6618 (on Bitfinex).
I remain short, but finding reasons to be careful.

BTC full retrace to the golden pocket.If BTC can bounce back and hold the 0.618 fib @7164 or not loose the 0.705 fib @6258, we can resume the uptrend.

BTC 2019-11-22 - Golden Pocket and Lower Channel ValidationHey guys, I hope this post finds you all well and trading safely. I just wanted to post this update about BTC's unexpected movements recently.
From reading the other TV posts, there's been a lot of talk about the support levels and bounce zones.
I haven't seen another post on the Golden Pocket 0.65 fib yet, so here we are. We just reached this level this morning on 11-22-2019. This move was TOTALLY unexpected this soon, and I caution you all to trade well and use extreme risk management.
However, I have been holding shorts since $9.4k and uncertain of what to do since we had not seen any majorly bullish action on the RSI while STOCH stayed extremely low on longer time frames.
This is where I am now looking to close my short positions.
Future: There is NOT much historical support near and around these levels and it kind of feels like the markets are suspended in midair at the moment. However, with a move down this large, watch for a nice bounce back. This should show itself in the RSI trend line as a lower high with a lower low/same price as far as price action. Be cautious when entering longs as this point without confirmation.
Happy trading!
I am a simple market analyst - not a financial analyst
fortis Fortuna adiuvat - fortune favors the brave


BTCUSD Golden Fibonacci Level | Relief Rally Imminent?Hello Traders,
Today’s chart update will be on BTC, where is has retraced to a key Fibonacci level, known as the golden pocket. Bitcoin may put in a relief rally due to the sharp decline in price action, which has overextended a number of indicators.
Points to consider,
- Trend in a bearish structure
- Local support at key Fibonacci level
- Local resistance in the middle of the channel
- Stochastics at lower regions
- RSI oversold
- EMA’s giving price resistance
- Volume low after impulse break
The overall trend in Bitcoin has been bearish; price action has put in consecutive lower highs and lower lows. Bitcoin has recently found local support at a key Fibonacci level known as the golden pocket (between .618 and .65). This level is in confluence with trend line coming through, signalling that buyers are strong. Local resistance is found at the middle of the channel, a possible area for Bitcoin to test.
The stochastics are currently in lower regions, can stay down here for an extended period of time, however, lots of stored momentum to the upside. The RSI is currently overextended; an oversold bounce is probable from such conditions.
The EMA’s is bearish until we see a cross, it is yet to meet price at current given time. Volume is declining after impulses; an influx in volume bearish and or bullish is imminent from current levels.
Overall, in my opinion, a relief rally would be imminent due to strong technical confluences from current support level. A rally will allow indicators to cool off; .i.e the RSI, and allow price a retest of the middle channel…
What are your thoughts on Bitcoin?
Please leave a like and comment,
And remember,
“The obvious rarely happens, the unexpected constantly occurs.” – Jesse Livermore

61/80% golden pocket fib retracement with the precision bounce.As anticipated we got some bounce love from the golden fib retracement level at 61.80%. However it has not bounced us high enough to reclaim the 1 day 50ma(in orange) as support just yet...Reclaiming that support is pivotal..If we can't flip it back to solidified support within the next 3-5 days then the bull market will likely be over...hopefully we will see a huge bounce here. We still have a gap on the CME futures chart at around 11.8k or soo so I'm still holding out a slight bit of hope that we can see a big bounce here.

GOLD 1W & 1D perspective. Hello traders,
This is my first public speculation on gold so take this with grain of salt like any opinion but this its what I see . I normally trade cryptocurrencies and post about crypto but some assets I can trade with BTC and AU its one of them. I did made some profitable trades going long in long trades and going short on gaps. I'm not a big fan on going short unless we are in bear market and its obvious direction in long perspective . I have strong feeling that gold has bright future with current market situation . If you are new to my post I'm invested in BTC witch I got in early when everyone was scared to enter and posting Doom scenarios. I on the other hand have bean accumulating and planing on staying that way for some time and have goals in mind but that is different story and not the topic . So as we can see gold its barely holding to 1M pivot and hitting weakly support levels. It can go up a little from here but in longer perspective I believe drop its coming , We are leaving high node area and not much action under until the demand area . I'm looking on golden ratio level to bounce from and I think this will most likely happen under current price moves. Gold had nice run witch its not over but its time to pull back IMO and check the demand area to confirm more uptrend , If we just keep going up from here that makes thinks even better. Traditional markets are Hot and extremely hard to get grip on even for the best speculators out there . Can DJI hit new High who knows. 08 recovery happen way to fast and IMO and was not covered by anything beside FED constant print and throwing USD to the market to make it look good, will see how long they planing on doing that . With that in mind we all know how historically people flea to AU when market hits the fan . Long story short Im looking on going long from golden pocket and I will be watching that area to enter longer trade . Making more Digital gold with traditional assets its my long time goal as investor.
People always say buy gold and I say buy gold mines .. ( Yes I buy mineral rights and keep doing it. I love prospecting there for I have no interest buying gold at all when I can go and dig it out )
As always only think you control its how much you loose so Risk Management its everything in this game .
Please share your opinion and let me know what you think .

Descending Triangle BreakdownIt may happen tomorrow or it may string us along until the end of the year but it would seem this descending triangle has the potential to drop back down to support from LAST YEAR'S descending triangle. If this takes as long as before and we end up consolidating well into it's apex that would give time for the 200 week MA to move up and create strong support again as well (just like last year). This also makes sense with the Fib retrace because dropping to last years support would put us in the "golden pocket" between the 61.8% and 65% lines. I drew the fib using monthly candles which is why it falls a little short from the top of the triangle, but considering how volatile price action was around that top, I feel it's a good spot. I am short until we reach the buy zone between 8500 and 5000 (I doubt it will fall past 6400 & 6000 though). Then I will gradually transition long for the inevitable run back up as we approach the halving next year.
