SYK watch 365-366: Proven Resistance to tariff recovery wave SYK struggling with previous highs now resistance.
The key zone for bulls to break is $365.54-366.31
If it dips, not much support until $343.86-347.98
Goldenratio

AEHR watch $8.79-8.89: Key Resistance to tariff recovery waveAEHR trying to recover from the bottom.
Hitting key Resistance repeatedly at $8.79-8.89
If sdip then watch the Golden Covid fib at $7.90

JNJ watch $156.72-158.17: Double Golden zone to determine TrendJNJ consolidating around a major zone defined by dual Goldens.
Key is Golden Genesis at $156.72, and Golden Covid at $158.17
This is an important zone that everyone is now keenly aware of.

FAST eyes on $80: Double fib support that may launch next Leg upFAST recovering nicely and last earnings helped.
Watching the key support zone at $79.90-79.99
Good spot for longs with a tight SL just below.

XLU eyes on $79: Key Resistance about to Break watch RetestXLU trying to recapture the "safe haven" of utilities.
Just pierced a well proven resistance at $78.64-79.00
Looking for a clean retest for the ideal long entries.

LULU watch $268: Double Golden fibs to end bounce or Bottom IN? LULU bounced a bit into a tight confluence of Golden's.
Golden Genesis at $267.70 and Golden Covid at $268.74.
These mark a major landmark in the lifetime of any asset.
Rejection here would point to lower lows.
Break and Retest would be long entry signal.
Likely is an "orbit" of these before any move.
===================================================
.

SOFI watch $10.73/82 Key support for possible recovery to $12.25SOFI trying to recover from the tariff tantrum.
$10.73-10.83 is the key support zone to hold.
$12.25-12.26 will be serious resistance above.

ETSY eyes on $44.07: Golden fib could End Bounce or mark BOTTOM ETSY struggling against a Golden Covid fib at $44.07
Below is an even stronger Golden Genesis fib at $42.41
Those fibs define the current range that we look to break.

XLF watch $48.45/68: Key Resistance holding up the Recovery WaveXLF trying to recover along with the general market.
Currently resting a proven resistance at $48.45-48.68
Bears look to be winning, so look at supports below.

AFRM eyes on $42.66: Golden Genesis fib, key barrier to recoveryAFRM is testing a Golden Genesis fib at $42.66.
Look for a Rejection or Break-and-Retest to buy.
There is open space for a pop to $47.60 or $49.17
.
Previous Analysis that caught a nice BREAK OUT
=============================================
.

GOOGL eyes on $159.41-160.25: Key support that bulls MUST HoldGOOGL had a nice bounce into Resistance and retracing.
Watching well proven support zone now, at $159.41-160.25
Bulls need to Hold this zone and start going back Northward.

SCCO watch $87.05 above 83.65 below: Key fibs to determine trendSCCO may have bottomed but not yet flying.
Currently fighting Genesis fib above at $87.05
Likely dips need to hold Golden Covid at $83.65
Of course we have the Copper > Econ > China thing,
No way to know effects but the fibs say "look here".
=============================================

WIX eyes on $167.76: upper bound of resistance zone to breakWIX recovery looks weaker than peers in the tech world.
Currently testing top bound of a key zone $164.46-167.76
Look for Break-n-Retest or loss of lower bound for shorts.

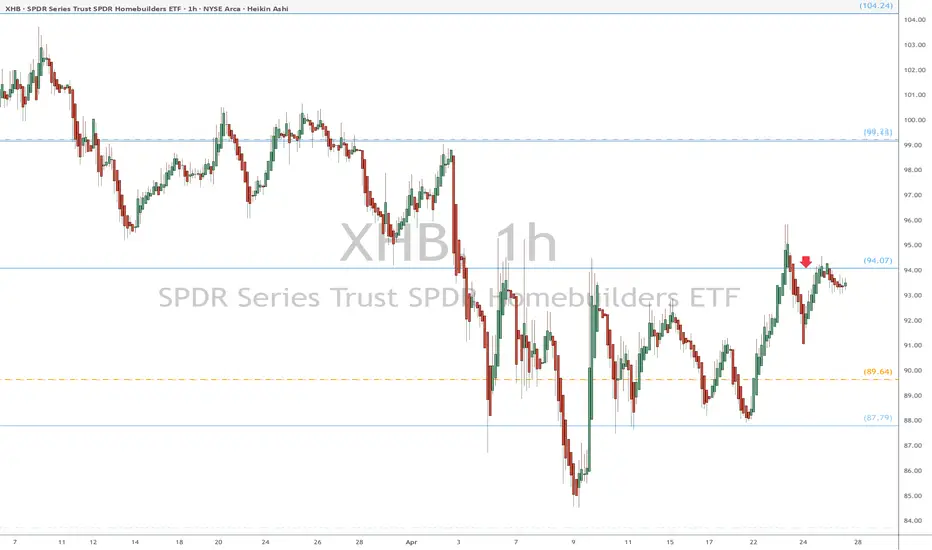
XHB eyes on $94.07: Semi-Major Genesis fib trying to End Bounce XHB trying to recover after good Housing reports.
Currently testing a Semi-Major Genesis fib at $94.07
Look for a dip or a Break-and-Retest to take entries.
BTC heads up at 95.2k: Covid Stimulus Fib should cause a DipBTC has been running nicely with risk-on sentiment.
Nearing a significant Covid fib at 95,176.28 (Coinbase).
Covid Stimulus nodes resonate most with monetary policy.
It is PROBABLE that we Orbit it a few times.
It is POSSIBLE that we get Rejected completely.
It is PLAUSIBLE to blow through it then come back.
If EXACT Rejection, look to sister fib below at $89,592.30
If ORBIT Capture, look to get flung in either direction.
If BREAK Easily, pay more attention to the Genesis fibs .
.
The other major fib series for BTC, the "Genesis Sequence":
These two sequences, the Genesis and Covid fibs, helped call "the TOP":
They also called the dip/bounce at 75k:
==============================================================

PLTR eyes on $109.xx: Possible End of bounce wave to Dip next?PLTR coming back strong after the tariff tantrum.
Now approaching a key resistance at $108.52-109.02.
Elliott Waves also point to a completed 5-wave structure.
Looking for a dip here, to either $103 or $96, will post updates.

DOCU eyes on $81.72: Break should pop >9% to Golden GenesisDOCU recovering well, as a tariff-proof business.
Currently testing a proven Genesis fib at $81.72
Likely to dip a bit, or look for Break-and-Retest.

PFE eyes on $22.4x: Key hurdle to mark bottom IF there IS one ?PFE can't seem to dig a hole deep enough.
Trapped under a key resistance $22.43/49
Break and Retest could indicate bottomed.

AAPL eyes on $208.xx: Key Resistance to Tariff Recovery wave AAPL trying to recover through the various tariff news.
Currently testing a key resistance zone at $208.26-208.68
Look for dips, with a must-hold support at $196.65-197.33
.
Previous analysis that called the TOP:
=====================================================

ADSK eyes on $270: Proven Resistance zone may Reject or BreakADSK trying to recover along with the general market.
Currently testing a proven resistance at $269.63-270.12
Look for a Break-n-Retest or dip to support fibs below.

TSLA watch $253.47 (again) Golden Genesis fib to determine trendTSLA back to the Golden Genesis fib that we keep harping about.
This is a BIG deal, as the most important level of this epoc for it.
Many PINGs (exact hits) have made all traders keenly aware of it.
What happens here will say a LOT to a LOT of traders and algos.
=========================================================
Full view of the "Genesis Sequence"
=========================================================

HOOD Tariff Relief dips to buy: $41.28 strong, 39.42 better longHOOD got sold in panic then bought in fomo.
We of the Fib Faith indulge in logical serenity.
We plan and execute calmly and deliberately.
$ 41.28 Bounce would be strong to target $49.16
$ 39.48 better entry with tp1=$45.44, tp2=$49.16
$ 37.12 is a must hold or else it was a bull trap.
==============================================

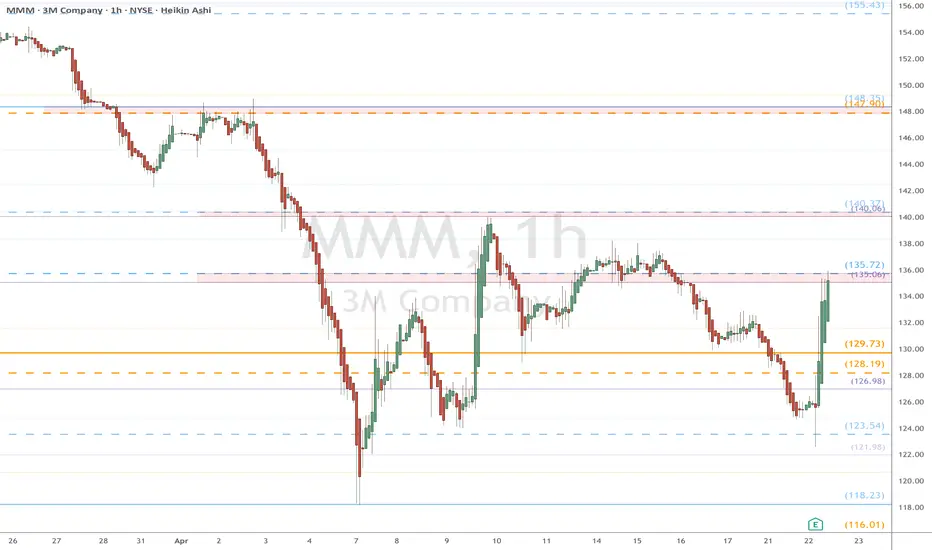
MMM eyes on $135.06/73: Key Resistance to Earnings bumpMMM had a positive reaction to latest earnings report.
Currently testing a key resistance zone at $135.06-135.72
Look for Break or dip to Goldens at $129.73 and 128.19