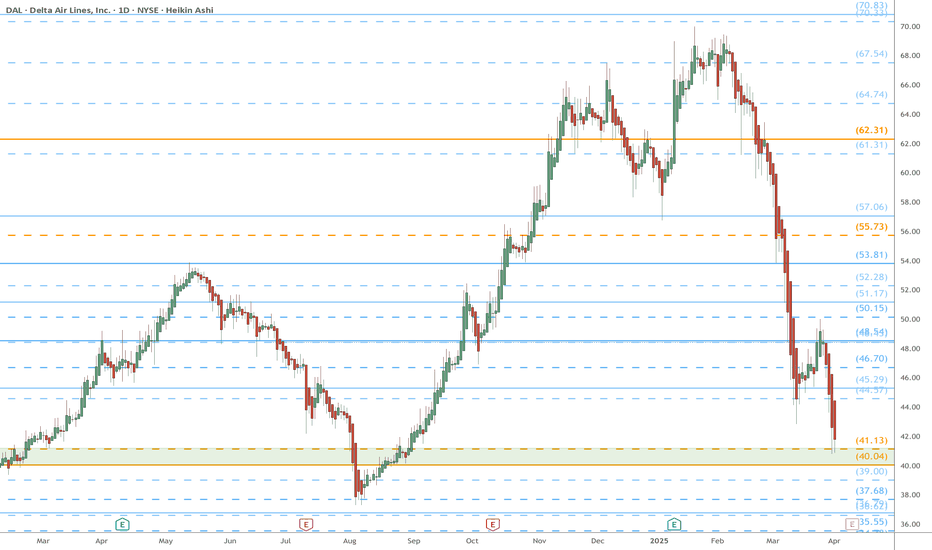
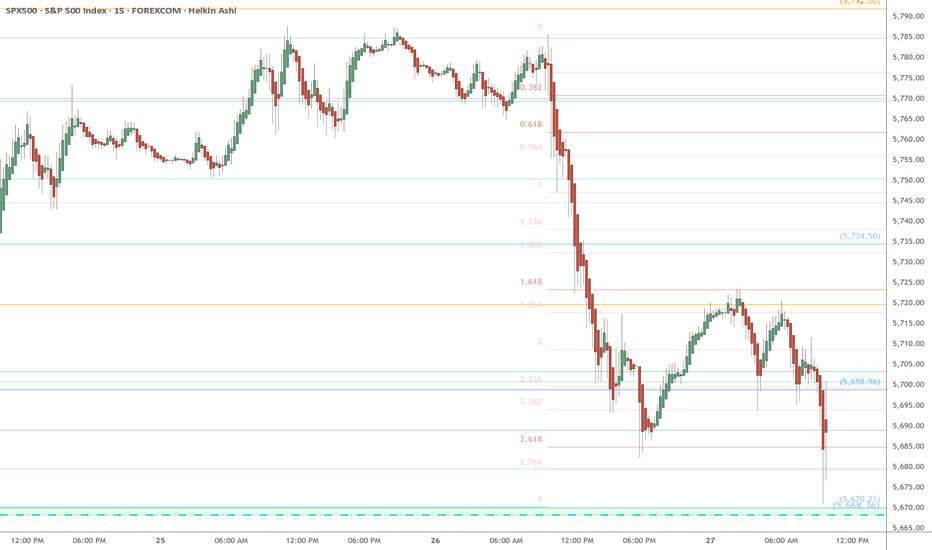
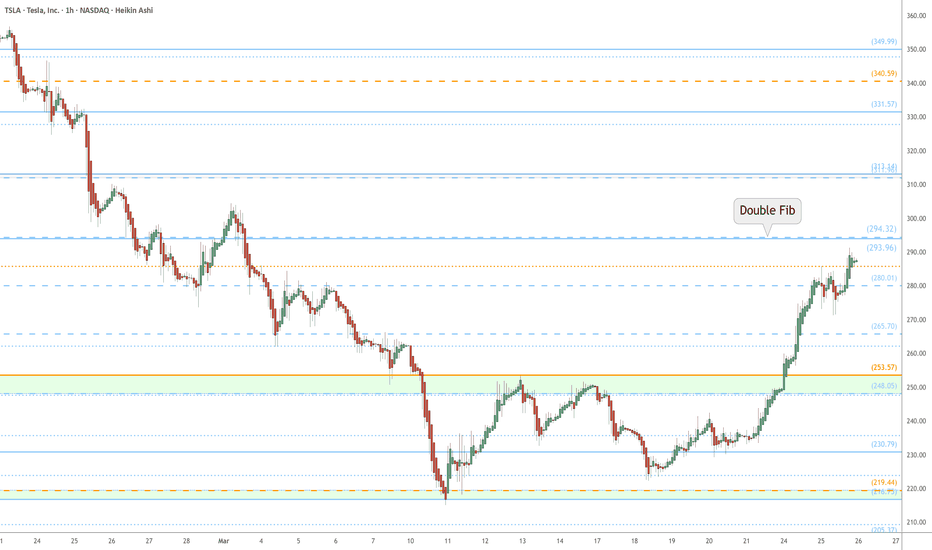
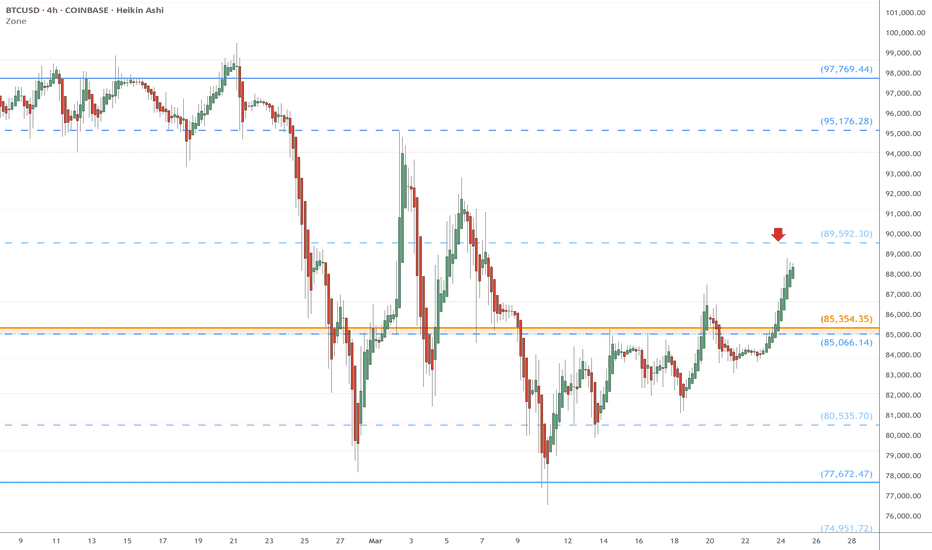
SPX liquidity was needed - bullish trend intactHello traders and analysts,
A quick note:
This is tagged as long, for the wider outlook.
Zone colour Master Key:
Blue = Monthly
Purple = weekly
Orange = Daily
Grey = 4hour
Pink = 1 hour
Here is an update to the previous idea - keep in mind the imbalances in the wider time frames.
What does this chart show?
Well, the trendline has been tested, but a higher low has been created suggesting that a correctional move was imminent.
Why in this "sell off" remaining cool, calm and collected is important here.
The emotional move in profit taking is crucial, but this move was needed.
see the Fibonacci aligning here;
This was another opportunity to add a long position - all be it small as price is at a costly price to buy in. But the power of compounding and average price will allow for these moves to take on a short term horizonal risk.
The Fibonacci retracement aligns and a buy order can be placed.
Note* this 61.8% maybe broken in the short term for a trendline retest of a false breakout to pin a bearish move.
See the correctional move from the channel below. Notice how price is back within the lower green target. The trendline has been tested of 6 losing days consecutively.
The 2021 analysis:
Price has followed the path prediction thus far to a almost perfection at this moment in time. The reason for this is using the daily, weekly and monthly. The probability of the imbalances remain clear
Multi time frame analysis:
SPX is in need of a correctional Rolling returns - historical data .
Using the base model of 3 year rolling returns,
the simplified explanation of the model shows a 41/50 years have returned a positive growth. As opposed to 6 years of negative returns. With 2020 closing out 16.26% return .
*Note - the 6 years where the rolling return is negative - the dot com bubble only stood to lose 6.2%* Est.
SPX is in need of a correctional move
using the monthly time frame
Daily time frame:
A four hour perspective of where price has moved from for the bullish scenario in the short term.
SPX vs the Vix
The Vix to be maintaining below 35 max positional moves will show correctional patterns of distribution flows in the smaller timeframes where price engineering will take place to allow discounted prices to occur.
This will tend to steady the recovery but also give the rally base rally move a chance to breathe.
SPX vs Emerging:
What does the emerging markets show us?
Well the imbalances are within the same as the US market, but the economic recovery in terms of imbalance price driving in the EEM - shows that whilst fundamentally there is more volatility . The activeness of these markets provides a telling Fibonacci extension target is not to dissimilar along with the SPX . The commodities such as Copper , Silver , Gold and Platinum will now provide a solid buy opportunity now the demand will grow.
The second image shows the return % of the fund upon a scale against the SPX on a daily chart close.
Fundamental failures, to ensure imbalances are made clear for the bullish scenario.
The FED injecting 22% of all USD in circulation within one year.
A Staggering amount of est $9T USD was injected to save the US from collapse, despite its ever mounting debt of as it stands 11. 01 .2021
$27.775T USD
www.usdebtclock.org
The question remains as the USD loses value - in order to promote cheaper investment and more prospects for cheaper imports - the country will have a real issue with the constant cycle of financing debt upon debit.
With the Global fiscal policy to remain between 1.5-2% - this should keep the FED side lined for a few years monitoring the US and world economy.
What we would expect to see will be the growth of EM and commodity based countries in terms of FX to continue the growth against the USD.
Last comparison;
Inflation ETF vs SPX500 .
If you as a trader are interested in the price ratio of Shiller P/E ratio , the market is at this moment 35.83x, with low inflation at the moment, the bulls are on the run. Watch this space.
Do you enjoy the setups?
We have 10 years combined analysis experience in world markets.
Offer our technical breakdowns here
Focus on technical output not fundamentals
Position and swing trades
Provide updates where necessary - with new updated ideas tracking the progress.
If you like the idea, please leave a like or comment.
To all the followers, thank you for your continued support.
Thanks,
Team LVPA MMXXI
Goldenratio
Sooo... p sure it’s a yum yum style for $SNDL!Sundial Growers is looking bullish on the 3H chart! The stochastic RSI is getting ready to cross over and the AI has given a buy signal a few bars ago. Who even knows what will happen from here? I have a feeling that I once again will say “told ya so”
Reminder: this is an idea for a LONG position/hold. I have a feeling it will rocketship in the next few years and who knows when it will be this low again.
Not investment advice 💗
Feast ur eyes, see for yourselves! Maybe be a 'lil reversal? It's early to tell if this is a SHORT TERM reversal for this gorgeous fledgling stock. In long term months it may go up. In the medium term it may go down. in the short term it may go up.
It's trading lower today. I have it going down on the daily and weekly chart. However on the 4 hour it looks like it MAY be reaching NEAR relative bottom/support. It went v high so it will take time to consolidate. I don't want to make any public predictions about how long the bearishness will last. However, I will say that my strategy is a yolo diamond hands HODL. I will HODL this stock and grab more. Specifically, I am buying more call options for January 2023. NOT INVESTMENT OR TRADING ADVICE.
Could it be a long term yum yum style?
Do your research!
Not trading advice!
Chainlink $2,000 by October? Golden ratio timeframes & fractalsCan Chainlink repeat its past and reach $2,000?
Chainlink likes to repeat its past USD moves within golden ratio timeframes, and these timeframes are accelerating at a multiplied factor of the golden ratio (~1.618). According to this, could Chainlink repeat its performance and climb to $2,000 by October this year? Let's wait and see.
Fibonacci Retracement and Extensions Imagine a Box that's being fired everytime market makes a swing.
Multiples of boxes of bear/bull. That is what fib is 0 to 1.
Many people say "So its going to go up or So its going to go down?" well answer to that is BOTH.
They are always fighting and more often than naught one will break and other one will move on to its multiplier.
Pretty simple and powerful stuff.
You're in luck! The market is pulling back but $ABCE will MOON! Looking juicy! 💦
ABCO Energy, Inc. is a commercial and residential installer of Photo Voltaic (PV) solar systems, LED lighting solutions and financing for all of these energy saving products. ABCO Energy, Inc. is a Nevada corporation, doing business as 'ABCO Solar' which maintains offices located in Tucson, Arizona. In 2020 ABCO added energy efficient HVAC business.
not trading advice
GBP AUD - rejection of 4hour 61.8% FibonacciHello analysts and traders,
Here is a nice opportunity for buys which has happened this morning European session;
What happened? well from the low to the high, take your fibonacci retracement tool and plot the 61.8% zone where we anticipated the buys.
GBP still has bullish potential here to climb into 1.8XX
The rejection happened nicely at 1.78 as expected. This pair has a nice liquidity zone so when entering be aware of a larger stop loss in comparison to other pairs.
here is the updated daily perspective
See our previous idea below;
See the AUD USD
Technicals to assess.
We have a nice technical sell of yesterday but with the AUD USD rebounding in a negative light, the GBP has entered the supply again with a boost from the risk-off aversion.
From the chart below, watch out for the fresh daily zone which has not been truly tested yet. , this has now been tested and rejected from the zone as expected.
The main buy and hold area;
1. Zone 1: - inefficiency
we will be looking at a test of the order block, movement away to keep shorts flowing to keep the imbalance moving towards the zone of a 1.72 redistribution, liquidity to show bears further short options before the lows.
From here we will expect a spring and a test of said springs.
A rejection will occur and then see accumulation phase of price hitting the target on the AUD USD with bullish Aussie.
Why follow us?
Updates on our pairs as and when we can.
Swing trade out looks
10 years combined experience in capital markets
simple breakdowns for beginners to advanced .
KISS - keep it simple stupid.
we trade purely from naked charts, less indicators - remove the noise and clears your mind.
If you like our work, please leave a like or comment. To all our followers, we appreciate the follow and likes.
Regardless we will continue producing analysis.
Thanks,
Team LVPA MMXXI
Bear Boy BotFollow up on the previous bull chart. Lower frame next. See those zones just leads into one and another making bull and bear setups in process. Practice precision entries and proper risk management. Paper trade first to make the infamous “i hesitate” fear go away. If you know by paper trading that your system works then you wouldn’t hesitate to pull the trigger. Its all about management. Business first hand. Be aware of price action.
Magic 0.618 — Bitcoin Bull Trend 2019 vs 2020/21 Hello!
Bitcoin price seems stuck at 20k resistance zone. But here is a beautiful thing I have found on the chart.
Current price action can be compared to 2019 rally. I showing beautiful fractal, and what important is — the number 0.618. You may find I put Fibonacci retracement on the right screen in 2019 chart. The Fibonacci ruler put between swing high and low (number 1 at support line), and magic is 0.618 point (golden ratio) sets exactly at touch number 3 on resistance line, and the numbers are not random.
I think I noticed similar sequence of touches to the trend line Blue and Red, and marked them with numbers.
So the same analysis I send to the left screen on 2020/21 chart, and it following same sequence of trend lines touches and I was wondering to put 0.618 Fib ratio from touch 1 at support line, up to 3 touch on resistance, and I get number 22000$. I think it could be possible next swing high.
So now we can take our decision to take next trade according to our risk management.
Let luck be on our side.
Best regards,
Artem Shevelev
Trend Trading Techniques and Strategy!!! In a strong trending market, it is important to find entries at the high probability zones i.e. Fib Retracements. Ideally within the .382 - .618 zones. It may be tempting to enter the market during a period of strong momentum, but itmust be known that every strong trend contains correction phases, this is where you capitalise on the trend momentum. Entering the market mid-impulse can work occasionally and can be misleading to the beginner trader, over a long period of time this just wont work(All profitablilty and success of a trader comes from a long period of trades/ time trading, one trade does not determine success). Once price has corrected to the ideal Fib zone, you can now look for an entry setup to capitalise on the potential momentum shift and continuation of impulse.
The Magic of Fibonacci Numbers - Golden RatioAn Easy To Understand sequence represented as 0 1 1 2 3 5 8 13…. where each number is the sum of the preceding two numbers, with the series starting from 0, 1.
But, did you ever realize how magical these numbers are?
Fibonacci numbers appear in so many contexts in our lives and surroundings, for example, the number of the petals in a flower, the seed heads of a flower, paintings, and a lot more. In fact, the beauty of a human face is based on Golden Ratio whose nth power forms the nth Fibonacci number. (the nth Fibonacci number is 1.618n where 1.618 is the Golden ratio).
These numbers display a lot of magical patterns.
Given the Fibonacci numbers: 1 1 2 3 5 8 13 21 34 55 89…
Let’s square these numbers: 1 1 4 9 25 64 169…….
The addition of two Fibonacci numbers gives us the next Fibonacci number. But, What’s so special about their squares?
Look closely to see that the addition of the 2 consecutive numbers from this squared series of Fibonacci numbers would give you alternate Fibonacci numbers. Let’s realize this:
The squared Fibonacci series is 1 1 4 9 25 64…
Now, 1+1 = 2
1+4 = 5
4+9 = 13 And, so on..
1 1 2 3 5 8 13 21……
Let us now add more than 2 numbers of this squared series increasingly.
1+1+4 = 6
1+1+4+9 = 15
1+1+4+9+25 = 40
1+1+4+9+25+64 = 104
These do not seem to be Fibonacci numbers. But, if you analyse closely, you can see that these numbers enclose hidden Fibonacci numbers.
1+1+4=2* 3
1+1+4+9=3*5
1+1+4+9+25=5*8
1+1+4+9+25+64=8*13
But, why is it that? 12+12+22+32+52+82 = 8*13
Area of this rectangle = sum of the areas of squares inside it = 12+12+22+32+52+82
Also, Area of rectangle = length*breadth = 8*(8+5) = 104 which proves that
12+12+22+32+52+82 = 8 *13
If we continue this process of merging these squares to form rectangles, we can get rectangles with dimensions:
8*13
13*21
21*34
34*55
55*89….
If we divide the dimensions of these rectangles keeping the larger dimension in the numerator, we end up with these figures:
8*13 => 13/8= 1.625
13*21 => 21/13 =1.615
21*34 => 34/21 = 1.619
34*55 => 55/34 = 1.6176
55*89 =>89/55 = 1.61818
As we continue dividing the dimensions of larger rectangles, we would get close to 1.618033… which is defined as the Golden Ratio.
This Golden Ratio particularly is of great interest to mathematicians since it holds great significance in our surroundings and environment.