AIQ heads up at $44.37/67: Double Golden fib zone will be strongAIQ has been floating up towards a Double Golden zone.
$44.37 is a Golden Covid and $44.67 a Golden Genesis fib.
High-Gravity area is likely to hold this in orbit for some time.
.
Previous analysis that caught a PERFECT BREAK OUT:
=======================================================
.
Goldenratio

ADBE watch $362-364: Key Support zone must hold to end DownTrendADBE was struggling before last earnings and dumping since.
Currently trying to lift out of a significant support at $362-364
Looking for a Break-n-Retest of zone top Genesis fib at $324.26
.

KBE watch $48.16/18: Double fib to End Bounce or Break-n-Run?KBE and financials trying to recover from tariff dump.
Currently testing a double fib zone at $48.16-48.18.
Look for Rejection or Break-n-Retest for entries soon.

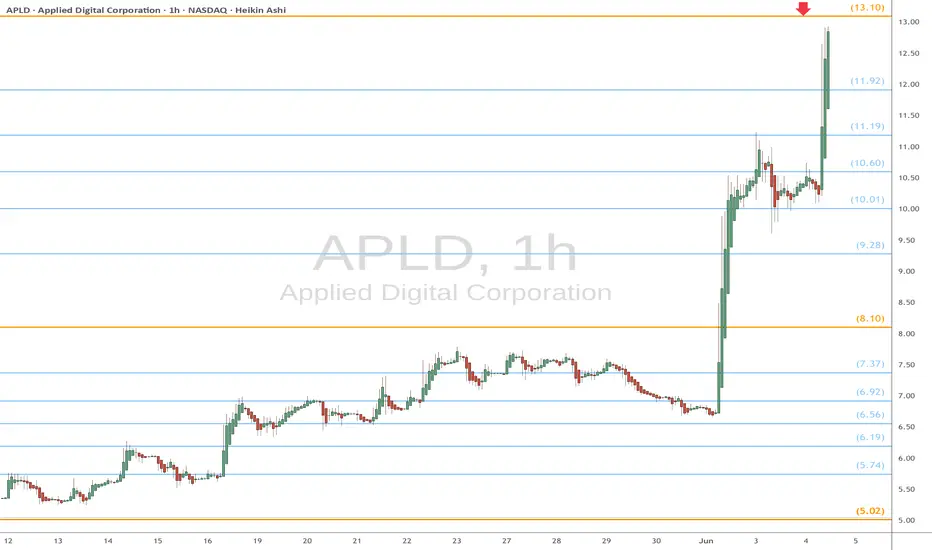
APLD heads up at $13.10: Golden Genesis fib may stop the SurgeAPLD on a massive surge over various company news.
Currently about to hit a Golden Genesis fib at $8.10
Looking for usual Dip-to-Fib or Break-and-Retest to buy.
It is PROBABLE that we "orbit" this fib a few times.
It is POSSIBLE that we get a significant dip from here.
It is PLAUSIBLE that we break and run if bulls are hyper.
.
See "Related Publications" for previous EXACT plots --------------------->>>>>>>
.
ZORA.usd eyes on 6 cents: Golden Genesis fib a TOP or RELOAD? ZORA has been flying since Coinbase integration.
Currently range bound by Goldens at 4 and 6 cents.
Look for a Rejection-Short or Break-n-Retest for longs.

PENGU.usd eyes on $0.0437: Golden Genesis to END run or BREAK? PENGU has been running for many days now.
Currently testing a Golden Genesis at $0.0437
Could mark lower high of TOP, or Break-n-Run.

ENS.usd eyes on $29.32: Golden Genesis fib stalling a BIG break?ENS surging along with Ethereum, as expectable.
Now up against a Godlen Genesis fib at $29.32
Look for a Break-n-Retest to signal a break out.

BTC Retrace RoadMap and 3 nearby supports worth watching NOWThis is a near-term followup to my big picture linked below.
Dip is underway after orbiting our Genesis Fib at 117.9k.
Quickly approaching the next three supports worth watching.
Supports get stronger below but each one needs to slow the dip.
$ 115,140 is a minor fib but possible end of dip wave.
$ 113,9xx is a double fib that should be pretty strong
$ 111,661 is the sister Genesis fib, and a MUST HOLD
.
Big Picture chart and why 117.9k was KEY
=======================================================
.

XLY eyes on $198: Major resistance zone for recovery wave XLYXLY is a key etf/index to evaluate tariff sentiment.
Currently fighting a major resistance $197.88-193.23
Look for a Break-and-Run or Reject hard from here.

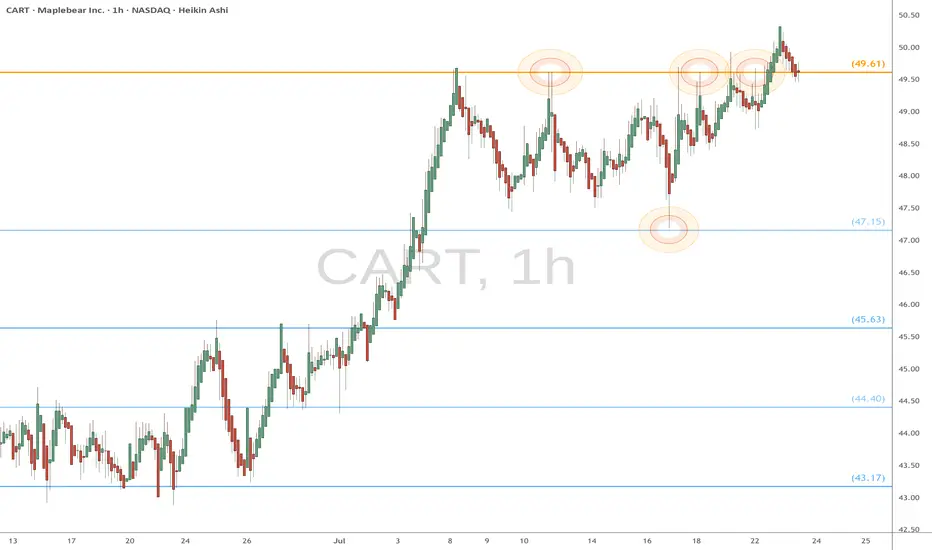
CART watch $49.61: Proven Golden Genesis fib holding up new ATHCART has been struggling against a Golden Genesis at $49.61
Many PINGs have made it clearly visible to the whole world.
If the Break-n-Retest holds, it should start next major leg up.
.
Previous Analysis that NAILED this exact fib for a MASSIVE short:
Hit BOOST and FOLLOW for more such PRECISE and TIMELY charts.
=========================================================
.
CLF heads up at $7.51: Golden Genesis fib may give a Dip buyCLF shot up strong after Trump increased tariffs on Steel.
It has just hit a Golden Genesis fib that may give us a dip.
Looking for a dip to $7.06 fib or a Break-n-Retest of 7.51

FAST watch $42.64/76: Double Golden zone holding up new ATH FAST has been grinding higher into ATH territory.
Struggling against Double Golden zone $42.64-42.76
Look for a Break-n-Retest as the likely next move.

CAT watch $308 above 302 below: Major fibs define range to breakCAT just released Earnings report with small "miss".
Price oscillating between major fibs $301.97-308.82
If Bull, look for a pop to tight zone $325.49-326.16

DNUT eyes on $2.57: if this HAS a bottom, THIS may be the oneDNUT has been in free fall since IPO.
Last Earnings were apparently horrible.
But there is a glimmer of hope of bottom.
$2.57 is a minor but significant fib.
The PING bounce on it is of interest.
"Ping" from "give me a ping Vasilly".
=====================================
.

WMT eyes on $95.68 above 93.38 below: Double Golden fibs are KEYWMT has been orbitting this Double Golden zone.
$95.68 is a Golden Genesis, $83.38 a Golden Covid.
This is the "highest gravity" cluster any asset can have.
This is a very important landmark in this stock's lifetime.
==================================================
.

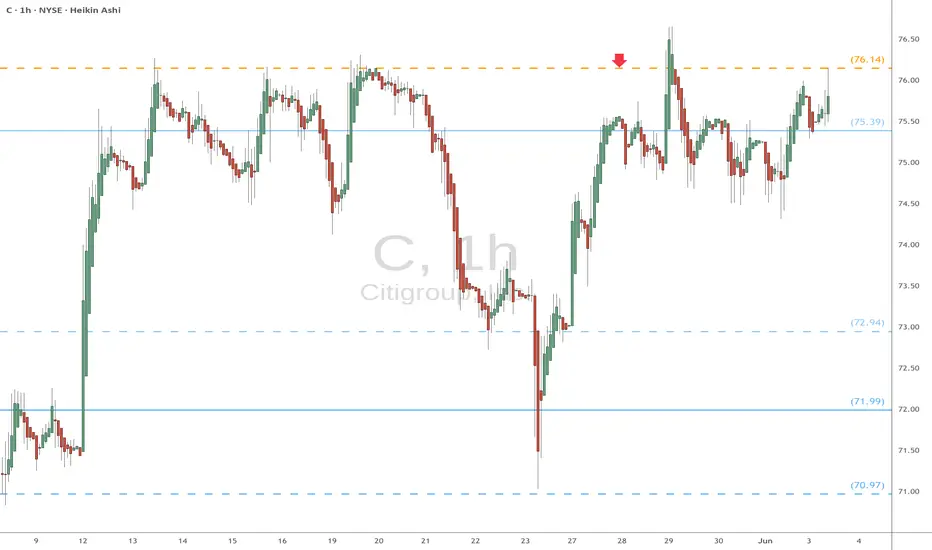
C (Citi) eyes on $76.14: Golden Covid ready to launch BreakOutC with all banks has recovered to pre-tariff levels.
It has pierced a proven Golden Covid fib at $76.14
Look for a Retest (preferably with a Ping) for entry.
OKLO eyes on $72.37: Golden Genesis fib that should give a DIP OKLO going nuclear into a Golden Genesis fib at $72.37
Looking for a Dip-to-Fib or a Break-n-Retest new longs.
Most likely a few orbits around this ultra-high gravity fib.
.
Last Plot caught break and sister Genesis Fib
.
Older Plot caught the perfect Dip-to-Fib buys:
.
Hit the BOOST and FOLLOW to catch more such EXACT trades.
=======================================================

DELL eyes on $116.10: Golden Genesis fib will determine TrendDELL has been a sleepy stock with mixed earnings.
Now testing a proven Golden Genesis at $116.01
Look for a Break-and-Retest to start an Uptrend.
.
See "Related Publications" for other plots ---------------------->>>>>>>
This one in particular is caught the BOTTOM exaclty:
===================================================
.

CSCO eyes on $59.22: Key resistance to Tariff Recovery waveThis "internet oldie" usually lags the newcomers.
The key will be to break the Covid fib at $59.22
If we get a dip then look to the sister fib at $57.81

MU eyes on $95/97: Double Golden fib zone Ultra-High GravityMU looking to exit a Double Golden zone $95.33-97.23
Break could pop to next resistance zone $109.41-111.38
Expecting some orbits around this ultra high gravity zone.
.
Previous Plot that caught the bottom EXACTLY:
==================================================
.

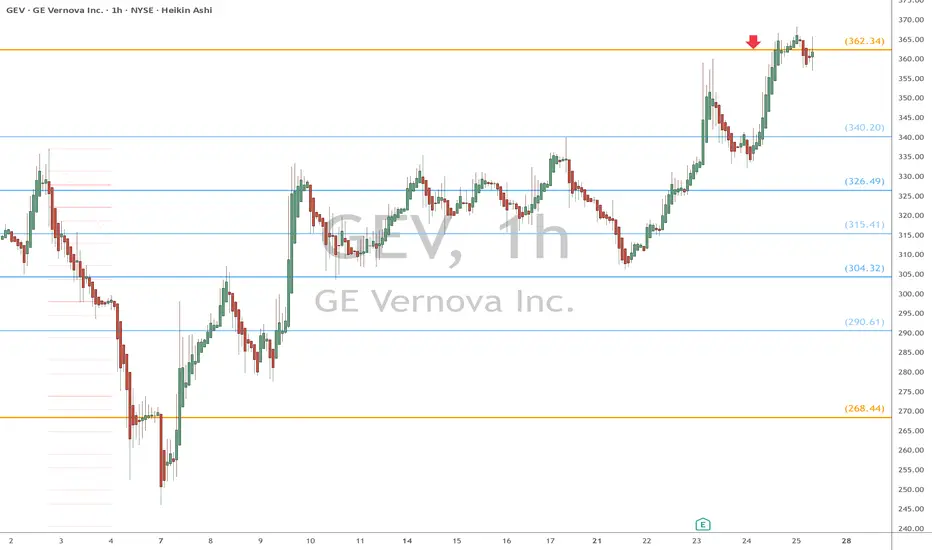
GEV eyes on $362.34: Golden Genesis Fib that may End BounceGEV trying to recover with the general market.
Currently testing a Golden Genesis Fib at $362.34
Looking for a Dip here, or Break-and-Retest entry.
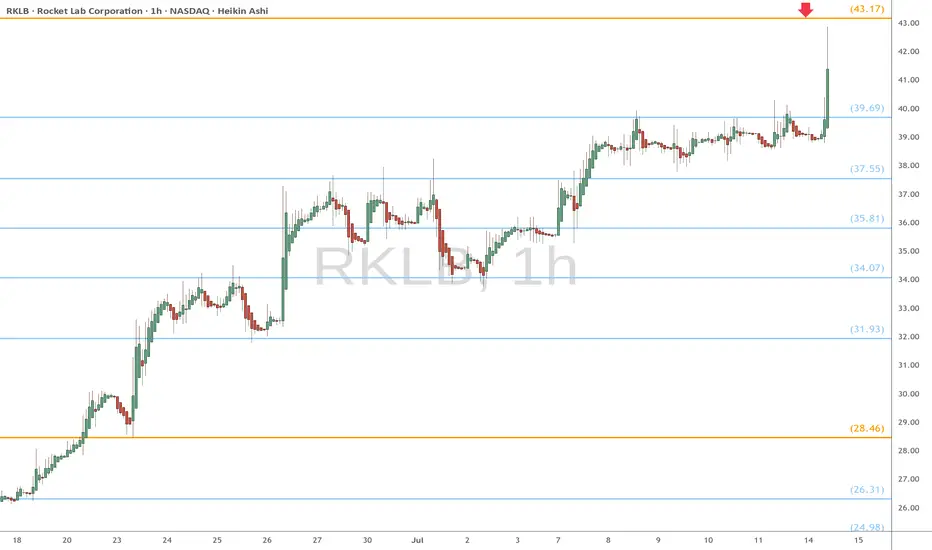
RKLB heads up at $43.17: Golden Genesis fib may knock it downRKLB has been rocketing upward from $4 to $43.
It is about to hit a Golden Genesis fib at $43.17
Expectng a dip from it, or a few orbits at least.
AMSC eyes on $40.18: Golden Genesis fib holding up new ATHAMSC has been bobbing into a Golden Genesis fib at $40.18
Look for a Break-n-Retest to start next leg of uptrend.
Beware of a possible rejection for a high velocity dip.
.
Previous Analysis that gave a PERFECT SWING trade:
Hit the BOOST and FOLLOW for more such a PRECISE and TIMELY charts.
==============================================================
.
