MRK eyes on $80.36/74: Double Golden zone break to end DownTrendMRK and all pharma has been dropping forever.
Just pierced the Double Golden zone yet again.
Break and Hold of this zone will say "bottom".
.
Goldenratio

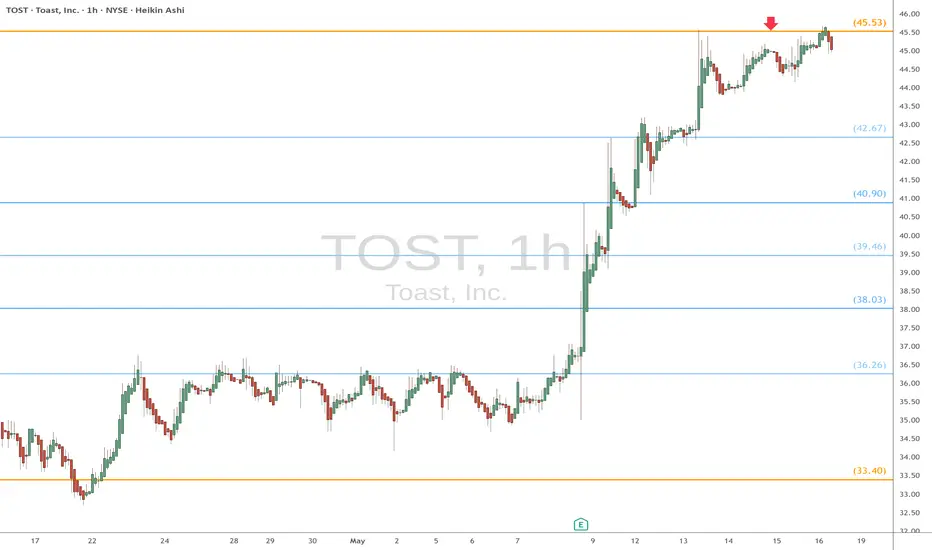
TOST eyes on $45.53: Golden Genesis fib already proven strongTOST has been on a ferocious rip upwards.
Now struggling against a Golden Genesis fib.
Look for a Break-n-Retest or Dip-to-Fib buy.
.
Last plot that caught the HUGE breakout gains:
==========================================
.
URI eyes on $671: proven Double Fib zone holding up new Highs URI should actually BENEFIT from Tariffs.
Currently testing a double fib at $671.16/30
Look for a Dip to a Break-n-Retest for entry.

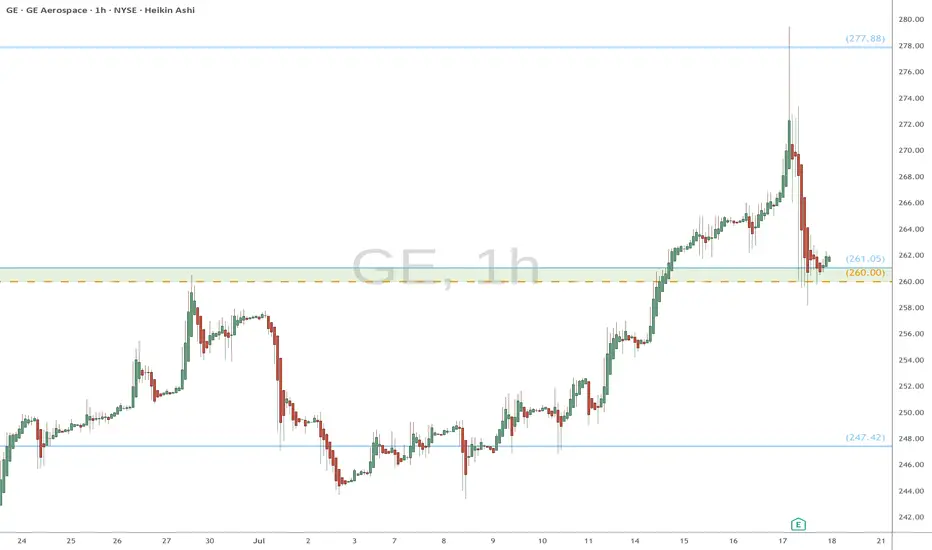
GE watch $260-261: Key support to maintain strong UptrendGE has been in a strong uptrend for a couple of years now.
Earnings report dropped it to support zone at $260.00-261.05
This zone is now clearly visible to everyon, so Do-or-Die here.
Long entry here with tight stop loss just below zone.
======================================================
.
DDOG eyes on $116.34: Golden Genesis fib to determine the TrendDDOG bounce just hit a Golden Genesis at $116.34
The sister Goldens above and below marked extremes.
This one could mark the orbital center for some time.
It is PROBABLE that we orbit this fib a few times.
It is POSSIBLE that we see a pullback from here.
It is PLAUSIBLE but unlikely to continue non-stop.
===============================================
.

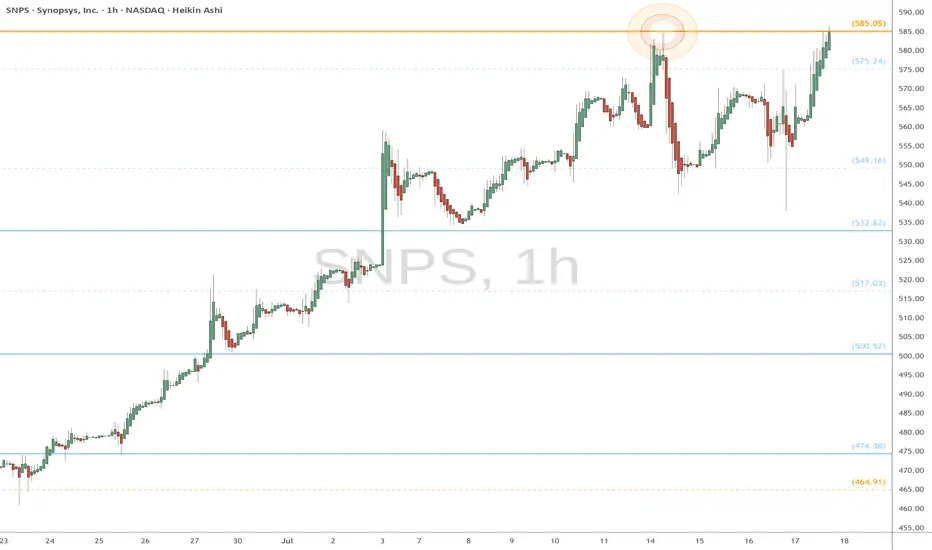
SNPS eyes on $585.05: Golden Genesis break should RUN strongSNPS back to a Golden Genesis that caused last dip.
Current stance and market winds favor break and run.
$585.05 will be key for entries and tight stop losses.
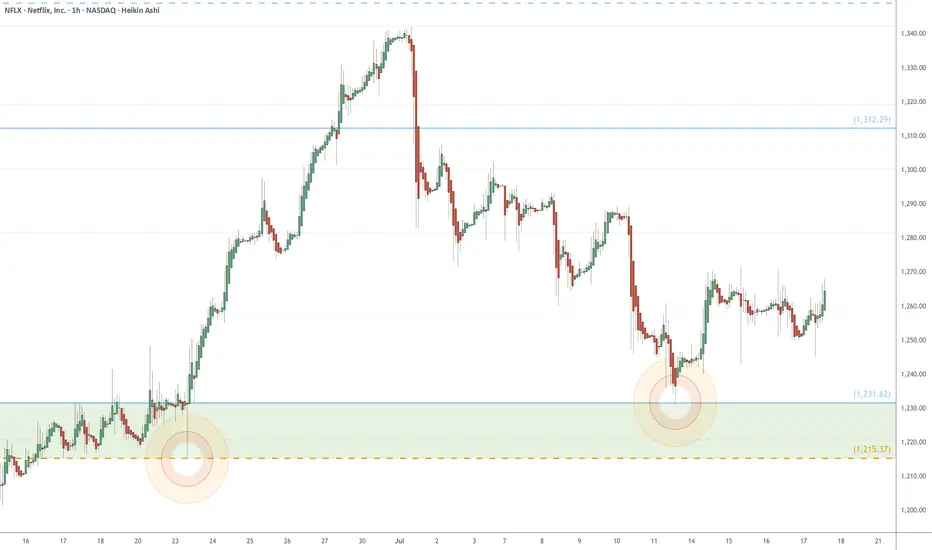
NFLX eyes on $1215-1232: poised for next leg UP with earningsNFLX broke and retested a key resistance zone.
Loud PING's on two major fibs announced support.
It is perfectly set to LAUNCH if earnings are good.
Positive earnings may push to mid $1500's above.
Negative may drop to $1061 Golden Genesis below.
Neutral report should continue uptrend from here.
.
See "Related Publications" for previous charts such as this BOTTOM CALL:
============================================
.
ROK eyes on $245: Key Resistance break may Mark bottomROK trying to recover along with the general market.
Now testing a well proven resistance at $243.94-245.03
Look for a Break-and-Retest for possible long term entry.

JNJ watch $156.72-158.17: Double Golden Fib zone about to break?JNJ struggling against Double Goldens at $156.72-158.17
After many tests from underside, it looks ready to break.
Above this zone are only scattered clouds for some ways.

SMR heads up at $40.78: Golden Genesis fib may cause a DIPSMR got a strong spike with all nuclear stocks.
It has just hit a Golden Genesis fib at $40.78.
Look for a Dip-to-Fib or Break-n-Retest for longs.
.
See "Related Publications" for previous plots including this BOTTOM CALL:
===========================================
.

XME eyes on $57.40: Golden Genesis a MAJOR barrier already felt XME recovering nicely from the tariff tantrum.
$57.40 is the exact level of the Golden Genesis.
High Energy object whose heat is clearly noticed.
It is PROBABLE that we orbit this object a few times.
It is POSSIBLE that it rejects to the retest fibs below.
It is PLAUSIBLE that bulls could blow thru it this time.

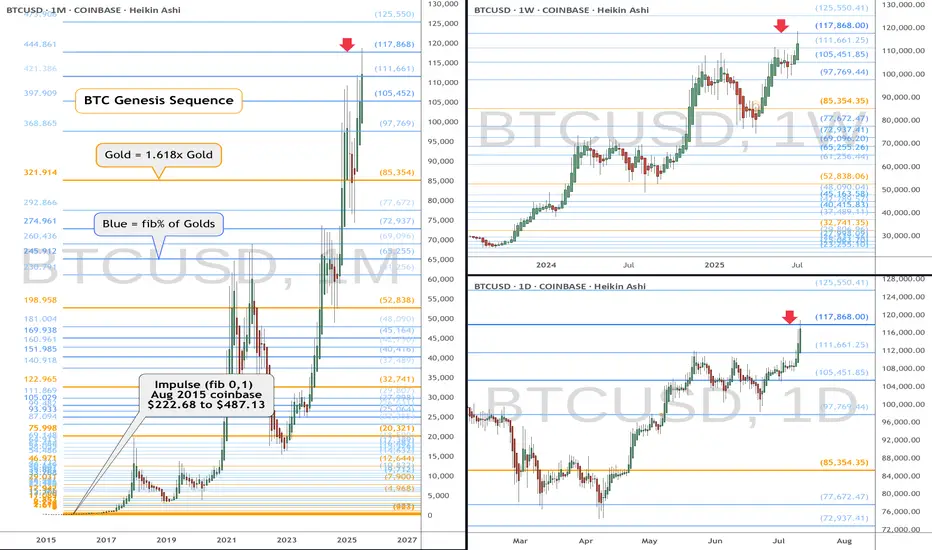
BTC eyes on $117,868: SemiMajor Genesis fib to Orbit a few times\Shown here is a single fib series in three different time-frames.
The "Genesis Sequence" has called all major turns since 2015.
This are "High Gravity" Fibs try to capture price into Orbit.
$ 117,668.00 (Coinbase) is the exact level of interest.
$ 111,661.25 is the first support below, a minor ratio.
$ 105,451.85 is semi-major and MUST hold fib below.
$ 125,550.41 is the next target above, a minor ratio.
See "Related Publications" for many PRECISE and TIMELY charts -------->>>>>>>
.
MSFT watch $392.76-394.12: Key Resistance to Tariff RecoveryMSFT testing a well proven Resistance zone $392.76-394.12
This zone rejected twice already, now may be ready to break?
Fib reactions have been precise, so look for Break-n-Retest

ARKQ heads up at $83.xx: Proven Resistance break should RUN hardARKQ about to try a well proven resistance again.
Dual fibs mark the rejection zone $82.83-83.34
Looking for a Break-and-Retest for long entries.

KRE eyes on $54.xx: Major Resistance zone to Break or RejectKRE recovering nicely from the tariff tantrums.
But up against a major resistance zone $54.23-54.79
Want a Break-n-Retest or dip to lower fib at $51.39

TSM eyes on $194: Major Resistance to Break-n-Run or Dip-to-Buy TSM has been recovering with the chip sector.
Currently testing a Major Resistance zone.
Look for a Dip-to-Buy or Break-n-Retest entry.
$193.92-195.18 is the exact zone of concern.
$177.83-178.31 is the first major support.
$203.68-204.56 is the first resistance above.
========================================
.

MP eyes on $49.43: Golden Genesis fib stopped the news spikeMP is now partially owned by the DOD, which spiked the price.
That massive move smacked into the Golden Genesis at $49.43
Look for a Break-n-Retest for idea long, or Dip-to-Fib below.

NLR eyes on $111.03: Golden Genesis fib holding up new ATH NLR NLR struggling with this Golden Genesis fib at $111.03
Ultra High Gravity fib has shown its strength repeatedly.
This push might be "the one", the one to finally break away.

AXON watch $681-696: Proven resistance around ATH for a REASON AXON testing it All Time High resistance zone again.
This time it launched off a Golden Genesis below.
So it should have enough energy this time to break it.
$681.69-696.45 is the exact zone of interest.
$732.49-735.17 is first target then dip for retest
$660.41 then 616.01 are key supports below if dips.
==============================================
.

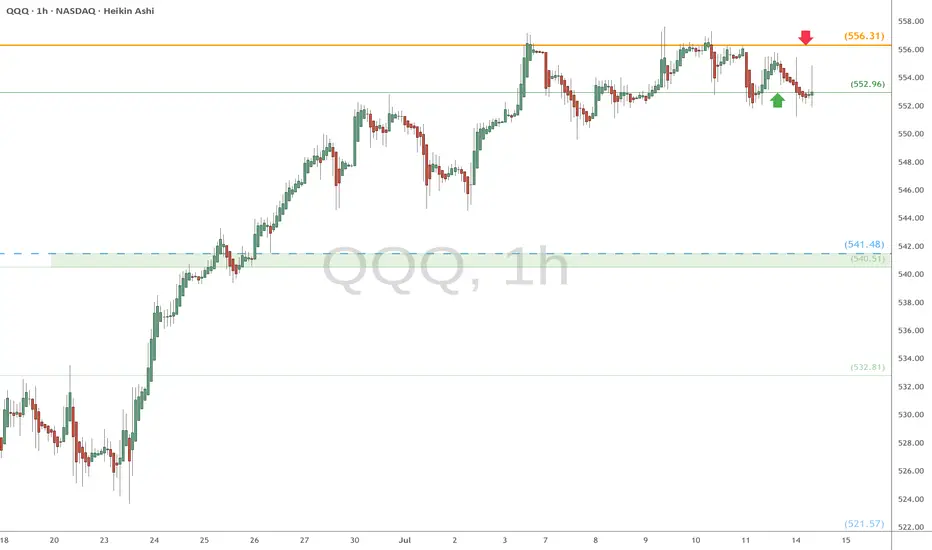
QQQ watch $556.31 above 552.96 below: Break of either should RUNQQQ (Nasdaq) has flown off the bottom like a rocket.
Now up against a Golden Genesis fib at $556.31.
Local support fib from bottom is below at $552.96.
Break of either should result in a strong next leg.
Next decent support below is at $54.51-541.58
============================================
.
DPZ watch $496/497: Double Fib resistance to possible new ATHDPZ has been range bound for a while.
Up against a double fib barrier into earnings.
Look for reject or break of $296.58-497.08

MCHP watch $59.xx: Proven Resistance break could POP stronglyMCHP trying to recover along with the Chip sector.
Now testing a well proven resistance $59.10-59.62
Looking for a Break-and-Retest of zone to enter long.

DRIV eyes on $24.00: Golden Genesis fib holding orbit over 3 yrsDRIV is once again testing the Golden Genesis at $24.00
Ultra High Gravity fib has held it in orbit for over 3 years.
Break and Retest should start the next Leg with vigor.
Looking for a Retest entry to pop to $26.13 minimum.
==================================================
.
