MMM eyes on $140: Key Support that bulls MUST hold for next leg MMM trying to recover and last Earnings were good.
Currently testing a proven zone at $140.06-140.37
Bounce here would Target zone at $147.90-148.35
Goldenratio

EAT eyes on $134: Earnings Dump fell into a key support to buy?EAT earnings report was apparently pretty bad.
Fell through several supports but trying to hold.
Watch critical and proven zone at $134.06-134.77

GNRC watch $114.19: Minor but Key fib to end Perpetual DowntrendGNRC has been trying to paint a bottom for the last month.
Now watching the Genesis fib at $114.19 for Break or Reject.
If it rejects then we will watch double fibs at $107.66-107.72

XLB eyes on $85: Proven Support zone to End Bounce or to Break?XLB has recovered the tariff tantrum dumps.
But struggling against a proven resistance zone.
Dip is likely, Break-n-Retest means Strong bull.
$84.61-85.24 (red) is the exact zone of concern.
$79.66-80.27 (green) is first strong support below.
$71.71-72.23 (Gold) a double golden major support.
=============================================

DXY eyes on 97.847 - 97.903 : Exact zone to break the DownTrend The Dollar has not been so mighty since Trump.
But there are signs of a possible bottom forming.
Key is the well known battle zone 97.847-97.905
Break and clean Retest would signal the bottom.
Rejecting here would start next leg southward.
Is the world really going to De-Dollarize? Nope.
===========================================
.

TSLA eyes on $294: Key Support for bulls to hold or face $253TSLA oscillating all over the place thanks to Musk moves.
Currently testing a key support zone $293.96-294.32.
Loss of this floor opens the Golden Genesis at $253.57
See "Related Publications" for previous charts ------------>>>>>>

IBM eyes on $282.88: Golden Genesis fib a Key Support to uptrendIBM has been in a strong uptrend but looking top-ish.
It has pulled back to a Golden Genesis fib at $282.88
Look for a bounce but perhaps after a couple orbits.
.
See "Related Publications" for previous charts like this BOTTOM CALL:
Hit the BOOST and FOLLOW for more such PRECISE and TIMELY charts.
============================================================
.

CMG watch $55.76: Golden fib maybe good support for Next Leg UPCMG trying to recover from loss of CEO and tariff worries.
Uptrend showing signs of strength, retesting a key support.
$55.76 a possible long entry with $54.84 fib for stop loss.
.
Previous analysis that caught THE BOTTOM:
====================================================
.

OSK eyes on $125.42/52: Double Golden Fibs likely to Orbit a bitOSK has been rising with the market and industrials.
It is hst just hit Dual Golden fibs at $125.42-125.52
Expecting a few orbits and possible dip from here.
.
This pair of Fibs called THE PREVIOUS TOP:
.
The smaller Golden Sisters also called THE BOTTOM:
Hit the BOOST and FOLLOW for more such PRECISE and TIMELY charts.
=============================================================
.

XBI eyes on $79.28: Golden Covid fib may mark the BioTech bottomXBI has been getting dumped since Trump and RFK
If biotech is to recover, it might start here and now.
Bulls need to hold or at least orbit this a few times.

BA heads up into $230: Strong fib zone might cause a serious dipBA has been flying (lol) from its last crash caused crash.
About to test a signrificant resistance at $229.82-230.73
Expect at least some "orbits" or a pullback from this zone.
.
Previous analysis that caught THE BOTTOM:
==================================================
.

AFRM eyes on $50.66: Semi-Major Genesis fib for High Support AFRM has been showing considerable strength.
Hit a Geneiss fib above and fell back to sister fib.
Strong Bull trend would hold this fib into new highs.
$50.66 is the immediate floor to hold
$49.17 is a minor fib for a speed brake.
$47.60 is Bulls' Last Stand to hold uptrend.
=============================================
.

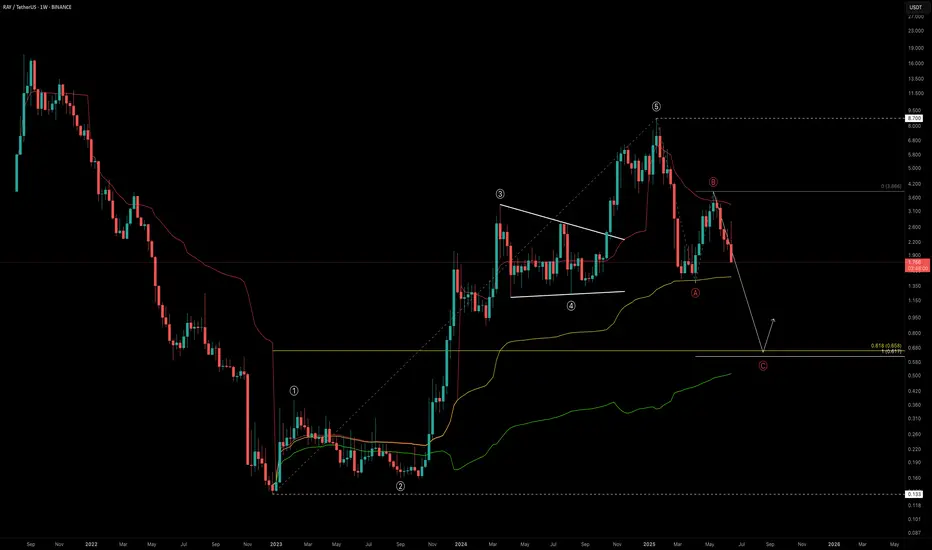
RAY Outlook: Is a -60% Drop the Reset We Need?RAY marked its bottom in December 2022 at just $0.133, entering a prolonged accumulation phase that lasted nearly a year. Then, in late 2023, it broke out into an explosive bull run, skyrocketing +6421% over 756 days and peaking at an impressive $8.70.
This run completed a full five-wave Elliott Wave structure. After topping out, RAY dropped -84% down to $1.388 — likely marking the Wave A correction. A strong relief rally followed into the $4 region before facing rejection at the yearly VWAP, possibly completing Wave B. Now, all signs point toward us being in the final Wave C of the larger corrective structure.
So, where could Wave C bottom out?
🔍 Fibonacci Confluence Zones (Log Scale)
Let’s assess the key levels with log-scaled Fibonacci tools:
🔹 Fib Retracement (from $0.133 low to $8.7 high):
The 0.618 fib retracement lies at $0.658
🔹 Trend-Based Fib Extension (Wave A → B projection for Wave C):
1.0 TBFE sits at $0.617
✅ These two levels align nearly perfectly, giving us a strong confluence zone between $0.62 and $0.66
Additional Confluences
Anchored VWAP Bands:
The 0.618 VWAP band multiplier also aligns with this $0.6 zone
Liquidity Perspective:
This level would wipe out long positions built over the past 550 days — clearing and potentially resetting the market
🚨 Fair Value Trend Model (FV Trend Model):
According to my Fair Value Trend Model indicator, the fair value for RAY currently sits around $0.78 — right in line with the broader confluence zone. This model uses log-log regression to estimate Bitcoin’s and other assets’ fair-value over time.
👉 Feel free to use the indicator
Just head over to my profile, click on the “Scripts” tab, and you can add the Fair Value Trend Model to your charts to experiment with it yourself.
Together, these technical elements form a compelling high-probability zone for long setups around $0.6–$0.8.
💡 Educational Insight — Why 0.618 is a Critical Fib Level
In Elliott Wave theory and harmonic trading, the 0.618 retracement is known as the "Golden Ratio" — often serving as a magnet for price during corrections. When paired with a 1.0 trend-based fib extension, it can mark exhaustion zones where Wave C concludes.
🔭 Summary: What’s Next for RAY?
Potential bottom zone: $0.61–$0.78
Watch for reversal signals like bullish candlestick patterns, volume spikes, or divergences
A drop to this zone would represent a -60% drawdown from current levels
Remember: High-probability setups don’t come every day — patience is your edge
Set alerts. Stay prepared.
_________________________________
💬 If you found this helpful, drop a like and comment!
Want breakdowns of other charts? Leave your requests below.
BTC eyes on $97.8k: Last stop before 85.3k Golden Genesis retestShown here is a single fib series in three different time-frames.
The "Genesis Sequence" has called every major turn since 2015.
Clear reactions at each fib confirms our faith in the "Golden Ratio"
Topped at the 111.66k fib, and orbitted the 105k fib for a bit.
Now approaching a critical fib at 97.8k that bulls must fight for.
If it does not hold then we look to the Golden Genesis at 85.3k
$ 97,769.44 is the exact location of next fib.
$ 85,354.35 is the exact location of the Golden fib.
Golden Genesis fibs deserve the respect of a retest.
===================================================================
Previous calls of the Genesis Sequence include these amazingly PRECISE turns:
$111k Top call:
$105k recent Top call:
$73k previous Cylce top:
Hit the FOLLOW and BOOST to encourage more such PRECISE charts.
===========================================================
.

LULU eyes on $243-248: Decent Support to buy after Earnings DumpLULU earnings report caused a severe dip in price.
It is now testing a serious support at $243.81-248.17
Look to hold, or stab below and come back above.
.
Last Plot that gave PERFECT entry and exit:
.

AMSC eyes on $29.20/40: Key Resistance holding BreakOut to $35AMSC has been grinding upwards in a nice uptrend.
Currently testing a serious resistance $29.20-20.40
Break should continue grind to next res around $35

CRWD watch $450 then 437: Supports to buy after Earnings dumpCRWD ran up into the earnings report then sold the news.
Initial drop hit a minor support zone $449.08-451.81
May well drop to semi-major support $436.67-437.51

CHWY eyes on $40.07: Golden Genesis may Double Top or RunCHWY trying to recover from a long downtrend.
Currently testing a major landmark of its lifetime.
Golden Genesis already topped once, trying again.

PLTR eyes on $133.37 (again): Golden Genesis to BREAK this time?PLTR has made a round trip to our Golden Genesis.
Looking for a Break-and-Retest of this proven fib.
This time we should POP nicely after it breaks.
.
Full Frontal of its Genesis Fib:
See "Related Publications" for previous EXACT plots --------------->>>>>>>
.

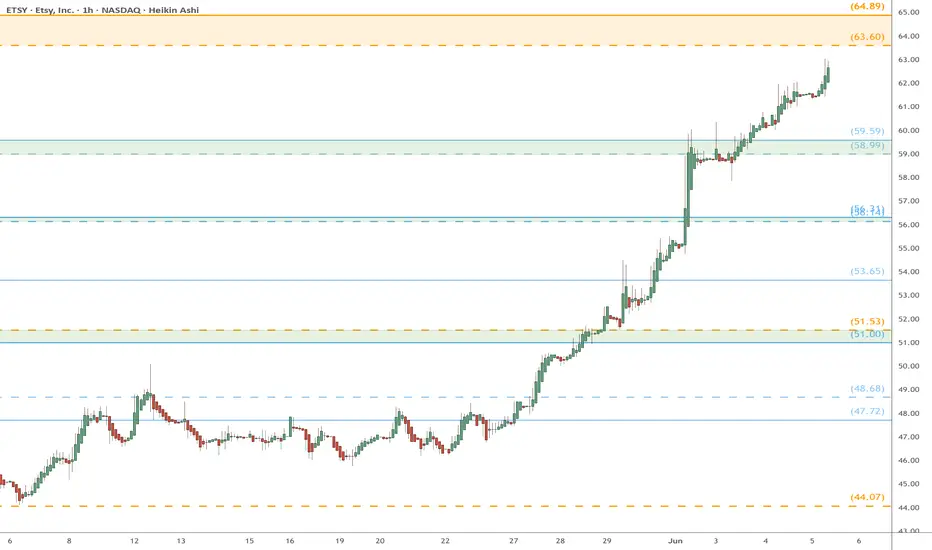
ETSY watch $64.xx: Double Golden zone to take some ProfitsETSY finally coming off its bottom and moving with gusto.
Approaching a Double-Golden fib zone at $63.60-64.89
Look for a Dip or Consolidation before uptrend resumes.
FIVE eyes on $63.00: Golden Genesis fib for 8% bounceFIVE trying to launch off Golden Genesis fib at $63.00
Target for bounce would be double fib at $68.46/54
Stop Loss just below Golden for high Risk -:- Reward.

LRCX watch $71.06-71.37: proven Fib Zone to Pump or DumpLRCX trying to recover along with the semis overall.
Currently testing a well proven zone at $71.06-71.37
Bulls want to push immediately without any dip here.

LULU watch $268 (again): Double Golden fibs may Break this timeLULU bounced back into the tight confluence of Goldens.
Golden Genesis at $267.70 and Golden Covid at $268.74.
These mark a major landmark in the lifetime of any asset.
