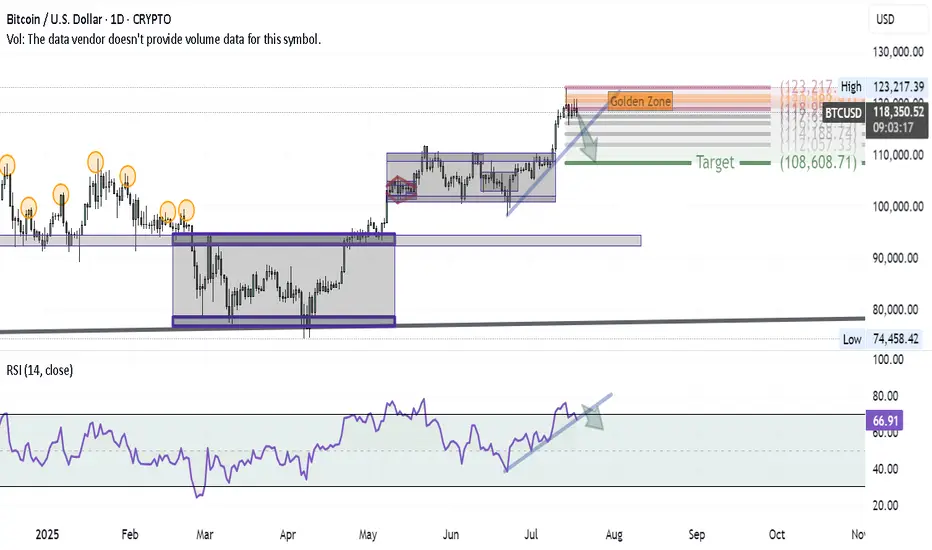
Bitcoin Correction Unfolding — First Wave in MotionAfter successfully hitting the BITCOIN target and anticipating a major correction in my previous ideas, here’s how the first wave of that correction is shaping up on the daily chart:
1- At the recent high, a Shooting Star candle formed — a classic reversal signal.
2- Using Volunacci analysis, the price retraced exactly to the Golden Zone, validating the first leg of the pullback.
3- The next step? A breakdown of the blue trendline would likely send us toward the Volunacci target at $108,600.
4- For confirmation, we're watching the RSI trendline — if it breaks down as well, it would strongly support the bearish continuation.
The setup is clean and developing as expected — it's all about following price and letting the chart guide the story.
Goldenzone
SWING IDEA - DEEPAK NITRITE LTDDeepak Nitrite , a leading chemical company known for its diverse product portfolio, is showing a promising setup for swing trading.
Reasons are listed below :
2500 Support Zone : The price is resting on a well-tested support level around 2500, adding to the reliability of a potential bounce.
Hammer Candle on Weekly Timeframe : The appearance of a hammer candle suggests a reversal could be on the horizon as buyers regain control.
Golden Fibonacci Support : The current price aligns with a key Fibonacci retracement level, providing additional support.
50 EMA Support on Weekly Timeframe : The price holding above the 50 EMA is a sign of continued strength and underlying support.
Trend Intact with Higher Highs and Higher Lows : The consistent formation of higher highs and higher lows reinforces a bullish trend.
Target - 3000 // 3170
Stoploss - weekly close below 2440
DISCLAIMER -
Decisions to buy, sell, hold or trade in securities, commodities and other investments involve risk and are best made based on the advice of qualified financial professionals. Any trading in securities or other investments involves a risk of substantial losses. The practice of "Day Trading" involves particularly high risks and can cause you to lose substantial sums of money. Before undertaking any trading program, you should consult a qualified financial professional. Please consider carefully whether such trading is suitable for you in light of your financial condition and ability to bear financial risks. Under no circumstances shall we be liable for any loss or damage you or anyone else incurs as a result of any trading or investment activity that you or anyone else engages in based on any information or material you receive through TradingView or our services.
@visionary.growth.insights


SWING IDEA - ATUL LTDAtul Ltd , a prominent Indian chemical manufacturing company, is exhibiting technical patterns that suggest a potential swing trading opportunity.
Reasons are listed below :
Strong Support Zone : The 5750-6000 range has proven to be a robust support zone, with prices bouncing off this level, indicating buying interest and a potential reversal.
Double Bottom Pattern on Weekly Timeframe : This pattern, characterized by two distinct troughs at similar levels, is a bullish reversal signal. It suggests that the downtrend may be over, and a new upward trend could be starting.
Reversal from Golden Fibonacci Zone : The price reversed from the 0.618 Fibonacci retracement level, often referred to as the "golden zone." This adds weight to the potential for an upward move.
Bullish Engulfing Candle on Weekly Timeframe : The recent weekly candle engulfed the previous 8 weekly candles, indicating a significant shift toward bullish sentiment and suggesting a potential strong rebound.
Increase in Volumes : A noticeable spike in trading volume often confirms the strength of a price move, indicating greater participation and confidence in the direction of the trend.
Target - 7200 // 7550
Stoploss - weekly close below 5600
DISCLAIMER -
Decisions to buy, sell, hold or trade in securities, commodities and other investments involve risk and are best made based on the advice of qualified financial professionals. Any trading in securities or other investments involves a risk of substantial losses. The practice of "Day Trading" involves particularly high risks and can cause you to lose substantial sums of money. Before undertaking any trading program, you should consult a qualified financial professional. Please consider carefully whether such trading is suitable for you in light of your financial condition and ability to bear financial risks. Under no circumstances shall we be liable for any loss or damage you or anyone else incurs as a result of any trading or investment activity that you or anyone else engages in based on any information or material you receive through TradingView or our services.
@visionary.growth.insights


Seeing a huge drop coming for GOLD this weekGOLD may retest 2318 area and complete an inverted head and shoulders, and then head up to resistance level which lines up perfectly on trendline resistance AND lines up perfectly at the 61.8% Fibonacci level, this is a very interesting level for these 3 lining up this trendline has been valid for months and very strong trendline resistance that has been tested multiple times. I suspect GOLD will plummet down to 2300-2280 by the end of this week, probably during London session as from my personal experience I have seen this happen multiple times and have taken this opportunity to profit off this pattern
moreover the DXY has been making impulses to the upside and healthy retracements to continue with another impulse this week if the trend continues, keeping on eye on news to support this bias and watching these levels on particular the 2340-2350 area

huge waterfall coming for GOLD this week, Be ready!GOLD may retest 2318 area and complete an inverted head and shoulders, and then head up to resistance level which lines up perfectly on trendline resistance AND lines up perfectly at the 61.8% Fibonacci level, this is a very interesting level for these 3 lining up this trendline has been valid for months and very strong trendline resistance that has been tested multiple times. I suspect GOLD will plummet down to 2300-2280 by the end of this week, probably during London session as from my personal experience I have seen this happen multiple times and have taken this opportunity to profit off this pattern
moreover the DXY has been making impulses to the upside and healthy retracements to continue with another impulse this week if the trend continues, keeping on eye on news to support this bias and watching these levels on particular the 2340-2350 area

COINbase Macro Analysis: To Keep You Informed Of OpportunityHi Guys! As always i try to bring ideas that catch my attention on the macro timeframes. The one that got my attention is Coinbase (COIN). Ive been tracking coinbase for some time now, ever since i discovered the Inverse Head and Shoulders pattern. (Ill be putting the link to that idea and others related to COIN below.
This current analysis will be assessing whether or not the Inverse head and shoulders pattern has more juice left or not in continuing the rally from the bottom at $31.00.
Pattern was confirmed when we broke the Head & Shoulders neckline.
This analysis is on the 1 week timeframe.
Some areas have been highlighted.
Major Resistance -> this is a critical area in my opinion, further gains being linked to us needing price to be ABOVE this lvl.
We are currently BELOW it.
But have not yet confirmed in my opinion.
Last weeks candle had equal top/bottom wicks, which usually means buyers and sellers were equaled out, not giving a direction.
We would need next week to play out in a more decisive manner. And for price to be ABOVE Major Resistance lvl.
We are also current ABOVE 21 EMA, as long as we stay ABOVE it, UPtrend is intact.
We've also had 2 Golden Crosses occur where 21 EMA and 50 SMA crossed ABOVE 100 SMA. As long as we stay crossed Uptrends tend to continue.
Ive also applied FIB retracement lvls from our current top to the bottom at $31.
We've been rejected from 0.786 lvl. Watch for a test of the 0.618 level which is known as the Golden Ratio. If 21 EMA is broken, it becomes more probable.
My personally opinion is that i think we will touch the 0.618 lvl.
We would need to maintain Support ABOVE here.
This area also coincides with a potential Consolidation range bottom.
Which I think is likely to be forming, as COIN tends to move like this as seen in previous history.
__________________________________________________________________________________
Thank you for taking the time to read my analysis. Hope it helped keep you informed. Please do support my ideas by boosting, following me and commenting. Thanks again.
Stay tuned for more updates on SNOW in the near future.
If you have any questions, do reach out. Thank you again.
DISCLAIMER: This is not financial advice, i am not a financial advisor. The thoughts expressed in the posts are my opinion and for educational purposes. Do not use my ideas for the basis of your trading strategy, make sure to work out your own strategy and when trading always spend majority of your time on risk management strategy.

🔑THETA: Shorting Chance in Midweek Dip🩸🔍Today, being Thursday, presents a favorable opportunity for opening positions as we analyze THETA to anticipate its trend and future movement.On the 4-hour timeframe, after a prolonged uptrend, THETA has reached resistance at $3.574 and is currently undergoing a correction. Closer examination reveals price consolidation in the second leg of the decline, with a bounce off support at $2.498, indicated by a green candle. It remains to be seen whether this level will hold or further decline will ensue.
📉If $2.498 support is breached, a short position could be initiated, with Fibonacci retracement levels serving as potential targets, as explained below.
💎Regarding indicators, the SMA25 is slightly lagging behind the price, suggesting potential price waiting for it to catch up, while the RSI exhibits divergence with two lows, necessitating patience for confirmation before considering a short position. Confirmation for short positions can be sought if the $37.47 level is breached.
✅The Fibonacci retracement drawn from the daily timeframe represents the higher wave cycle, indicating the current correction of the HWC. Therefore, sudden sharp upward movements in price are always possible.
📊Volume has diminished after reaching the $3.576 resistance, currently exhibiting range-bound behavior without providing clear directional cues.
🧠💼It's important to acknowledge the inherent risks in futures trading, with the potential for margin calls if risk management is neglected. Always adhere to strict capital management principles and utilize stop-loss orders, ensuring that the initial target offers a risk-to-reward ratio of 2

Gold short idea tp 1979Gold touched the FIB golden zone and from there looks like retracing. FVG also been filled.
I expect 1979 next week

Anatomy of Trade: Jan 27, 2024BEFORE I TAKE A BATH AND GO TO THE GAME, I DID THIS.
MAYBE IT'LL WORK OUT, MAYBE IT WON'T.
LET'S SEE HOW IT GOES.
smashkeyboardtoallowposting
fsdjfhkjenrwe,nmflsdvhdfkbw.dmascjgelrwerl;jsgdmfgkdfgdf

Anatomy of Trade: Jan 27, 2024BEFORE I TAKE A BATH AND GO TO THE GAME, I DID THIS.
MAYBE IT'LL WORK OUT, MAYBE IT WON'T.
LET'S SEE HOW IT GOES.
smashkeyboardtoallowposting
fsdjfhkjenrwe,nmflsdvhdfkbw.dmascjgelrwerl;jsgdmfgkdfgdf

AUD/USD: Reversal Sell Opportunity Confirmed!!!On November 29 and 30, AUD/USD touched a crucial pivot point at the price of 0.66411, indicating a potential change in direction, especially as it aligns with a level of miring Support and Resistance, suggesting a Major downtrend. The bearish reversal signal on the daily candle following the pivot point touch adds confidence to the potential downturn. The recent dovish stance conveyed by the Reserve Bank of Australia (RBA) further adds pressure on AUD/USD.
Technical Analysis:
Pivot Point and Support/Resistance: The price hitting the pivot point at 0.66411 suggests a potential reversal, particularly at the miring Support and Resistance level.
Bearish Reversal Signal: The formation of a bearish reversal pattern after touching the pivot point indicates weakness in the bullish momentum.
Major Downtrend: The trendline illustrates that AUD/USD is currently experiencing a Major downtrend.
Fundamental Analysis:
Dovish RBA Stance: The dovish statement from the RBA can enhance the downward pressure on AUD/USD.
Trading Scenario:
Considering the above factors, traders may contemplate the following scenario:
Wait for Correction: Exercise patience until the price undergoes a correction from the 0.66411 level.
Sell Limit with Confirmation: Initiate a sell position after a correction, with confirmation of further downside. Confirmation could involve the formation of a bearish pattern.
Target Take Profit: Set a take profit target around 0.64660, an area indicating the potential for further decline.
Stop Loss: Safeguard the position by placing a stop loss above the nearest resistance level or above the high of the confirmation candle.
It's crucial to continuously monitor market conditions, stay informed about the latest news, and practice prudent risk management. Trading always involves risks, and the final decision remains the responsibility of the trader.

Nifty 50 Call Option at Level 19086.60 (Golden ZONE)There Strong Uptrend going on Market taking an Support at Level 19086.60 to 18980 is Golden Zone to enter in trend

Potential Market Pullback: ES Futures Nearing Key Fib. LevelIn today's analysis, we will be focusing on the E-mini S&P 500 Futures (ES) and examining a recent spike that reached $4,300 on the 1-hour chart. As the market currently sits at $4,280, we'll explore the possibility of a pullback towards the Fibonacci retracement zone, specifically the 0.618 and 0.50 levels at $4,230 (Location A) and $4,210 (Location C) respectively. Additionally, we'll highlight the significance of previous resistance at $4,230 and the presence of a strong support level at $4,200.
Technical Analysis:
1. Spike and Fib Retracement: The recent price action in the ES futures witnessed a spike to $4,300, indicating a short-term bullish momentum. Drawing a Fibonacci retracement from the lowest low at $4,120 to the highest high at $4,300, we find the 0.618 retracement level at $4,230 and the 0.50 level at $4,210. These levels are important markers to watch for potential price reactions.
2. Previous Resistance: The $4,230 level coincides with a previous resistance zone, adding further significance to this price level. Markets often tend to exhibit support-turned-resistance behavior, suggesting that $4,230 could act as a significant barrier to further upside movement.
3. Strong Support at $4,200: Additionally, we observe a strong support level at $4,200, which has held firmly in the recent price action. This level may attract buyers looking to defend the ongoing bullish trend and could potentially contribute to a bounce or reversal in the price.
4. ADX Confirmation: Adding to the analysis, the ADX line (white) is currently declining, indicating a weakening of the recent bullish trend. Additionally, the Di- line (fuchsia) has experienced a recent spike, signaling increased bearish momentum. These ADX readings support the likelihood of a downward move in the near future.
Given the recent spike and the presence of key Fibonacci retracement levels, along with the previous resistance-turned-potential support at $4,230 and the strong support at $4,200, it appears likely that the ES futures could experience a pullback into the $4,230-$4,210 zone. Traders and investors should closely monitor price action around these levels for potential opportunities, considering factors such as candlestick patterns, volume, and additional technical indicators to confirm the validity of the expected pullback.

Crude Oil: Fibonacci Retracements, Support and Resistance LevelsI've had the opportunity to closely observe the crude oil market's impressive run after its historic dip into negative territory in 2020. To better understand the market's behavior, I've outlined a Fibonacci pull from the low in November 2020 to the high in March 2022. In this idea, I'll discuss the importance of support and resistance levels, as well as Fibonacci retracements, in the context of trading crude oil.
Before diving into the technical analysis, let's first touch on the educational aspect of support and resistance levels. Support levels are price points at which an asset's price is more likely to stop falling and start rising, while resistance levels are the opposite - price points at which an asset's price is more likely to stop rising and start falling. These levels can help traders identify potential entry and exit points for trades.
Similarly, Fibonacci retracements are an analytical tool derived from the famous Fibonacci sequence. They are used to identify potential support and resistance levels by measuring the percentage retracement of an asset's price between a low and a high. The most common retracement levels are 23.6%, 38.2%, 50%, and 61.8% (the most important level).
In my crude oil analysis, the 50% Fibonacci retracement level sits at $66.29 on a log scale. We saw the price tap and test this level for a few days before witnessing a significant gap to the upside. What's particularly intriguing isn't the support we're finding at the 50% retracement level, but rather the support and resistance levels I've outlined at $61.35, $85.88, and $93.33.
Should the price fall below the 50% retracement level, we have the downside support at $61.35. On the other hand, if the price continues moving upwards, we can expect resistance at $85.88 and $93.33. The $93 level is near the 23.6% Fibonacci level, indicating that we may encounter significant resistance at this point.
A few days ago, we observed a sizable gap at around $80 after production numbers were released. Generally, production cuts lead to a higher cost for assets like crude oil, as supply shrinks while demand remains steady.
If oil prices surpass the resistance level of $93-$94, there's a high likelihood we could see oil reaching $180 in the coming years – approximately two years out. Although I would assign a 20% probability to this scenario, it's essential to note that support and resistance levels have proven to be crucial in the history of oil trading. Crude oil is unlike other assets and has a reputation for trapping the herd.
So, where do you stand in the herd today? Understanding and effectively utilizing Fibonacci retracements, support, and resistance levels can be the key to navigating the crude oil market and making informed decisions in your trading journey.

🚀Short-Medium Term $DOGE #Long Setup🚀#dogecoin #doge $doge #dogetothemoon
A short term descending wedge has formed, with the lower timeframe RSI's reset, down and away from the local POC. The bottom of this wedge has hit the immediate 0.618 fib level, however that more "macro" 0.618 level has yet to be reached. Coincidentally, the measured move of an invalidation would, in fact, take price down to this "Golden Zone". Here, I've laid out 3 different possible outcomes.
1) Wedge plays out and a new high is made around $0.083
2) Wedge invalidates and upwards short-term trend is lost and price bounces at the "Golden Zone"
3) "Golden Zone" is surpassed and the high-volume node below it catches the knife and price bounces even further.
#NFA #DYOR

Bitcoin volatile! No stories - just factsEarlier this year, you had all the "expanded flat" lovers looking at the move and seeing this as one bit expanded flat. I humored the idea and had this alternate count in place for a while. Now that we've had the rejection, there's a few things to pay attention to.
Time cycles in the market refer to recurring patterns and rhythms in the behavior of financial markets over time. These cycles are typically seen as accurate indicators of future market movements and can be used to inform investment strategies. The June 2022 time cycle was a cycle high and the January 2023 time cycle was a cycle low. The half cycle is in April which I believe will be a low of sorts and then push into mid 2023 for the cycle high again.
Bitcoin was riding high on a wave of optimism as it neared the golden zone, but like a surfer who got a little too cocky, it may get wiped out and tumble towards a -23.6% extension target of $18,400. It's a tough break for Bitcoin, but at least it's not alone – the world's smallest violin is playing for all the investors who didn't take profits when they had the chance. In the meantime, Bitcoin can console itself by watching reruns of "The Office" and dreaming of the day when it can climb back up to its previous heights.
Maintaining below the golden zone (below $23,100) is ideal and would keep the door open for a move to the -23.6 extension which is also the golden zone of the entore 2023 bull move. Do this, and it would open the door for the massive cluster of algos sitting between $27,900 and $28,400 - which may be the top for Bitcoin in 2023. Just look at the battlefield up there. It would basically invalidate the expanded flat and would open the door to a simple ABC correction from the low in November 2022.
Well folks, until next time. I'll miss all of you almost as much as I'll miss pretending to work while scrolling through memes. But don't worry, I'll always be here in spirit, haunting the coffee machine and stealing your staplers. Keep on keeping on, and remember – life is too short to take yourself seriously!

SPX has many options to choose fromJack is back! Jack has been trading the S&P 500 for years and knows that there are always many options to choose from when it came to making a trade. He watches the market closely, paying attention to the resistance and support levels that he knew could make or break his decisions.
One day, Jack noticed that there was significant resistance near the 4050-4080 range , which is near the 61.8% golden zone rejection area. He knew that if the market couldn't break through that range, it would continue to look bearish. However, Jack also knew that if they could break through that range, there was a high degree of possibility that the market would climb to 4300 in the next few weeks.
Jack also knows that there is significant support at 3800 , and he knows that if the market dropped to that level, it would be a good opportunity to buy more stocks at a lower price to hold for a few weeks.
Jack is keeping an open mind when it comes to the wedge formation, but he knows that it is only a projection and not the primary count. He understands that projections are based on assumptions and could be unreliable, and that it is too early to make any predictions on a wedge trade. Instead, Jack is monitoring the market closely, keeping an eye on any changes in the resistance and support levels. He knows that it is important to stay informed and make informed decisions based on the current state of the market, rather than relying on projections or assumptions. While the wedge formation is an interesting development, Jack is careful not to let it cloud his judgment or influence his trading decisions until more concrete evidence is available.

GOLDEN ZONE - FibonacciHello guys! Take a look at how smoothly the market respects the Golden Zone on Fibonacci retracement levels. The Golden Zone or Golden Ratio is the area between 50% and 61.8% on retracement levels, which acts as a strong support zone. After an impulse, on the correction the price usually gets rejected by this zone and it continues its previous trend. However, if it is broken, there is a high change of a trend reversal, as we can see in this chart.

" GBPUSD " Wolfe Pattern And golden ZoneHello Trader's ,, Let's Explain Together The Movement For GBPUSD For Next Days ,, And What Will Happen ,,
We Can See On Chart 2 Reasons To Sell From This Area ,,
1- Wolfe Waves Pattern Done And Ready To Down
2- Golden Zone With Our secret Numbers On Chart
The Target And Stop Lose On Chart ,, Hope To Be Always In Profit With Us


